ABSTRACT
MENEELY, ANDREW PHILIP. Investigating the Relationship between Developer Collaboration and Software Security. (Under the direction of Dr. Laurie Williams).
With each new developer to a software development team comes a greater challenge to manage the communication, coordination, and knowledge transfer amongst teammates. Lack of team cohesion, miscommunications, and misguided effort can lead to all kinds of problems, including security vulnerabilities. In this dissertation research, we focus on examining the statistical relationships between development team structure and security vulnerabilities. The statistical relationships demonstrated in this research provide us with (a) predictive models for finding security vulnerabilities in software prior to its release; and (b) insight into how effective software development teams are organized.
software products, and discovered a consistent statistical association between metrics measuring developer activity and post-release security vulnerabilities.
Perception Corroboration Study. We surveyed developers from the same three open source projects and found that developers’ perceptions of collaboration and expertise corroborate evidence of collaboration and expertise in developer activity metrics.
Synthesis Study. We gathered the results from the related work both inside software
engineering and in the field of socio-technical research in general. We synthesized our results into a single paradigm with conjectures for socio-technical research in software engineering.
These three research project have resulted in the following findings:
Source code files changed by many developers (in our case studies, 6 developers or more) are more likely to have at least one post-release security vulnerability.
Vulnerability prediction models based on developer activity metrics can be used across different software development projects.
If two developers change the same source code within the same month, they typically perceive they are collaborating with each other.
The degree of separation between two developers in a developer network typically represents their perceived socio-technical distance.
Investigating the Relationship between Developer Collaboration and Software Security
by
Andrew Meneely
A dissertation submitted to the Graduate Faculty of North Carolina State University
in partial fulfillment of the requirements for the degree of
Doctor of Philosophy
Computer Science
Raleigh, North Carolina 2011
APPROVED BY:
_______________________________ ______________________________
Laurie Williams Tao Xie
DEDICATION
BIOGRAPHY
Andy Meneely is just a guy who loves studying Computer Science, and has been doing it for over half of his life.
ACKNOWLEDGMENTS
Metrics can provide an abstract, impartial view of complex objects in a complex world. Sadly, no metric can possibly quantify my gratitude for the massive network of support I have received over the last five years. So, I will summarize my thanks in the following plain English bulleted list. My deepest thanks:
To Kelly, for her unending patience, for being my compass for reality, and for being married to a poor grad student all these years;
To Laurie, for her amazing feedback, inspiring drive, and uncanny ability to find funding; To Dad, for his contagious passion for knowledge and steadfast dedication to the search
for God’s truth;
To Ben, for giving me faith in collaboration and for challenging me every moment; To Lucas, for his patient mentoring and his skepticism;
To Mei, for sharing in my experience at every step of this crazy journey;
To Aaron, for his refreshing perspective on both software engineering and on life;
To the rest of the Realsearch group, past and present (e.g. Mark, Yonghee, Sarah, Jiang, Dright, Michael, John, Andrew, Raza, Jerrod, Eric), for their continually perceptive comments;
TABLE OF CONTENTS
LIST OF TABLES ... x
LIST OF FIGURES ... xi
1 Introduction ... 1
2 Background ... 7
2.1 Network Analysis ... 7
2.2 Software Development Terminology ... 8
2.3 Security Terminology ... 8
2.4 Statistical Techniques ... 9
3 Related Work ... 12
3.1 Prior Work ... 12
3.2 Quantifying Developer Collaboration ... 14
3.3 Empirical Studies on Reliability and Security ... 19
4 Security Correlation Study ... 22
4.1 Developer Activity Metrics ... 23
4.1.1 Diversity in Perspectives ... 24
4.2 Case Studies ... 29
4.2.1 RHEL4 Linux Kernel ... 31
4.2.2 PHP Programming Language ... 32
4.2.3 Wireshark Network Protocol Analyzer ... 32
4.3 Empirical Analysis ... 33
4.3.1 Association: Are The Metrics Correlated With Vulnerable Files? ... 33
4.3.2 Discriminative Power: Are Some Metric Values Better Than Others? ... 35
4.3.3 Predictability: How Many Vulnerable Files Can Be Predicted? ... 38
4.3.4 Cross-Project Analysis: Can Predictive Models be Transferred? ... 40
4.4 Limitations of Security Correlation Study ... 41
4.5 Contributions of Security Correlation Study ... 42
5 Perception Corroboration Study ... 44
5.1 Developer Network Used in Perception Corroboration Study ... 46
5.2 Research Methodology ... 47
5.2.1 Online Survey ... 47
5.2.2 Conducting the Study ... 48
5.3 Case Studies ... 50
5.3.2 PHP Programming language ... 53
5.3.3 Wireshark network protocol analyzer ... 54
5.3.4 Criterion for Developer Network Edges ... 55
5.4 Perception Corroboration Analysis ... 58
5.4.1 Collaborators and Edges... 58
5.4.2 Distance between Two Developers ... 61
5.4.3 Centrality and Reputed Expertise ... 66
5.5 Limitations of the Perception Corroboration Study ... 69
5.6 Contributions of the Perception Study ... 70
6 Synthesis Study ... 72
6.1 Methodology ... 73
6.2 Recent Socio-Technical Research ... 74
6.2.1 Literature Summary... 74
6.2.2 Socio-Technical Factors ... 77
6.3 The Socio-Technical Software Developer Network ... 79
6.3.1 Connecting Developers ... 79
6.3.2 Incorporating Time in Developer Networks ... 82
6.3.4 Variations on the Developer Network ... 86
6.4 Trends and Conjectures ... 87
6.4.1 Number of Developers Changing a File ... 87
6.4.2 The Importance of Central Developers ... 89
6.4.3 Network Robustness and Developer Turnover ... 91
6.4.4 Open Source Development and Proprietary Development ... 92
6.5 Summary of the Synthesis Study ... 94
7 Contributions... 96
8 Future Work ... 98
REFERENCES ... 99
APPENDICES ... 110
LIST OF TABLES
Table 1. Developer activity metrics ... 24
Table 2. Summary of Case Study Projects... 29
Table 3. Mann-Whitney-Wilcoxon test for association ... 34
Table 4. Discriminative Power results with example critical values ... 37
Table 5. Discriminative Power results for critical values based on a fixed IR= 10% ... 38
Table 6. Bayesian Network prediction, 10x10 cross-validation. ... 39
Table 7. Cross-project Bayesian network prediction ... 41
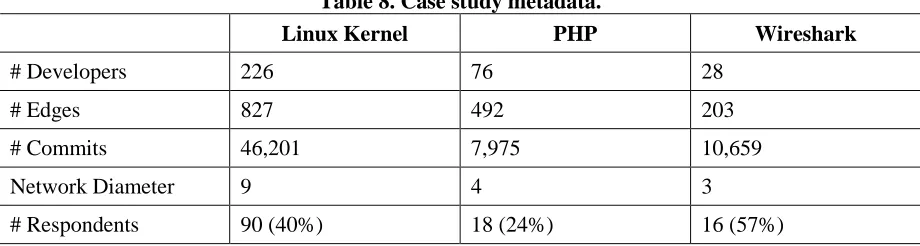
Table 8. Case study metadata... 51
Table 9. Unweighted distances between respondents and their named collaborators ... 60
Table 10. Mean of squared Spearman rank correlation coefficients between unweighted and perceived distances ... 64
Table 11. Mean of squared Spearman rank correlation coefficients between weighted and perceived distances ... 65
Table 12. Summary of Votes for Experts ... 68
Table 13. Association between centrality and reputed expertise ... 69
Table 14. Recent literature using a socio-technical perspective on development teams ... 76
LIST OF FIGURES
Figure 1. Example contribution network. ... 28
Figure 2. Screenshot of the respondent verifying his or her identity in the survey. ... 48
Figure 3. Visualization of the Linux kernel developer network ... 52
Figure 4. Visualization of the PHP developer network. ... 54
Figure 5. Visualization of the Wireshark developer network ... 55
Figure 6. Width of the edge window and number of edges ... 57
Figure 7. Question regarding collaborators and edges... 59
Figure 8. Screen capture of the question regarding collaborators and edges ... 59
Figure 9. Question socio-technical distance between two developers. ... 62
Figure 10. Example screen capture from custom survey system. ... 63
Figure 11. Question regarding expertise ... 67
Figure 10. Screen capture of the question regarding project expertise. ... 67
Figure 13. Resulting developer network from example... 85
1
Introduction
With each new developer to a software development team comes a greater challenge to manage the communication, coordination, and knowledge transfer amongst teammates. In large software development projects, no single person can possibly know every aspect of the system, so the team members must be organized into various structures of communication and coordination. Lack of team cohesion, miscommunications, and misguided effort can lead to all kinds of problems in the software product. An understanding of developer collaboration from the perspective of the entire team could help structure development efforts.
With respect to structuring development teams, conventional wisdom leads us in many different directions. One perspective originates from Eric Raymond in The Cathedral and the Bazaar [49], in the form of what he calls Linus’ Law:
Given a large enough beta-tester and
co-developer base, almost every problem will be characterized quickly and the fix obvious to someone. Or, less formally, given enough eyeballs, all bugs are shallow.
ideal development team ought to include not only many developers, but a large amount of collaboration among those developers.
Fred Brooks presents a competing perspective in his widely-known book, The Mythical Man-Month [10]:
…training cannot be partitioned, so this part of the added effort varies linearly with the number of workers. […] The added effort of communicating may fully counteract the division of the original [development] task.
[…] Adding manpower to a late project makes it later.
The latter sentence is known as “Brooks’ Law.” While Brooks was specifically discussing effort estimation and productivity, one could apply a similar argument to many negative outcomes. Too many new developers in a short period of time can potentially lead to inconsistent implementation, poor system integration, or even security vulnerabilities being injected into the system. So, according to Brooks’ reasoning, having too many developers working together brings about a “too many cooks in the kitchen” effect that could negatively affect the product.
and test one another’s work. When the team organization becomes too complex, collaboration suffers, and so could the product itself.
When team members are not properly coordinating effort, the product’s security is of particular concern. Vulnerabilities are rare, yet expensive. Our own case studies have shown that security vulnerabilities are rare occurrences: between 3% and 6% of source code files have a post-release vulnerability in the three case studies we examined [32], [33], [56]. As for the financial risk, venders can lose 0.6% of their stock market value following the announcement of a security vulnerability in their software [62]. Furthermore, finding security vulnerabilities in software requires the developer to “think like an attacker”, which is a skill that requires both expertise and objectivity [28], [71]. With these expensive, hard-to-find security vulnerabilities lurking in huge code bases that require objective experts to find and fix, teams need to organize their development for better fortification.
communication, and coordination. In software development, for example, two developers working on the same code represents a potential socio-technical connection (e.g. shared knowledge) between the two developers. In this research, we derive our developer activity metrics from a combination of analyzing network structures (i.e. graphs) where connections are defined by socio-technical factors of how software developers work together.
We approach our study of developer activity metrics from two directions: whether or not developer activity metrics are related to security, and whether or not developer activity metrics actually represent the structure of the development team. The latter is a form of internal validity, and the former is external validity of software metrics [15], [16], [27]. Additionally, we synthesize our results with the results of other case studies to provide conjectures about developer activity metrics and socio-technical research in general. Specifically, the research questions we examine in this dissertation are:
Security Correlation Study (Chapter 4). Are developer activity metrics related to security vulnerabilities?
o Are developer activity metrics statistically associated with vulnerable files?
o Can a “critical point” be found in each metric’s range that is linked to an increase in the likelihood of having a vulnerable file?
o How many of the vulnerable files can be predicted by developer activity metrics?
Perception Corroboration Study (Chapter 5). Does the developer network represent
the socio-technical structure of the development team?
o If two developers work on the same file in the same month, then do they perceive they are collaborating?
o Does the distance between two developers in the developer network represent the perceived degree of separation between those two developers?
o Does having a high developer centrality in the developer network indicate being a project expert?
Synthesis Study (Chapter 6). What is the status of socio-technical research of software development teams?
o How does the number of developers working on source code affect its quality?
o How does developer network centrality relate to roles and responsibilities of individual developers in the development team?
o How does developer network robustness relate to risk in software development?
o How does the developer network differ between open source and closed source case studies?
2
Background
In this section, we provide definitions for terms used and techniques used throughout this document.
2.1 Network Analysis
Network analysis is the study of characterizing and quantifying network structures, represented by graphs [8]. In network analysis, vertices of a graph are called nodes, and are connected via edges. A sequence of non-repeating, adjacent nodes is a path, and a shortest path between two nodes is called a geodesic path. Note that a geodesic path is not necessarily unique, that is, two or more paths may be tied for the shortest path between two nodes. In the case of weighted edges, the geodesic path is the path of minimum weight. The diameter of a network is equal to the length of the longest unweighted geodesic path in the network. Informally, the unweighted geodesic path represents the “degree of separation” between two nodes.
Additionally, we analyze groups of nodes with clusters. A cluster of nodes is a set of nodes such that the number of intra-set connections greatly outnumbers the number of inter-set connections [8]. For analyzing clusters in a graph, we used the edge betweenness clustering technique [8]. The edge betweenness clustering technique is a standard network
analysis algorithm based on the principle that edges of highest betweenness are also edges that connect the largest clusters in the network. In our studies, we applied this principle to identify edges that lie between multiple clusters of nodes.
2.2 Software Development Terminology
When we refer to a developer, we are referring to any person who has been making changes to the source code of a given project. By extension, we use the term development team to refer to the entire group of developers who are changing code on a given software
project. Depending on the team culture, testers and managers may or may not be changing the source code during the development process.
2.3 Security Terminology
release. If a vulnerability has never been found for a given source code file, then we label that file as being “neutral”.
2.4 Statistical Techniques
Throughout this research, we use a variety of statistical techniques to analyze our observational data. In many situations, we use binary classification, where each of our observations is a source code file that is classified as either vulnerable or neutral. To test if a numerical metric is associated with being vulnerable at a statistically significant (p<0.05) level, we use the Mann-Whitney-Wilcoxon (MWW) rank sum test. We use the MWW test because it does not assume an underlying normal distribution for our metrics [48]. The MWW test computes a p-value, which we compare to 0.05 to reach our conclusions.
P=TP/(TP+FP) (1) Recall (R) is defined as the proportion of total vulnerabilities found:
R=TP/(TP+FN) (2)
Inspection Rate (IR) is the proportion of total files that were classified as vulnerable. We introduced the term in our own publications as a way to estimate the amount of effort that a software development team would need to plan for if they used our model [56].
IR=(TP+FP) /(TP+TN+FP+FN) (3)
Optimally, inspection rate is minimized while precision and recall are maximized. For example, an IR=10% and R=50% means that the classifier found 50% of the known vulnerabilities in just 10% of the files. A classifier with P=25% means that, of the files classified as vulnerable, 25% were actually vulnerable.
Additionally, we use the F-measure as a combination of precision and recall. We use the measure primarily to compare the overall predictive performance of two models. The F-measure contains a parameter β that allows one to assign a higher weight to either precision or recall. The F-measure is defined in Equation 1 as the harmonic mean of precision and recall, where the parameter β represents the weight to which one assigns recall over precision [23].
(4)
rank correlation coefficient is a non-parametric measure of the linear relationship between two random variables. In some situations, we aggregated many Spearman coefficients by computing their mean. We test the significance of this mean by computing a 95% confidence interval for the following transformation of Spearman’s r:
√
3
Related Work
Our own prior work is covered in Section 3.1. In Sections 3.2 and 3.3, we cover recent related work in the area of measuring developer collaboration, metrics vulnerability prediction, and software metrics studies, respectively.
3.1 Prior Work
In a study at Nortel [37], we examined the relationship between developer activity metrics and reliability. The empirical case study examined three releases of a large, proprietary networking product. The authors used developer centrality metrics from the developer network to examine whether files are more likely to have failures if they were changed by developers who are peripheral to the network. The authors formed a model that included metrics of developer centrality, code churn (the degree to which a file was changed recently), and lines of code to predict failures from one release to the next. Their model’s prioritization found 58% of the system’s failures in 20% of the files, where a perfect prioritization would have found 61%. The study did not include work on developer clusters, unfocused contributions, or security.
We also performed an empirical case study [29] [34] of the OpenMRS1 healthcare system to examine how developers collaborate on issue tickets. We proposed two annotations to be used in issue tracking systems: solution originator and solution approver. We annotated which developers were originators or approvers of the solution to 602 issues from the OpenMRS healthcare system. We used these annotations to augment the version control logs
and found 47 more contributors to the OpenMRS project than the original 40 found in the version control logs. Using social network analysis, we found that approvers are likely to score high in centrality and hierarchical clustering. Our results indicate that issue tracking annotations are an improvement to developer activity metrics that strengthen the connection between what we can measure in the project development artifacts and the team's collaborative problem-solving process.
In collaboration with Cisco [30], we performed a longitudinal case study of a development project examining team expansion. Using team-level metrics, we quantified characteristics of team expansion, including team size, expansion rate, expansion acceleration, and modularity with respect to department designations. We examined statistical correlations between our monthly team-level metrics and monthly product-level metrics. Our results indicate that increased team size and linear growth are correlated with later periods of better product quality. However, periods of accelerated team expansion are correlated with later periods of reduced software quality. Furthermore, our linear regression prediction model based on team metrics was able to predict the product’s post-release failure rate within a 95% prediction interval for 38 out of 40 months. Our analysis provided insight for project managers into how the expansion of development teams can impact product quality.
relationships amongst the criteria. We present an analysis of the criteria’s categorization, conflicts, common themes, specific benefits, and philosophical motivations behind the validation criteria. Researchers proposing new metrics can consider applying these validation criteria using our analysis.
3.2 Quantifying Developer Collaboration
The topics of developers and collaboration have been examined in several recent empirical studies. All of the studies, however, either examine the meaning of developer activity metrics or relate them to reliability. None of the studies relate developer activity metrics to security.
Wolf, et al. [70] applied social network analysis techniques to do an historical case study of the IBM Jazz development platform. Their socio-technical network was designed to examine the “relationship between successful coordination outcome and communication structures” in software teams. That is, the researchers were examining if the outcome of coordinating with each other resulted in a failed build. Forming a developer network based on recorded communication in the team, the researchers applied social network analysis measures to the network. No individual measure was able to successfully predict the outcome of the build, but they found that a combination of their network analysis measure was able to predict successful build outcomes with a 55% to 75% recall and 50% to 76% precision.
how open source developers self-organize. The authors use similar network structures as our developer network to find the presence of sub-communities within open source projects. In addition to examining version control change logs, the authors mined email logs and other artifacts of several open source projects to find a community structure. The authors conclude that sub-communities do exist in open source projects, as evidenced by the project artifacts exhibiting a social network structure that resembles collaboration networks in other disciplines. In our study, we leverage network analysis metrics as an estimation of collaboration and examine their relationship to vulnerabilities in the project.
Pinzger et al. [17] were the first to propose the contribution network. The contribution network is designed to use version control data to quantify the direct and indirect contribution of developers on specific resources of the project. The researchers used metrics of centrality in their study of Microsoft Windows Vista and found that closeness was the most significant metric for predicting reliability failures. Files that were contributed to by many developers, especially by developers who were making many different contributions themselves, were found to be more failure-prone than files developed in relative isolation. The finding is that files which are being focused on by a few developers are less problematic than files developed by many developers. In our study, we use centrality metrics on contribution networks to predict vulnerabilities in files.
cohesiveness and diverse contributions. Among the findings is that more edits made by many, non-cohesive developers leads to more problems post-release. The OOW model was able to predict with 87% average precision and 84% average recall. The OOW model bears a resemblance to the contribution network in that both models attempt to differentiate healthy changes in software from the problematic changes.
Weyuker et al. [25] examined various releases of a large industrial software system to predict which files are most likely to contain the largest number of faults. Inspection guidance and automated testing efforts are among the applications intended for their fault prediction model. Their model is based on the negative binomial distribution and their model’s variables, based on developer information, attempt to capture information about the amount and the type of developers who have worked on any given file. Validation for their model included a comparison with a working model based on static code metrics and churn information. Weyuker et al. reported finding 84.9% of the faults in 20% of the files with the developer information, where without the developer information, 83.9% of the faults were found. The amount of failures found using the optimal prioritization was not mentioned. Our models use some similar developer counts in combination with network metrics to predict failures.
critical, failure-prone binaries, which was better than object-oriented complexity metrics that only identified 30%.
Mockus and Weiss [38] used metrics based on developer information for failure prediction to assess risk in a large industrial software system. Developer metrics included counts of distinct developers and a quantitative measurement of developer experience in terms of recent changes of the current project, experience in the subsystem, and in the product overall. They used step-wise variable selection to construct a logistic regression model for estimating post-release failures.
Hudepohl et al. [16] used developer information in combination with various other metrics to create a risk assessment tool at Nortel called EMERALD. The developer information was a measurement of experience similar to the variables used by Mockus and Weiss. EMERALD’s developer variables, however, incorporated developer experience in terms of Nortel career, as opposed to specific projects. For example, one of the experience measurements was the count of the number of developers who were within their first ten code updates while working at Nortel as a way to identify inexperienced developers. EMERALD’s other variables included complexity metrics, customer usage metrics, churn information, and past failure counts from both testing and post-release phases. Hudepohl et al. reported that over half of the field failure patches were correctly identified as “red” (highest risk) in 20% of the files.
skills and experience of developers, they did not consider developer information in their model. Nonetheless, they used a stepwise logistic regression model and a cross-validation classification analysis to validate their results. Most of the variables in their model could be classified in the categories of object-oriented metrics and code churn information. Their results from cross-validation analysis showed less than 20% false positives and false negatives, with an estimated verification effort savings of 29%. We used developer information in our model, however, not based on skill but on the structure of developer connections within the developer network.
Bird et al. [5] performed an empirical case study of the Microsoft Windows Vista operating system to examine if software quality suffers under distributed development. They compared the number of post-release failures for binaries that were developed by collocated teams. They examined several levels of collocation, including sharing a building, cafeteria, campus, locality (i.e. region), and continent. In general, the binaries showed no statistically significant difference in number of post-release failures between the distributed and collocated teams.
3.3 Empirical Studies on Reliability and Security
Nagappan and Ball [21] used metrics based on code churn data to predict defect density in Windows Server 2003. Their hypothesis was on comparing the predictive power of relative code churn metrics to absolute code churn metrics. A relative code churn metric, as defined by Nagappan and Ball, is one that is normalized by parameters such as lines of code, files counts, etc. Multiple linear regression, Principle Component Analysis, and step-wise variable selection were all used to make predictions about defect density. Data splitting was used to validate the predictive power of the chosen model and to show that relative code churn metrics are more powerful than absolute code churn metrics. Along with the use of code churn metrics, similar statistical techniques to ours were used, such as multiple linear regression, logistic regression, and step-wise variable selection.
Shin and Williams [57], [58] investigated whether the code level complexity metrics such as cyclomatic complexity can be used as indicators of vulnerabilities at the function level. The authors performed a case study on the Mozilla JavaScript Engine written in C/C++. Their results included statistically significant correlations (Spearman r=0.30 at best) between complexity metrics and vulnerabilities. Interestingly, the complexity measures for vulnerable functions were higher than the ones for faulty functions. Results of the vulnerability prediction using logistic regression showed very high accuracy (over 90%) and low false positive rates (less than 2%), but the false negative rate was very high (over 79%). To extend the study, Shin et al. [20], evaluated the statistical connection between vulnerabilities and metrics of complexity, code churn, and developer activity. The study denotes two case studies of large, open source projects: multiple releases of Mozilla Firefox and the Red Hat Enterprise Linux 4 kernel. Among the findings include a statistically significant correlation between metrics of all three categories and security vulnerabilities. Also, in the Mozilla project, a model containing all three types of metrics was able to find 70.8% of the known vulnerabilities by selecting only 10.9% of the project’s files.
Walden et al. [65] analyzed the association between the security resource indicator (SRI) and vulnerabilities on fourteen open source PHP web applications. The SRI is measured as a sum of binary values depending on the existence of the four resources in development organizations: a security URL, a security email address, a vulnerability list for their products, and secure development guidelines. The researchers found that SRI is useful to compare security levels between organizations, but does not indicate vulnerable code locations. Additionally they measured the correlation between three complexity metrics and vulnerabilities. The correlations varied, with complexity metrics performing similarly as code size and code churn metrics (Spearman r=0.31 at best). The study measured vulnerability density using a static analyzer, not with reported vulnerabilities.
4
Security Correlation Study
Open source software is often considered to be secure [23], [68]. One factor in this confidence in the security of open source software lies in leveraging large developer communities to find vulnerabilities in the code [23], [68]. Eric Raymond states Linus’ Law as “Given enough eyeballs, all bugs are shallow”. According to Raymond’s reasoning, diversity of developer perspectives ought to be embraced, not avoided. Therefore, more developers mean more vulnerabilities found and fixed, or even prevented.
But does Linus’ Law hold up ad infinitum? Can a project have too many developers, resulting in insecure software?
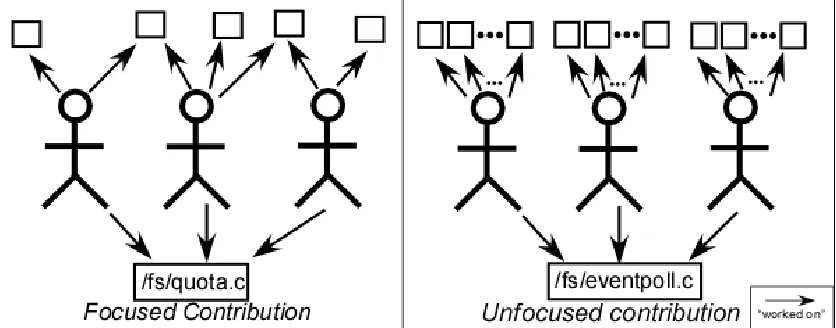
One opposing force to Linus’ Law might be the notion of “too many cooks in the kitchen”, or what has been called an unfocused contribution [47]. Consider having many people make a meal: without enough coordination and communication, ingredients can get skipped, added twice, or significant steps of the recipe may be left out. The meal can suffer as a result of too many people. Likewise, if source code does not receive the focus it needs because of too many people, perhaps the security of a software project can suffer as a result.
An analysis of the structure of open source developer collaboration can help the community understand how this structure impacts the prevention or the injection of security vulnerabilities. We performed an empirical analysis of Linus’ Law and unfocused contributions in the open source Red Hat Enterprise Linux 4 (RHEL4) kernel2, the PHP
programming language3 and the Wireshark4 network protocol analyzer. We performed an empirical analysis by quantifying developer collaboration and unfocused contributions into developer activity metrics. We used version control change logs to calculate four developer activity metrics that quantify Linus’ Law and unfocused contributions. We found a statistical association between all four developer activity metrics and vulnerabilities. Lastly, we perform a cross-project analysis to examine if predictive models can be trained on multiple projects and applied to another project.
4.1 Developer Activity Metrics
In our case studies, we used the version control logs to analyze development activity. As a project progress, developers make changes to various parts of the system. With many changes and many developers, changes to files tend to overlap: multiple developers may end up working on the same files around the same time, indicating that they share a common contribution, or a connection, with another developer. As a result of which files they contribute to, some developers end up connected to many other highly connected developers, some end up in groups (“clusters”) of developers, and some tend to stay peripheral to the entire network.
Both developers and files become organized into a network structure with some developers/files being the middle of the network, in a cluster, or on the outside. In this section, we quantify the structure of changes in the system using network analysis to create four developer activity metrics. We define our suite of developer activity metrics based on
3
two networks: developer networks and contribution networks, as will be discussed in Sections 4.2.1 and 4.2.2, respectively.
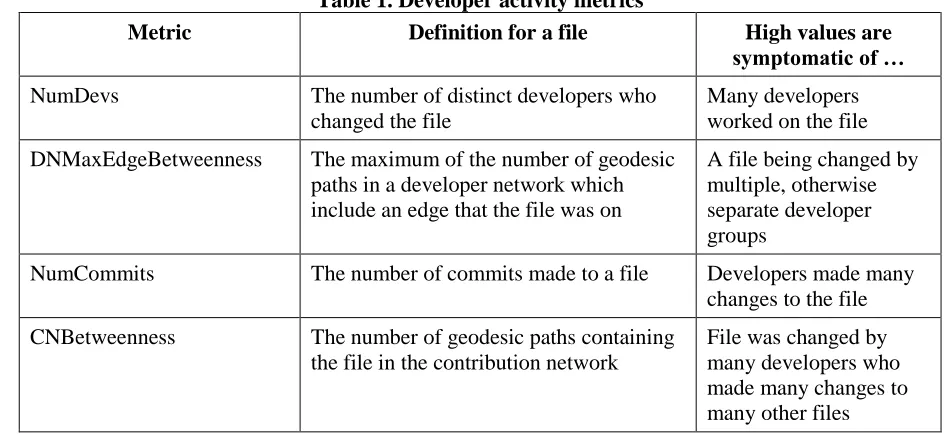
A summary of the interpretation for each of the four metrics can be found in Table 1. We empirically evaluate these metrics as indicators of vulnerable files in Section 4.3.
Table 1. Developer activity metrics
Metric Definition for a file High values are symptomatic of …
NumDevs The number of distinct developers who
changed the file
Many developers worked on the file
DNMaxEdgeBetweenness The maximum of the number of geodesic
paths in a developer network which include an edge that the file was on
A file being changed by multiple, otherwise separate developer groups
NumCommits The number of commits made to a file Developers made many
changes to the file
CNBetweenness The number of geodesic paths containing
the file in the contribution network
File was changed by many developers who made many changes to many other files
4.1.1 Diversity in Perspectives
The NumDevs metric is the number of distinct developers who made a commit to the file. According to the reasoning behind Linus’ Law, NumDevs should have a positive impact on the security of a file, leading to a hypothesis that neutral files would have contributions by more developers than vulnerable files.
The number of developers contributing to one file, however, is not the only aspect of Linus’ Law we wish to quantify. We can also look at how developer groups (or clusters) form and how strongly connected these clusters are. Two separate groups may be working on similar areas without working together. According to Raymond’s reasoning about diverse perspectives resulting in better quality, files worked on by otherwise-separated developer groups ought to be more likely to be vulnerable because the groups are not fully working with each other.
To empirically analyze developer groups, we need to first measure developer collaboration. The first step we take to formally estimate developer collaboration is to use a developer network [29], [32], [33], [35], [37], [56]. In our developer network, two developers are connected if they have both made a change to at least one file in common during a specified period of time (one month in our studies). The result is an undirected, unweighted, and simple graph where each node represents a developer and edges are based on whether or not they have worked on the same file within a specified period of time.
worked on by otherwise-separated clusters, therefore, may be more likely to have a vulnerability because the two clusters are not working together and embracing diversity in perspectives.
In this study, we are using a developer network cluster metric to identify files that have been worked on by otherwise-separated clusters of developers. To this end, we use the edge betweenness clustering technique (described in Section 2.1) [50], [66] for discovering developer clusters. The motivation for using edge betweenness is that the betweenness of edges within a cluster will be very low since the geodesic paths will be evenly distributed (in most cases, developers are directly connected to each other within clusters). Since files have a many-to-many relationship to edges, we use the maximum of edge betweenness of the files in the developer network, hence DNMaxEdgeBetweenness.
4.1.2 Unfocused Contributions
In the open source community, some developers may choose to make changes to many different parts of the system without collaborating with other developers who could share knowledge about the system and provide feedback on the suggested change. This effect has been referred to as an unfocused contribution [32], [33], [47] and could be a source of security problems.
To empirically analyze unfocused contributions, we use two metrics: NumCommits and CNBetweenness. The NumCommits metric is calculated similarly to NumDevs: taken directly from the version control logs. NumCommits is the number of commits made to the file during the time period under study. Note that NumCommits and NumDevs can vary independently: a file can have many commits and few developers. Also, NumDevs could also be classified as an unfocused contribution metric. If “too many developers” working on a file result in the file being more vulnerable, then the meaning behind the association would support the “too many cooks in the kitchen” notion.
However, NumCommits and NumDevs only represent the number of people and changes, not what else those developers were also working on at the time. Thus, we add a third, more specific metric to our study: CNBetweenness.
developers or files to files). The weight of an edge is the number of version control commits a developer made to the file.
We use the betweenness centrality measurement to quantify the focus made on a given file. If a file has a high betweenness, then it was changed by many developers who made changes to many other files. If a file had a low betweenness, then the file was worked on by fewer developers who made fewer changes to other files.
The CNBetweenness of a file is increased by (a) having many developers work on a file, and (b) having developers work on many different files. However, one can also improve (i.e. decrease) a file’s CNBetweenness by changing which developers work on which files rather than just reducing the amount of work for developers. As a result, CNBetweenness can be useful for assigning tasks to developers without adjusting the level of change in a file.
4.2 Case Studies
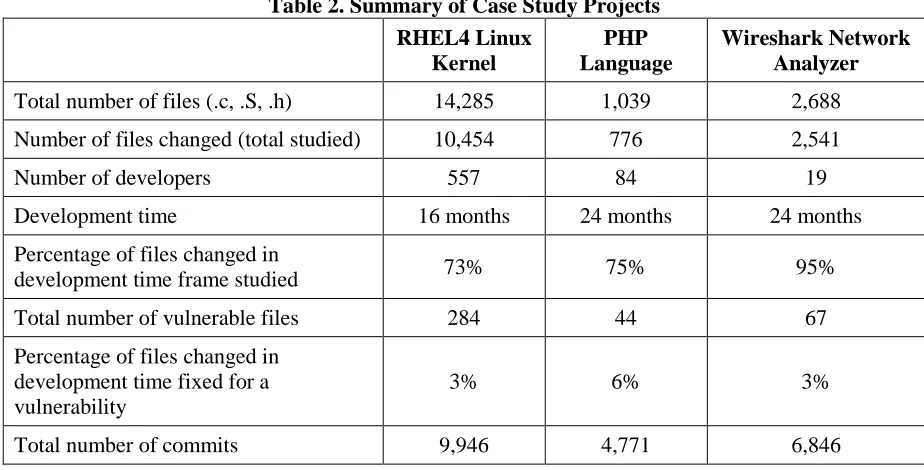
In the following sections, we describe the three open source projects we performed our case studies on. Note that the version control histories of all three projects contain records of “committers”, which in this study we refer to as “developers”. All three projects use the C programming language and some assembly, so we only included files with the file name extensions: .c, .S, and .h. Table 2 contains metadata on all three projects.
Table 2. Summary of Case Study Projects RHEL4 Linux Kernel PHP Language Wireshark Network Analyzer
Total number of files (.c, .S, .h) 14,285 1,039 2,688
Number of files changed (total studied) 10,454 776 2,541
Number of developers 557 84 19
Development time 16 months 24 months 24 months
Percentage of files changed in
development time frame studied 73% 75% 95%
Total number of vulnerable files 284 44 67
Percentage of files changed in development time fixed for a vulnerability
3% 6% 3%
We performed our analysis on three software projects: the Linux kernel, the PHP programming language, and the Wireshark network protocol analyzer [32], [33]. We chose these three projects as representatives of a widely-used open source projects with varying domains and varying developer community sizes. A summary of all three projects can be found in Table 2.
Our data set in each study included a labeling of whether or not a source code file was patched with a post-release vulnerability (“vulnerable” or “neutral”). We chose the label “neutral” for files with no known vulnerabilities because we do not know that the file truly has zero vulnerabilities, just no known vulnerabilities. Gathering the security data involved tracing through the development artifacts related to each vulnerability reported via public issue tracking databases (as specified in Sections 4.2.1 through 4.2.3). Since reported vulnerabilities were all handled slightly differently by each community, we investigated each defect report manually to ensure that the correct post-release patch was made public. For the rare cases in which no connection could be made, we contacted experts of the team to correct the historical records. In all three case studies, we examined releases that were at least three years old to allow time for vulnerabilities to be found, fixed, and documented.
overflows, denial of service (via a variety of means), and information disclosure vulnerabilities.
We gathered the developer activity metrics from version control change logs. We chose the length of our development history based on major changes in the project (e.g. the development since the last major project vision change). Our developer activity metrics applied only to files with development history during the period we studied.
4.2.1 RHEL4 Linux Kernel
We performed a case study on the Linux kernel as it was distributed in the RHEL4 operating system. We collected our security data from the Red Hat Bugzilla database5, the National Vulnerability Database (NVD)6, and the RHSR security metrics database7. Our data set includes 284 vulnerable files traced from vulnerabilities reported between February 2005 and February 2010.
For the version control data from which developer activity metrics were computed, we used the Linux kernel source repository8. The RHEL4 operating system is based on Linux kernel version 2.6.9, so we used all of the version control data from kernel version 2.6.0 to 2.6.9, which was approximately 16 months of development and maintenance. In the Linux kernel study, 21 vulnerable file were not changed in the 16 months prior to release, so developer activity metrics were not applied to those files and they were not included in this study.
5
http://bugzilla.redhat.com 6
http://nvd.nist.gov 7
4.2.2 PHP Programming Language
The PHP project is a programming language for web application development. Vulnerabilities in PHP typically entailed insecure built-in functions provided by the core language. Our study does not include vulnerabilities that could arise from writing vulnerable PHP code.
We collected our PHP security data from the NVD, the PHP Bugzilla database9, and Bugzilla databases of vendors that support the PHP programming language (e.g. Red Hat Bugzilla). We studied version 4.3 of the PHP language released because it was a major release of the language. Our security data ranged from release in September 2004 to February 2010. We used the version control history from 24 months prior to release based on observing a two-year development lifecycle. In the PHP study, only one vulnerable file was not changed in the 24 months prior to release and was not included in this study.
4.2.3 Wireshark Network Protocol Analyzer
The Wireshark network protocol analyzer is a tool that can be used to aggregate and summarize data transported over a network. Formerly known as Ethereal, Wireshark can be deployed on a system to record network traffic, making the system susceptible to exploits if Wireshark contains any vulnerabilities.
We collected our Wireshark security data from the Wireshark security advisories. We studied version 0.99.4 of Wireshark released in September 2006, including all security vulnerabilities found from release to February 2010. We studied the version of Wireshark based on a major release that coincided with increased record-keeping practices in the
project. We used the version control history from 24 months prior to release based on several natural development lifecycles. In the Wireshark study, all of the vulnerable files were changed in the 24 months prior to release.
4.3 Empirical Analysis
Our empirical analysis is a statistical correlation study between developer activity metrics and security vulnerabilities. We focus our empirical analysis on four questions in the following four subsections:
Section 4.3.1: Are developer activity metrics related to vulnerable files?
Section 4.3.2: Can a “critical point” be found in each metric’s range that is linked to an increase the likelihood of having a vulnerable file?
Section 4.3.3: How many of the vulnerable files can be explained by the metrics? Section 4.3.4: Can data from one project be used to predict on another project? Statistically speaking, the first question is an association question, the second is a discriminative power question, and the third and fourth are predictive modeling questions as described by Schneidewind’s metric validation methodology [54]. We used SAS10 v9.1.3 for our statistical analysis and Weka v3.6.0 [69] for the Bayesian network prediction model.
4.3.1 Association: Are The Metrics Correlated With Vulnerable Files?
To examine how each of the four metrics summarized in Table 3 are related to security vulnerabilities, we examine the difference between the vulnerable files and the neutral files in terms of each metric. As suggested in metrics validation studies [54] for not having a
normality assumption, we use the non-parametric Mann-Whitney-Wilcoxon (MWW) test. Three outcomes are possible from this test:
The metric mean is higher for vulnerable files than neutral files; The metric mean is lower for vulnerable files than for neutral files; or
The metric means are not different between neutral and vulnerable files at a statistically significant level (p<0.05).
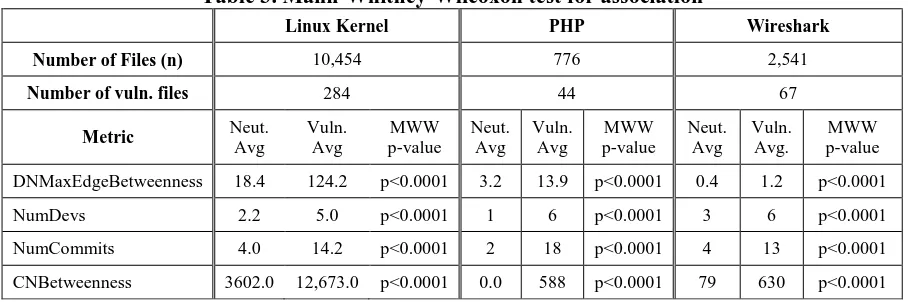
We present the results of our association analysis in Table 3. In all four cases on all three case studies, the metric was higher for vulnerable files than for neutral files at a statistically significant level, providing some mixed results regarding Linus’ Law and unfocused contributions.
Table 3. Mann-Whitney-Wilcoxon test for association
Linux Kernel PHP Wireshark
Number of Files (n) 10,454 776 2,541
Number of vuln. files 284 44 67
Metric Neut.
Avg Vuln. Avg MWW p-value Neut. Avg Vuln. Avg MWW p-value Neut. Avg Vuln. Avg. MWW p-value
DNMaxEdgeBetweenness 18.4 124.2 p<0.0001 3.2 13.9 p<0.0001 0.4 1.2 p<0.0001
NumDevs 2.2 5.0 p<0.0001 1 6 p<0.0001 3 6 p<0.0001
NumCommits 4.0 14.2 p<0.0001 2 18 p<0.0001 4 13 p<0.0001
CNBetweenness 3602.0 12,673.0 p<0.0001 0.0 588 p<0.0001 79 630 p<0.0001
However, the NumDevs metric was higher for vulnerable files, implying that too many developers changing a single file is associated with an increase in likelihood of a vulnerability. This result supports the unfocused contribution aspect of NumDevs rather than the diversity in perspectives. This result may be surprising as it goes against Linus’ Law, indicating that too many eyeballs may be detrimental to the security of the software.
NumCommits was higher for vulnerable files, meaning that vulnerable files were more likely to have underwent many changes. This result supports the “code churn” effect found in other studies [37], [39], [56] where code undergoing a lot of change tends to have more problems.
CNBetweenness was also higher for vulnerable files than for neutral files, meaning that vulnerable files were more likely to have been worked on by many developers who also worked on many other files. This result supports the unfocused contribution view.
4.3.2 Discriminative Power: Are Some Metric Values Better Than Others?
By evaluating the discriminative power of developer activity metrics, we are examining how well each metric can individually differentiate files as vulnerable or neutral. The primary purpose of discriminative power is to see where a metric is “too high” or “too low”. A secondary advantage of discriminative power is to provide a comparison between each metric. Difference in averages (i.e. association) does not show relative correlation strength from one metric to the next11.
11
We use the term critical value of a metric to indicate a specific point that can be used to classify files as either vulnerable or neutral. For example, finding the critical value of NumDevs would answer the question: how many developers is “too many”? The exact critical value of a metric may vary depend on one’s desired precision and recall. As an example of using critical values, consider gathering all files in the Linux kernel by changed nine developers or more (NumDevs >= 9), then 44.4% of those files would be vulnerable, which is considerably high given that only 3% of the system’s files were vulnerable12. Thus, using NumDevs provides 14 times (=44.4/3) more discriminative power than random selection. Furthermore, for files with fewer than nine developers, (NumDevs<9), 2.9% of the files were vulnerable. However, those 44.4% vulnerable files only account for 9.5% (recall) of the known vulnerable files in the system, meaning more metrics with high discriminative power are required.
Table 4 shows some example critical values along with the precision, and recall. In all three case studies, NumDevs, NumCommits, and CNBetweenness all have high precisions when compared to the proportion of vulnerable files of 3%-6% found in Table 2, but the recalls are still low. The result of having all four metrics being correlated (from Section 4.3.1), but having low recalls means, that while the metrics are correlated with vulnerabilities, none of them individually account for all of the vulnerabilities.
Table 4. Discriminative Power results with example critical values
Linux Kernel PHP Wireshark
Metric Example Critical
Value
Precision Recall
Example Critical
Value
Precision Recall
Example Critical
Value
Precision Recall
DNMaxEdge-Betweenness 350.0 20.2% 15.2% 10.0 26.4% 55.8% 2.5 15.6% 7.5%
NumDevs 9 44.4% 9.5% 9 42.3% 26.8% 6 13.7% 37.8%
NumCommits 33 36.0 8.4% 33 47.1% 37.2% 33 14.0% 19.7%
CNBetweenness 28,000 19.0% 11.8% 3,000 77.8% 16.3% 1,750 17.9% 7.5%
Note also that critical values can vary according to the project being studied. For example, the range of CNBetweenness is directly related to the number of developers and number of files in a system, so one critical value on one project may not have the same meaning in another project. Users of developer activity metrics could choose a desired critical value from historical analysis of their own project.
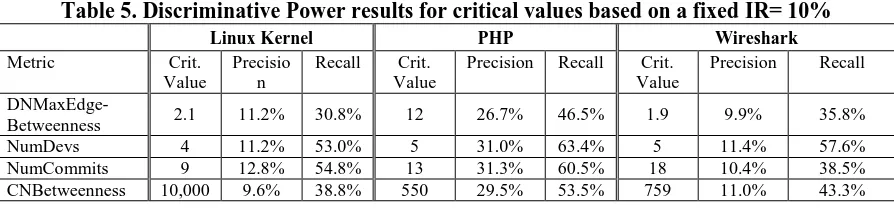
Table 5. Discriminative Power results for critical values based on a fixed IR= 10%
Linux Kernel PHP Wireshark
Metric Crit. Value
Precisio n
Recall Crit. Value
Precision Recall Crit. Value
Precision Recall
DNMaxEdge-Betweenness 2.1 11.2% 30.8% 12 26.7% 46.5% 1.9 9.9% 35.8% NumDevs 4 11.2% 53.0% 5 31.0% 63.4% 5 11.4% 57.6% NumCommits 9 12.8% 54.8% 13 31.3% 60.5% 18 10.4% 38.5% CNBetweenness 10,000 9.6% 38.8% 550 29.5% 53.5% 759 11.0% 43.3%
Our results for fixed inspection rate show that precision and recall vary for each project based on a fixed inspection rate. These results indicate that, while using developer activity metrics helps find vulnerabilities, one cannot expect consistent precisions and recalls from a critical value from a 10% inspection rate.
4.3.3 Predictability: How Many Vulnerable Files Can Be Predicted?
The predictability criterion is used to estimate how many vulnerabilities can be explained by combining all of the metrics into a single predictive model. As a secondary purpose, one can use predictability analysis as a simulation of how well one could have predicted vulnerabilities prior to release. Said another way, if the model can predict vulnerable files, then development teams can use the metrics to find vulnerabilities prior to release, and prioritize inspection and fortification efforts accordingly.
A key element of prediction is the supervised model. A supervised model is a method of combining multiple metrics into a single binary classification prediction (“neutral” or “vulnerable”)[69]. We used Bayesian networks as our supervised predictive model.
validation is performed by randomly partitioning the data into 10 folds, with each fold being the held-out test fold exactly once. The precision, recall, and inspection rate of the models can be found in Table 6.
Table 6. Bayesian Network prediction, 10x10 cross-validation.
Linux Kernel PHP Wireshark Avg
Precision 15.1% 29.3% 12.0% 18.8%
Recall 31.6% 55.8% 32.8% 40.1%
F2 25.9% 47.3% 24.4% 32.5%
Inspection Rate 5.3% 10.6% 7.2% 7.7%
For the F-measure in our predictive analysis, we set our weight to two, meaning that we care twice as much about recall than precision. We reason that, in security prediction, allowing a vulnerable file escape to the field is worse than wasting effort on inspecting a file with no vulnerabilities.
Our results show a notably higher recall than with the individual metrics at critical points. However, the precision is lower to achieve this higher recall. One note of interest here is the low inspection rate across all three projects. If a team wanted to inspect files using the Bayesian network model on the Linux kernel, then they would only need to inspect 5.3% of the files and would find 31.6% of the vulnerable files.
In terms of general prediction models, other models outperform ours [15]. However, that developer activity metrics alone can predict a large percentage of vulnerable files (40.1% on average) is a useful result in terms of developer activity.
4.3.4 Cross-Project Analysis: Can Predictive Models be Transferred?
One of the drawbacks of using a predictive model in practice is that a model requires a set of examples (i.e. training data) to work form. Without training data, a predictive model could not be used on the first release of a product. However, since our three case studies show that developer activity metrics are consistently associated with security vulnerabilities, perhaps a general predictive model can be made.
In this analysis, we perform our prediction analysis with three-fold cross validation. Instead of the folds being randomly assigned, each fold is the full set of data set from a given project.
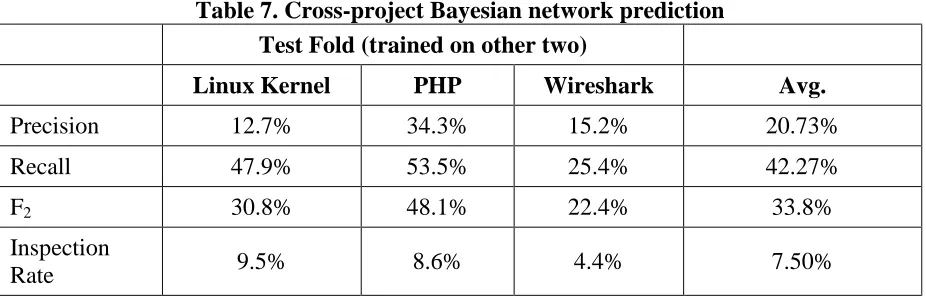
Table 7. Cross-project Bayesian network prediction Test Fold (trained on other two)
Linux Kernel PHP Wireshark Avg.
Precision 12.7% 34.3% 15.2% 20.73%
Recall 47.9% 53.5% 25.4% 42.27%
F2 30.8% 48.1% 22.4% 33.8%
Inspection
Rate 9.5% 8.6% 4.4% 7.50%
The results of cross-project analysis show that, on average, both precision and recall increased when the model was trained on other projects. Even on an individual comparison, recalls in particular increased substantially in the cases of PHP and Wireshark. The largest decrease in performance was the Linux kernel, which decreased precision and inflated the inspection rate to achieve a higher recall.
These results are particularly surprising given the diverse set of projects we chose. The Linux kernel had 557 developers and Wireshark only had 19 (from Table 2), so the developer communities are quite different. Despite this difference, a model could be trained these projects and used on another. From a prediction standpoint, this result indicates that vulnerability prediction is possible for a new development project with no history of documented vulnerabilities.
4.4 Limitations of Security Correlation Study
three case studies, the RHEL4 kernel has 21 vulnerable files not changed prior to release, whereas PHP had one, and Wireshark had none. In such cases, those vulnerable files could not be used in our models and analysis.
All three of our case studies are in the C programming language, so our results should only be generalized to software developed in C.
Furthermore, since our data only includes known vulnerabilities, we cannot make any claims about latent, undiscovered vulnerabilities. As a result of the latent, undiscovered vulnerabilities, we cannot say that a low precision (i.e. a high occurrence of false positives) is actually indicative of real false positives, or that our model is finding more vulnerabilities in the system that have not yet been confirmed.
Lastly, security experts [28] claim that half of all security vulnerabilities are code-level and the other half are design-level. Our data sets are primarily a recording of code-level vulnerabilities from post-release maintenance. Thus, our results only apply to code-level vulnerabilities.
4.5 Contributions of Security Correlation Study
The objective of this research is to reduce security vulnerabilities by providing actionable insight into the structural nature of developer collaboration in open source software. In three case studies, we analyzed four metrics related to Linus’ Law and unfocused contributions. An empirical analysis of our data demonstrates the following observations:
Files are likely to be vulnerable when changed by many developers who have made many changes to other files; and
A Bayesian network predictive model can be used on one project by training it on other projects, possibly indicating the existence of a general predictive model.
5
Perception Corroboration Study
Over the last several years, social network analysis (SNA) has emerged as a popular method for studying the collaboration and organization of large software development teams. Researchers have been modeling networks of developers based on socio-technical connections found in software development artifacts. Most SNA studies apply graph theory to socio-technical networks of developers (often called developer networks) to generate SNA metrics. Connections between developers in socio-technical networks often originate from software development artifacts, such as version control change logs. Recent empirical case studies of several well-known software products have shown that SNA metrics are predictive of faults [40], [47], failures [37], [70], and vulnerabilities [32], [33]. Furthermore, researchers are developing visual tools [3], [53] and techniques [6] to aid practitioners in viewing, analyzing, and organizing software development teams via developer networks.
While development artifacts can provide a historical view of the development project, the developers themselves can provide another valuable perspective. Developer perceptions could support that the connections observed in the development artifacts represent actual socio-technical relationships. A study of the comparison between developer perceptions and the artifact-based developer network would help researchers and practitioners draw sound conclusions when analyzing a complex ecosystem of developers.
Therefore, the objective of this research is to investigate if social network analysis metrics represent socio-technical relationships by examining if developer networks can be corroborated with developer perceptions. To measure developer perceptions, we developed an online survey that is personalized to each developer of a development team [35]. The personalization is based on the SNA metrics taken from version control change logs of the developer’s project. Developers answered questions about other members of the team, such as identifying collaborators and the project’s experts.
A total of 124 developers responded from three open source projects: the Linux kernel, the PHP programming language, and the Wireshark network protocol analyzer. In this study, we provide an empirical analysis of those responses and their relation to the developer network and its derived SNA metrics.
Q1: Developer network edges. If two developers work on the same source code file in the same month, then do they perceive they are collaborating?
Q2: Developer network distance. Does the distance between two developers in the developer network represent the perceived degree of separation between those two developers?
Q3: Developer network centrality. Does having a high centrality in the developer network indicate being reputed as a project expert by other developers?
5.1 Developer Network Used in Perception Corroboration Study
To define our developer network, we are looking for records of social or technical connections in the context of the project. We use the logs from the version control system to determine such connections. Our motivation is that if a developer knows enough about the code to enact a change, then two developers changing the same code means a socio-technical relationship (e.g. shared knowledge of that code) likely exists.
(representing distance) would be 990. In this study, we evaluate both weighted and unweighted edges separately.
5.2 Research Methodology
In this section, we discuss our online survey and the steps we took to conduct this study.
5.2.1 Online Survey
Our online survey consisted of six questions posed to the developers. The entire survey can be found in Appendix A.
For each question, the respondents were given the opportunity to provide feedback on the questions itself. On some of the questions, the developers clarified how they interpreted the question (e.g. the meaning of “work with” described in Question 2). We found that some questions were often interpreted differently among the developers. Based on that feedback, we only analyze three of the six questions in the survey.
Our online survey is personalized for each developer of a given project. The possible answers for each developer is slightly different based on the SNA metrics of the respondent.
Figure 2. Screenshot of the respondent verifying his or her identity in the survey.
After verifying his or her identity, each respondent answered a series of questions. The specific questions used in this analysis are discussed further in Section 5.4.
Our survey system was developed in Java, JSP, and JavaScript, running in Tomcat 5.5, MySQL 5, on a server running Red Hat Enterprise Linux 5.
5.2.2 Conducting the Study
We executed the following steps to perform the study.
Step 1: Obtain version control data. For each of the case studies, we obtained the