© 2017, IRJET | Impact Factor value: 5.181 | ISO 9001:2008 Certified Journal | Page 809
Feature Subset Selection for High Dimensional Data Using Clustering
Techniques
Nilam Prakash Sonawale
1, Prof. B. W. Balkhande
21
Student of M.E. Computer Engineering, Bharati Vidyapeeth College of Engineering, Mumbai University,
Navi Mumbai , Maharashtra, India.
2
Assistant Professor, Dept. of Computer Engineering, Bharati Vidyapeeth College of Engineering, Mumbai
University, Navi Mumbai, Maharashtra, India
---***---Abstract -
Data mining is the process of analyzing the data
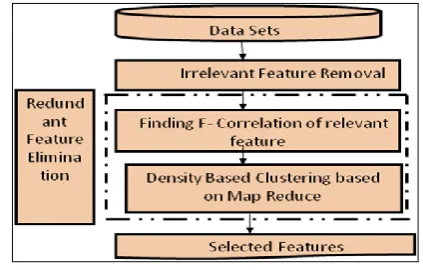
from different perspective and summarizing it into useful information (Information that can be used to increase revenue, cuts costs or both). Database contains large volume of attributes or dimensions which are further classified as low dimension data and high dimension data. When dimensionality increases, data in the irrelevant dimension may produce noise, to deal with this problem it is essential to have a feature selection mechanism that can find a subset of features that meets requirement and accomplish high relevance. The proposed algorithm FAST is evaluated in this project. Our proposed FAST algorithm has three steps: (1) Irrelevant features are removed (2) Features are divided in to clusters, (3) Selecting the most representative feature from cluster [8]. FAST algorithm can be performed by DBSCAN (Density-Based Spatial Clustering with Noise) algorithm that can be worked in the distributed environment using the Map Reduce and Hadoop. Small number of discriminative features will be the final result.
Key Words:
Data Mining, Feature subset selection,
FAST, DBSCAN, SU, Eps, MinPts
1. INTRODUCTION
Data mining is an associative subfield of computer science; In large data sets process of identifying patterns through computational process involving methods at the intersection of artificial intelligence, machine learning, statistics and database system [4]. Too abstract information from a dataset and transform it into an understandable structure for further use is the overall goals of data mining process. Explaining the past through data exploration and predicting the future by means of data analysis (Modelling) involved in Data mining. Data mining is a multi-disciplinary field which combines statistics, machine learning, artificial intelligence and database technology. The value of data mining applications is often estimated to be very high. Over years of operation large amounts of data stored by many businesses, and data mining is able to extract very profitable knowledge from this data. The businesses are then able to advantages the extracted knowledge into more clients, more sales, and greater profits. In the engineering and medical fields the same is applicable.
Statistics: The science of collecting, classifying, summarizing, organizing, analyzing, and interpreting data. Artificial Intelligence: Dealing with the simulation of intelligent behaviors in order to perform activities that are normally thought to require intelligence by study of computer algorithms.
Machine Learning: The study of computer algorithms to learn in order to improve automatically through experience.
Database:The science and technology of collecting, storing and managing data so users can retrieve, add, update or remove such data.
Data Warehousing: The science and technology of collecting, storing and managing data with advanced multi-dimensional reporting services in support of the decision making processes.
1.1 Modeling:
A model is created to forecast an result isthe process of predictive modeling. If categorical result then it is called classification and if numerical result is then it is called regression. Assignment of observations into clusters so that observations in the same cluster are similar is the clustering or descriptive modeling. An Association rules can find attractive associations amongst considerations.
1.2 Clustering:
A cluster is a subset of data which aresimilar. Dividing a dataset into groups such that the members of each group are as similar (close) as possible to one another, and different groups are as dissimilar (far) as possible from one another is the process of Clustering (also called unsupervised learning). Clustering can uncover previously undetected relationships in a dataset. There are many applications for cluster analysis. Clustering can be used in business, to discover and characterize customer segments for marketing purposes and in biology cluster analysis can be used; for classification of plants and animals given their features cluster analysis can be used.
Main groups of clustering algorithms are: 1. Hierarchical
o Agglomerative o Divisive 2. Partitive
o K Means
© 2017, IRJET | Impact Factor value: 5.181 | ISO 9001:2008 Certified Journal | Page 810 3. Density Based Method
4. Grid Based Method 5. Model Based Method 6. Constraint Based Method
A good clustering method requirement is:
(I) Capacity to discover some or all of the hidden clusters
(II) Within-cluster similarity and between-cluster dissimilarity
(III) Capacity to deal with various types of attributes
(IV) Deal with noise and outliers
(V) Can handle high dimensionality
(VI) Scalable, Interpretable and usable
1.3 DBSCAN:
DBSCAN (Density-Based spatial cluster of Applications with Noise) may be a density primarily based cluster rule which can generate any variety of clusters, and additionally for the distribution of spatial information [1].To convert great amount of data into separate clusters in order to better and faster access is the main purpose of cluster rule. The rule grows regions with sufficiently high density into clusters and discovers clusters of arbitrary form in spatial databases with noise. It defines a cluster as a highest set of density-connected points. Set of density-density-connected objects that's highest with respect to density-reach ability may be a density-based cluster. As every object not contained in any cluster for considering the noise. DBSCAN method is sensitive to its parameter e and Min Pts, and leaves the user with the responsibility of selecting parameter values that will cause the discovery of acceptable clusters. The machine complexness of DBSCAN is O(nlogn) if a spatial index is employed, wherever n is the range of info objects. Otherwise, it's O(n2).
In advance DBSCAN doesn't need to know the amount of categories to be fashioned. DBSCAN can't solely notice freeform category, however additionally to spot the noise points. a collection contains the most range of knowledge objects that density property in DBSCAN rule is defined as category [1]. For all of the unmarked objects in information set D, select object P and marked P as visited. Region question for P to determine whether or not it's a core object. If P isn't a core object, then mark it as noise and re-select another object that's not marked. If P may be a core object, then establish category C for the core object P and generals the objects at intervals P as seed objects to region query to increasing { the category} C till no new object be part of class C, cluster method over. that's once the amount of objects
within the given radius (ε) region not but the density threshold (MinPts), then cluster. Thanks to taking the density distribution of knowledge object into account, therefore it will mining for freeform datasets.
2. LITERATURE SURVEY
A feature selection algorithmic can be seen as the combination of a search technique for proposing new feature subsets, at the side of associate analysis live that scores the various feature subsets. The only algorithmic program is to check every possible set of features finding the one that minimizes the error rate. This can be associate exhaustive search of the space, and is computationally intractable for all but the smallest of feature sets. The selection of evaluation metric heavily influences the algorithmic program, and it's these analysis metrics that distinguish between the 3 main categories of feature selection algorithms: wrappers, filters and embedded methods.
2.1 Wrapper methods:
Use a predictive model to record feature subsets. Every new set is used to track a model that is approved on a hold-out set. Calculating the amount of fault created on it hold-out set (the error rate of the model) give the score for that set [3]. As wrapper methods train a brand new model for every subset, they're very computationally
[image:2.595.310.567.476.601.2]comprehensive, but consistently give the performing feature set for that specific sort of model.
Figure 1: Wrapper Method
2.2 Filter methods:
© 2017, IRJET | Impact Factor value: 5.181 | ISO 9001:2008 Certified Journal | Page 811 This lack of tuning means a feature set from a filter is more
[image:3.595.44.284.229.350.2]general than the set from a wrapper, usually giving small prediction performance than a wrapper. However the feature set doesn't contain the assumptions of a prediction model, and hence is more useful for exposing the relationships between the features. Many filters provide a feature ranking rather than an explicit best feature subset, and the cutoff point in the ranking is chosen via cross-validation. This method has also been used as a pre-processing step for wrapper methods, allowing a wrapper to be used on big problems.
Figure 2: Filter Method
2.3 Embedded methods:
A catch-all group of techniques which implement feature selection as part of the model construction process. The exemplar of this path is the LASSO method for designing a linear model, which penalizes the regression coefficients with an L1 penalty; compress many of them to zero. Any features which have non-zero regression coefficients are 'selected' by the LASSO algorithm. Improvements to the LASSO include Bolasso which bootstraps samples, and FeaLect which scores all the features based on combinatorial analysis of regression coefficients. One other popular path is the Recursive Feature Elimination algorithm, commonly used with Support Vector Machines to repeatedly construct a model and remove features with minimum weights. These approaches tend to be between filters and wrappers in terms of computational diversity.
Stepwise regression is the most preferred form of feature selection in statistics, which is a wrapper technique. It is a greedy algorithm that appends the best feature (or deletes the worst feature) at each round. To determine when to stop the algorithm is the main control issue. In machine learning, this is typically done by cross-validation. In statistics, some standards are optimized. This leads to the inherent problem of nesting.
Figure 3: Embedded Method
3. PROBLEM STATEMENT
Feature selection is a task of crucial importance for the application of machine learning in various domains. With respect to efficiency and effectiveness many existent feature selection ways poses a severe challenge due to increase of data dimensionality.
Above all methods are impressive search algorithm that contributes itself directly to feature selection; however this direct application is slow down by the recent increase of data dimensionality. Therefore accommodate new algorithm to manage with the high dimensionality of the data becomes increasingly demanding.
Given a set of d-dimensional points DB = {p1, p2, ..., pn}, a minimal density of clusters de- fined by Eps and MinPts, and a set of computer CP = {C1, C2, ..., Cn} managed by Map-Reduce platform; find the density-based clusters with respect to the given Eps and MinPts values.
4. PROPOSED SYSTEM
Feature set choice is consider because the method of characteristic and removing as several irrelevant and redundant options as doable. this is often as a result of extraneous options don’t contribute to the prognosticative accuracy and redundant options don’t redound to obtaining a stronger predictor for that they supply largely data that is already gift in different feature(s). Of the numerous feature set choice algorithms, some will effectively remove extraneous options however fail to handle redundant options however a number of others will remove the extraneous whereas taking care of the redundant options [3]. The proposed FAST algorithm false under the Filter method. The filter method in addition to the generality is excellent when the numbers of features are very large. Feature selection is the process of analyzing and removing as many as relevant and redundant feature as many as possible. Unrelated features do not donate to the predictive accuracy and excessive feature provides information which is already present in other feature.
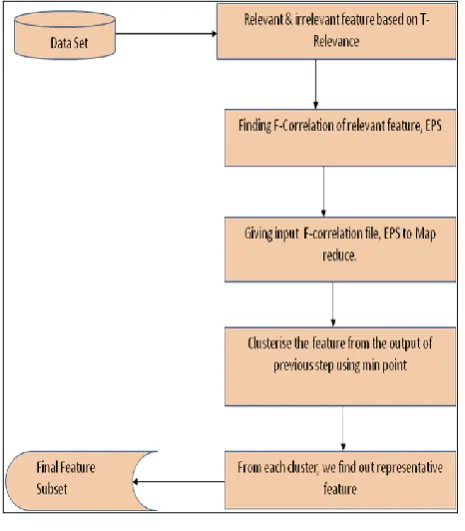
[image:3.595.326.538.583.718.2]© 2017, IRJET | Impact Factor value: 5.181 | ISO 9001:2008 Certified Journal | Page 812 Figure 5: DBSCAN Flowchart based on Map Reduce
Figure 6: Flow Diagram
Decision Tree: Classification or regression builds by decision tree in the form of tree structure.
It breaks down a dataset into smaller and smaller subsets while at the same time an associated decision tree is incrementally developed. Tree with decision nodes and leaf nodes is the final result. A decision node has two or more branches. classification or decision represented by leaf node. root node is the topmost decision node in a tree which corresponds to the best predictor . both categorical and numerical data can handle by decision trees.
Algorithm: The core algorithm for building decision trees called ID3 which make use of a top-down, excessive search through the space of available branches with no backtracking. ID3 uses Entropy and Information Gain to build a decision tree.
Entropy: A decision tree is built top-down from a root node and involves dividing the data into subsets that contain instances with identical values (homogenous). To determine the homogeneity of a sample algorithm ID3 is used. Entropy is zero if the sample is completely homogeneous and the entropy is one if sample is an equally divided.
Figure 7: Entropy
We need to determine two types of entropy using frequency tables to build a decision tree as follows:
a) Entropy using the frequency table of one attributes: c
E (S) = ∑ - рi log2 pi i=1
b) Entropy using the frequency table of two attributes: E (T, X) = ∑ P(c)E(c)
C € X
Symmetric Uncertainty: For measuring correlation between either two features or a feature and the target concept we choose symmetric uncertainty.
SU (X, Y) =2 * Gain( X | Y) / H (X) + H (Y) Where,
1. H (X) = Entropy of a discrete random variable X. Suppose p(x) is the prior probabilities for all values of X, H (X) is defined by
H(X)= - ∑ p(x) log2 p(x) x£X
2. Gain (X|Y) = amount by which the entropy of Y decreases. It reflects the additional information about Y provided by X and is called information gain.
Gain (X|Y) = H(X) – H (X|Y) = H(Y) – H (Y|X)
[image:4.595.46.279.267.533.2]© 2017, IRJET | Impact Factor value: 5.181 | ISO 9001:2008 Certified Journal | Page 813 H(X|Y)=-∑p(y)∑p(x|y)log2 p(x|y)
y£Y x£X
Information gain is a symmetrical measure. That is the amount of information gained about X after observing Y is equal to the amount of information gain about Y after observing X. This ensures that the order of two variables will not affect the value of the measure.
T-Relevance: T-relevance of Fi and C denoted by SU (Fi, C) is the relevance between the feature Fi £ F and the target concept C
We say Fi is a strong T-relevance feature when SU (Fi, C) is greater than a predetermined threshold Ø.
F-Correlation: F-correlation of Fi and Fj denoted by SU(Fi,Fj) is the correlation between any pair of features Fi and Fj. (Fi,Fj £ F∧ i≠j)
Hadoop: Using the MapReduce algorithm Hadoop runs the applications, where the data is processed in parallel on different CPU nodes. In short, Hadoop framework is capable enough to develop applications capable of running on clusters of computers and they could perform complete statistical analysis for huge amounts of data. A Hadoop frame-worked application works in an environment that provides distributed storage and computation across clusters of computers. Hadoop is designed to scale up from single server to thousands of machines, each offering local computation and storage. The term MapReduce actually refers to the following two different tasks that Hadoop perform:
The Map Task: This is the begining task, which takes input data and converts it into a set of data, where distinctive elements are broken down into tuples (key/value pairs)
The Reduce Task: This task takes the output from a map task as input and combines those data tuples into a smaller set of tuples. The reduce task is always performed after the map task.
5. FAST ALGORITHM
Inputs: D(F1, F2, ..., FM, C) - the given data set
𝜃 - the T-Relevance threshold, radius Eps, density threshold
MinPts , Output:class C output: S - selected feature subset
//==== Part 1 : Irrelevant Feature Removal ==== 1 for i = 1 to m do
2 T-Relevance = SU (Fi, C) 3 if T-Relevance > 𝜃 then 4 S = S ∪ {Fi };
//==== Part 2 : Density Based Clustering ==== 5 G = NULL; //G is a complete graph
6 for each pair of features {𝐹 ′𝑖, 𝐹′𝑗} ⊂ S do 7 F-Correlation = SU (𝐹′𝑖, 𝐹′𝑗)
8 𝐴𝑑𝑑𝐹′𝑖𝑎𝑛𝑑𝑜𝑟𝐹′𝑗𝑡𝑜𝐺𝑤𝑖𝑡 F-Correlation 𝑎𝑠𝑡𝑒 𝑤𝑒𝑖𝑔𝑡𝑜𝑓 𝑡𝑒𝑐𝑜𝑟𝑟𝑒𝑠𝑝𝑜𝑛𝑑𝑖𝑛𝑔𝑒𝑑𝑔𝑒;
//== Part 3: Representative Feature Selection ==== 9 DBSCAN(D, Eps, MinPts)
10 Begin
11 init C=0;// The number of classes is initialized to 0 12 for each unvisited point p in D
13 mark p as visited; //marked P as accessed 14 N = getNeighbours (p, Eps);
15 if sizeOf(N) < MinPts then
16 mark p as Noise; //if sizeOf(N) < MinPts,then mark P as noise
17 else
18 C= next cluster; //create a new class C
19 ExpandCluster (p, N, C, Eps, MinPts);//expand class C
20 end if 21 end for 22 End
23 for each cluster
24 add feature with max T-relevance to final subset 25 end for
26 Hadoop : (MapReduce)
Mapper: Identity Function for Value (k, v) (v, _)
Reducer: Identity Function (k’, _) (k’, “”)
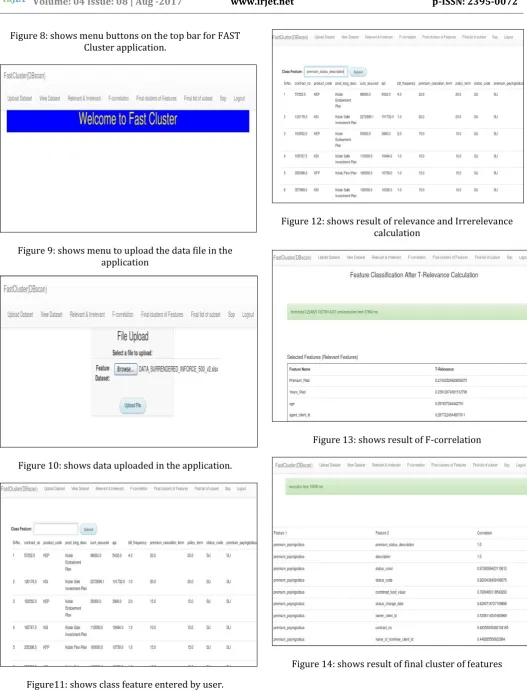
6. SIMULATION RESULT
© 2017, IRJET | Impact Factor value: 5.181 | ISO 9001:2008 Certified Journal | Page 814 Figure 8: shows menu buttons on the top bar for FAST
Cluster application.
Figure 9: shows menu to upload the data file in the application
Figure 10: shows data uploaded in the application.
Figure11: shows class feature entered by user.
Figure 12: shows result of relevance and Irrerelevance calculation
[image:6.595.36.564.60.752.2]Figure 13: shows result of F-correlation
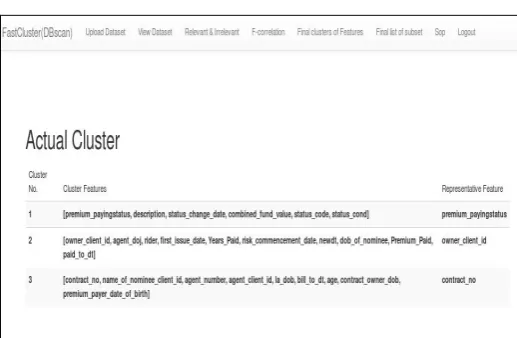
© 2017, IRJET | Impact Factor value: 5.181 | ISO 9001:2008 Certified Journal | Page 815 Figure 15: shows final list of subset
7. CONCLUSIONS
Dealing with large datasets DBSCAN algorithm based on MapReduce faces scalability problems. Large datasets are cut into small set of data and it processes the small set of data parallel. Experimental results shows that DBSCAN algorithm based on the MapReduce alleviated the problem of time delay caused by large datasets and have good timeliness.
REFERENCES
[1].MR-IDBSCAN: Efficient Parallel Incremental DBSCAN Algorithm using MapReduce by Maitry Noticewala CSE department Parul Institute of Technology 29, Gopaleshvar Soc. Tadwadi Rander Road, Surat-395009 and Dinesh Vaghela CSE department Parul Institute of Technology Limda, Vadodara, India
[2]. Research of parallel DBSCAN clustering algorithm based on MapReduce by Xiufen Fu, Shanshan Hu and Yaguang Wang School of Computer, Guangdong University of Technology, 510006, P.R.China xffu@gdut,edu.cn, [email protected]
[3]. Filter versus Wrapper Feature Subset Selection in Large Dimensionality Micro array: A Review, Binita Kumari,Tripti Swarnkar . Department of Computer
Science - Department of Computer Applications, ITER, SOA University Orissa, INDIA
[4].Data Mining Cluster Analysis
http://www.tutorialspoint.com/data_mining/dm_cluste r_analysis.html, Copyright © tutorialspoint.com
[5]. Wikipedia on clusters
[6]. A Dynamic Feature Selection Method For Document Ranking with Relevance Feedback Approach, K.Latha, B.Bhargavi, C.Dharani and R.Rajaram Department of Computer Science and Engineering, Anna University of Technology, Tiruchirappalli, Tamil Nadu, India. E-mail: [email protected] Department of Information Technology, Thiagarajar College of Engineering, Madurai, Tamil Nadu, India E-mail: [email protected]
[7].Bayes Classifier for Different Data Clustering-Based Extra Selection Methods, Abhinav. Kunja, Ch.Heyma Raju Dept. of Computer Science and Engineering, Gitam University Visakhapatnam, AP, India
[8].An Evaluation on Feature Selection for Text Clustering, Tao Liu Department of Information Science, Nankai University, Tianjin 300071, P. R. China. Shengping Liu Department of Information Science, Peking University, Beijing 100871, P. R. China. Zheng Chen, Wei-Ying Ma Microsoft Research Asia, 49 Zhichun Road, Beijing 100080, P. R. China
BIOGRAPHIES
Nilam Prakash Sonawale is Student of M.E. Computer Engineering, Bharati Vidyapeeth College of Engineering, Mumbai University, Navi Mumbai, Maharashtra, India. Senior Consultant at Capgemini Pvt. Ltd.,
Her area of interest is Data Warehousing and Data Mining.