Handwritten Text Recognition and
Digitization System
Aisha Sharaf1, Bhagya Viswanath2, Kavya Chandran3, Nishana Salim4, Anju S Oommen5
U.G. Student, Department of Computer Science and Engineering, St Thomas College of Engineering& Technology, Kozhuvalloor, Kerala, India1
U.G. Student, Department of Computer Science and Engineering, St Thomas College of Engineering & Technology, Kozhuvalloor, Kerala, India2
U.G. Student, Department of Computer Science and Engineering, St Thomas College of Engineering & Technology, Kozhuvalloor, Kerala, India3
U.G. Student, Department of Computer Science and Engineering, St Thomas College of Engineering & Technology, Kozhuvalloor, Kerala, India4
Assistant Professor, Department of Computer Science and Engineering, St Thomas College of Engineering & Technology, Kozhuvalloor, Kerala, India5
ABSTRACT: The aim of the project is to improve existing handwritten character recognition problem using machine
learning. Here it provides a solution for handwritten recognition from handwritten text file. The recognition model chosen here is convolutional neural network which is capable of handling complicated data. The data set containing handwritten alphabetical characters and digits are used for testing. By using more sample datas the accuracy can be improved. In a regular neural network, the input is transformed through a series of hidden layers having multiple neurons. Each neuron is connected to all the neurons in the previous and the following layers. This arrangement is called a fully connected layer and the last layer is the output layer. In Computer Vision applications where the input is an image, use convolutional neural network because the regular fully connected neural networks don’t work well. This is because if each pixel of the image is an input then by adding more layers the number of parameters increases exponentially. Here convolutional neural network is used. It is more accurate than any other neural networks.
KEYWORDS: Text detection, Convolutional Neural network, Morphological operations, Machine learning.
I. INTRODUCTION
share, and analyse their records, whereas still permitting them to use their most popular writing technique. The aim of this project is to any explore the task of classifying written text and to convert written text into the digital format.
In recent years, there has been a lot of interest in automatic character recognition. Between written and written forms, written character recognition is additional difficult. written characters written by completely different persons isn't identical however varies in each size and form. varied variations in writing designs of individual character build the popularity task tough. The similarities in distinct character shapes, the overlaps, and also the interconnections of the neighbour characters any complicate the matter. A written character recognition system consists of 2 major steps: feature extraction from the character set and then use learning tool to classify individual character. With distinct feature extraction techniques, variety of ways primarily based on artificial neural network square measure investigated for written English character recognition
Paper is organized as follows. Section II describes the related works that is the design of the handwritten text recognition system. The flow diagram represents the step of the design. Section III describes the creation of data and label. It includes the morphological operations, grayscale conversion, image thresholding and extraction of ROI from image. Section IV describes the creation of model, it includesthe layers in convolutional neural network, feature extraction and classification. Section V describes the implementation and result. Finally, Section VI presents conclusion.
II. PROPOSED SYSTEM
Handwritten text recognition and digitization system using neural networks was implemented here. This system consists of four phases. The first phase is creation of model, here sequential model is used it allows to build a model layer by layer. The layers used here are Conv2D, Max pooling, Batch normalization. RELU is the activation function used here. Features are the measurable properties in the observation where one can analyse or classify the instances of data. Feature extraction is used to choose the important features which are independent of others. Classification is the process of assigning labels to unseen observation. Here fully connected layers are used for classification. The second phase is creation of data &label. The third phase is training and the forth phase is testing.
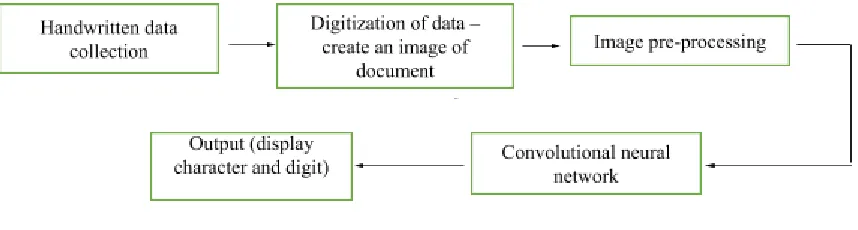
To design a handwritten character recognition system, following steps are to be performed. They are: 1. Collect handwritten data sample: Data samples must collect of different handwritings.
2. Digitization of data: Here each data sample is scanned and an image file is created and the samples are stored in it.
3.Image pre-processing: Here the morphological operations are performed and the noise are removed. 4.Feature Extraction: Structural and statistical features are extracted.
5.Classification: Identify each character using convolutional neural network and display the output.
Fig 1: System Design
III.CREATION OF DATA AND LABEL
provides standard image processing functions like filtering. Matplotlib is python 2D plotting function. We can access the set of files which is defined in a particular pattern using python OS package that provides miscellaneous operating system interfaces. Read and display image using OpenCV. It is the most comprehensive open source library for videos and image processing. Here each character is stored in a folder and by using for loop each character is fetched from the folder and read. Then it is converted into numparray and then corresponding list is generated. Then length of each image in folder is calculated and by using this length data is labelled. For building an effective neural network model, it requires careful consideration of the network architecture as well as the input data format. Training a convolutional neural network on raw images will probably lead to bad classification performances. The pre-processing is also important to speed up training. The aim of image processing is to improve the image data (features) by suppressing unwanted distortions and enhancement of some important image features so that our models can benefit from this improved data to work on. An image is nothing more than a two-dimensional array of numbers (or pixels) ranging between 0 and 255.The most common image data input parameters are the number of images, image height, image width, number of channels, and the number of levels per pixel. Generally, there are 3 channels of data corresponding to the color Red, Green, Blue (RGB) Pixel levels are usually [0,255]. There are number of image pre-processing steps should be done for data set as well as on the input image that we fed into the model. The following pre-processing technique are applied in our input data.
Convert to grayscale
Grayscale conversion is used to extract the features in an RGB image. there are two methods to convert RGB image into a grayscale image. The methods are:
Average method
Weighted method or luminosity method
Average method
It is the simplest one to convert the image into grayscale, take the average of three color. Since it is an RGB image, so it means that add r with g with b and then divide it by 3 to get the desired grayscale image.
Grayscale =(R+G+B)/3 Here average method is used for grayscale conversion.
Image Thresholding
Image Thresholding is a type of image segmentation where it changes the pixels of an image to make the image easier to analyse. In thresholding, it converts an image from color or grayscale into a binary image i.e. black and white image. The advantage of obtaining binary image is that it reduces the complexity of the data and simplifies the process of recognition and classification. It is useful in discriminating foreground from the background. Thresholding is a way to select areas of interest of an image, while ignoring the parts we are not concerned with. Otsu thresholding can be applied for image segmentation and image binarization.
Morphological TransformationMorphological transformations are a simple operation based on the image shape. It is normally performed onbinary images. It needs two inputs; one is our original image and the second input is called structuring element or kernel which decides the nature of operation. Morphological operations apply a structuring element to an input image, creating an output image of the same size.
Two basic morphological operators are:
1.Erosion 2. Dilation.
The morphological transformation that we applied on our input is dilation. 1. Dilation
ret, thresh = cv2.threshold(gray, 0, 255, cv2.THRESH_OTSU)
Here, a pixel element is '1' if at least one pixel under the kernel is '1'. So, it increases the white region in the image and thus the size of foreground object increases. Normally, in case of noise removal, erosion is followed by dilation. Because, erosion removes white noises, but it also shrinks our object. So, we dilate it. Since noise is gone, they won't come back, but our object area increases. It is also useful in joining broken parts of an object.
Contours
Contour is a curve joining all the continuous points (along the boundary), having same color or intensity. It is a useful tool for shape analysis and object detection and recognition. For better accuracy, use binary images. Thus, before finding contours, apply threshold or canny edge detection. The find Contours () function modifies the source image. If the source image is needed even after finding contours, already store it to some other variables. In OpenCV, finding contours is similar to finding white object from black background. So, object to be found should be white and background should be black. To find the contour of a binary image:
There are three arguments in cv2.findContours()function, first one is source image, second argument is contour retrieval mode, and the third is contour approximation method, and it outputs the contours and hierarchy. Contours is a Python list of all the contours in the image. Each individual contour is a Numpy array of (x, y) coordinates of boundary points of the object. The contour approximation method that we use here is cv2.CHAIN_APPROX_SIMPLE.It removes all redundant points and compresses the contour, thereby saving memory. One of the contour feature called bounding rectangle is used and It is found by the function cv2.boundingRect().Let (x,y) be the top-left coordinate of the rectangle and (w,h) be its width and height.
Extraction of ROI from input image
A region of interest (ROI) is a portion of an image that we want to filter or perform some other operation on. We can define ROI by creating a binary mask, which is a binary image that is the same size as the image that we want to process with pixels that define the ROI set to 1 and all other pixels set to 0. Many common image operations are performed using Region of Interest in OpenCV. A ROI allows us to operate on a rectangular subset of the image. The typical series of steps to use ROI is: create a ROI on the image, perform the operation that we want on this subregion of the image, reset back the ROI.
IV. CREATION OF MODEL
The model type using here is Sequential model API. Sequential is the easiest way to build a model in Keras. It allows to build a model layer by layer. The ‘add ()’ function is used to add layers to this model. The layers in this model are core layers and some other layer including convolution layer, pooling layer and fully connected layers. The most crucial component in this model is the convolution layer It aims to reducing the size of the image for faster computation of the weights and improve its generalization. During the convolution part, the network keeps the essential feature of the input image and exclude the irrelevant noise. For instance, the model is learning how to recognize the characters from an input image. For traditional neural network, the model will assign a weight to all the pixels, including the backgrounds which is not essential and can mislead the network. Instead, a convolutional neural network will use a mathematical technique to extract only the most relevant pixels. This mathematical operation is called convolution. This technique allows the
ctrs, hier = cv2.findContours(thresh. copy (), cv2.RETR_LIST, cv2.CHAIN_APPROX_SIMPLE)
x, y, w, h = cv2.boundingRect(ctr)
rect = cv2.rectangle(img, (x, y), (x + w, y + h), (0, 255, 0), 2)
network to learn increasingly complex features at each layer. The convolution divides the matrix into small pieces to learn to most essential elements within each piece. These layers perform feature extraction and classification operations on our data.
Feature Extraction
Features of input data are the measurable properties of observations, which one uses to analyse or classify these instances of data. The task of feature extraction is to choose relevant features that discriminate the instances well and are independent of each other.
Conv2D
The convolution operation extracts different features of the input data set and it use filters to extract the features of an image. Convolution is basically filtering the image with a smaller pixel filter to decrease the size of the image without losing the relationship between pixels. The first convolution layer extracts low-level features like edges, lines, and corners. Higher-level layers extract higher-level features. Activation function is used for the layers. The activation function used for the first three layers is the ReLU, or Rectified Linear Activation. This activation function has been proven to work well in neural networks. A ReLU implements the function y = max (x, 0), so the input and output sizes of this layer are the same. It increases the nonlinear properties of the decision function and of the overall network without affecting the receptive fields of the convolution layer.
Pooling or subsampling layer
The pooling/subsampling layer reduces the resolution of the features. It makes the features robust against noise and distortion. There are two ways to do pooling: max pooling and average pooling. In both cases, the input is divided into non-overlapping two-dimensional spaces. Each input feature is 28x28 and is divided into 14x14 regions of size 2x2.For average pooling, the average of the four values in the region are calculated. For max pooling, the maximum value of the four values is selected. For 2x2 subsampling, a 4x4 image is divided into four non-overlapping matrices of size 2x2. In the case of max pooling, the maximum value of the four values in the 2x2 matrix is the output. In case of average pooling, the average of the four values is the output. To reduce the spatial dimension of a feature map, we apply maximum pool. A 2x2 maximum pool replaces a 2x2 area by its maximum. After applying a 2x2 pool, we reduce the spatial dimension from 4x4 to 2x2. (Filter size=2, Stride = 2). Here, the maximum value of the four values in the 2x2 matrix is the output, that is max {1,1,5,6} =6, max {2,4,7,8} =8, max {3,2,1,2} =3 and max {1,0,3,4} =4.
CLASSIFICATION
Classification is a method to extract information from data sets. This is done by dividing the data into categories based
on some features. The idea is to derive a model which can perform the sorting process by training it on data objects where the category, or label, is known. The model should then be able to classify unlabelled data with sufficient
accuracy.
Fully connected (FC) layer
Flatten: It is the function that convert the pooled feature map to a single column that is to be passed to the fully connected layer. It serves as a connection between the convolution and dense layers and it flatten the output of the convolution layers. To convert the output of convolutional part of the CNN into a 1D feature vector, it can be used by the ANN part of it. This operation is called flattening
Dropout: It refers to ignoring the neuron units during the training phase of certain set of neurons which is chosen at random. By dropping out, these units are not considered during the forward and backward pass. At each training stage individual nodes are dropped out of the network with probability 1-p or kept with probability p so that a reduced network is left, the incoming and outgoing edges to a dropout node are also removed. Dropout forces a neural network to learn more robust features that are useful in congestion with many different random subsets of other neuron. It doubles the iterations required and reducing each epoch.
SoftMax: The activation is ‘SoftMax’. SoftMax makes the output sum up to 1 so the output can be interpreted as probabilities. The model will then make its prediction based on which option has the highest probability.
Compiling the Model
Compiling the model takes three parameters: optimizer, loss and metrics.
Optimizer: The optimizer controls the learning rate. Here it will be using ‘Adam’ as our optimizer. Adam is generally a good optimizer to use for many cases. The Adam optimizer adjusts the learning rate throughout training. The learning rate determines how fast the optimal weights for the model are calculated. A smaller learning rate may lead to more accurate weights (up to a certain point), but the time it takes to compute the weights will be longer.
Loss function: It use ‘categorical_crossentropy’ for our loss function. This is the most common choice for classification. A lower score indicates that the model is performing better. To make things even easier to interpret, we will use the ‘accuracy’ metric to see the accuracy score on the validation set when we train the model.
Metrics: It contains a list of metrics that is to be evaluate by the model during the training and testing. To specify different metrices for different outputs of a multi-output model, the dictionary must be passed asMetrics={‘output_a’:’accuracy’}
V. RESULT AND DISCUSSION.
Loading the dataset
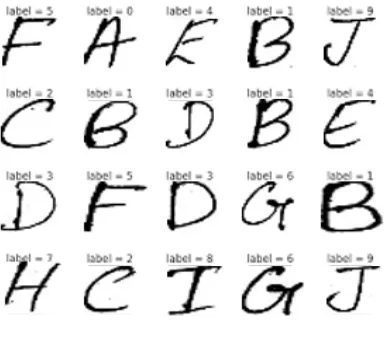
Dataset created contain images of characters from A-Z and digits 0-9. When we load the dataset below, X_train and X_test will contain the images, and y_train and y_test will contain the digits that those images represent.
These data are stored as images in a folder and used as input to train the model thus obtain target as the output. Using for loop read each character and convert to numparray and change to corresponding list and then it calculates the length of each image and label it.
Fig 3: Data and Label
Data pre-processing: These dataset as well as the input image undergoes various image pre-processing stages. It reshapes the data set inputs (X_train and X_test) to the shape that our model expects while train the model. These pre-processed images are driven as the input to the model for training.
Fig 4: Input image with various pre-processing steps (gray scale, threshold, dilation)
Building the model: the model used is sequential model API. The parameters used for the layers in this model are given in the following table.
First convolutional layer First pooling layer
Table 1: First convolution and pooling layer
Input data shape Pool size
[28x28x32] 2x2 Input data shape
No of filter Kernel size Padding Activation
Second convolutional layer Second pooling layer Input data shape
No of filter Kernel size Activation
14x14x32 64 3x3 RELU
Table 2: Second convolution and pooling layer
Third convolutional layer Third pooling layer Input data shape
No of filter Kernel size Activation
7x7x64 96 3x3 RELU
Table 3: Third convolution and pooling layer
Dense layer Dense layer Units
Dropout Activation
128 0.5 RELU
Table 4: Dense layer
Training the model: To train our model, use the ‘fit ()’ function on our model with the following parameters: training data (train_X), target data (train_y), validation data, and the number of epochs. For validation data, use the test set provided in the dataset, which is split into X_test and y_test.
The number of epochs is the number of times the model will cycle through the data. The more epochs run, the more the model will improve, up to a certain point. After that point, the model will stop improving during each epoch. For our model, we set the number of epochs to 10.
Input data shape Pool size
14x14x32 2x2
Input data shape Pool size
7x7x64 2x2
Unit Activation
1 SoftMax
Fig5: accuracy obtained after 10 epochs
After 10 epochs, 97.5% accuracy is obtained on our validation set.
Fig6: output
VI. CONCLUSION
hidden neurons. Here this project demonstrates the use of convolutional neural network in handwritten recognition from a handwritten text decimal and convert into digital format. To achieve maximum accuracy, more training data should be fed to the system. The accuracy is directly proportional to amount of data.
REFERENCES
[1] Deeksha Gulati , Anamika Bhaduri , Sanvar Inamdar , Mayuri Kachare.,”Optical Character Recognition Using Artificial Neural Network”,International Journal Of Recent Trends In Engineering & Research,Volume 2-Issue 4(2016)
[2] Abbas Mustafaoglu, “Offline Character Recognition using Neural Network”, April 2016,
[3]Harpreet Kaur ;Simpel Rani ,”Handwritten Gurumukhi Character Recognition Using Convolution Neural Network”, International Journal of Computational Intelligence Research, Volume 13, (2017)
[4] Omkar Kumbhar;Ajinkya Kunjir ,”A Survey on Optical Handwriting Recognition System using Machine Learning Algorithms”, International Journal of Computer Applications (0975 – 8887) Volume 175 – No.5, October 2017
[5] RohanVaidya ; DarshanTrivedi SagarSatra “Handwritten Text Recognition using Deep Learning”, Second International Conference on Inventive Communication and Computational Technologies ,April 2018
[6]Ali Fadhil Yaseen,”A Survey on the Layers of Convolutional Neural Networks”,International Journal of Computer Science and Mobile Computing, Vol.7 Issue.12, December- 2018, pg. 191-196.
[7]LisaYan. Recognizing Handwritten Characters. CS 231N Final Research Paper.
[8]R. Plamondon, S.N. Srihari,” On-line and off-line handwriting recognition: A comprehensive survey,” IEEE Transactions on Pattern Analysis and Machine Intelligence, vol. 22, no. 1, pp. 63–84, 2000.
[9] Vijay Laxmi Sahu , Babita Kubde,” Offline Handwritten Character Recognition Techniques using Neural Network: A Review”, International Journal of Science and Research (IJSR), India Online ISSN: 2319-7064, Volume 2 Issue 1, January 2013