Open Access
Research article
EGFR associated expression profiles vary with breast tumor
subtype
Katherine A Hoadley
1,2,3, Victor J Weigman
2,3,4, Cheng Fan
2,3,
Lynda R Sawyer
5, Xiaping He
2,3, Melissa A Troester
6, Carolyn I Sartor
3,7,
Thais Rieger-House
8, Philip S Bernard
8, Lisa A Carey
5and
Charles M Perou*
1,2,3,9Address: 1Curriculum in Genetics and Molecular Biology, University of North Carolina at Chapel Hill, Chapel Hill, NC, USA, 2Department of Genetics, University of North Carolina at Chapel Hill, Chapel Hill, NC, USA, 3Lineberger Comprehensive Cancer Center, University of North Carolina at Chapel Hill, Chapel Hill, NC, USA, 4Department of Biology, Program of in Bioinformatics and Computational Biology, University of North Carolina at Chapel Hill, Chapel Hill, NC, USA, 5Division of Hematology/Oncology, Department of Medicine, University of North Carolina at Chapel Hill, Chapel Hill, NC, USA, 6Department of Public Health – Biostatistics and Epidemiology Concentration, University of Massachusetts Amherst, Amherst, MA, USA, 7Department of Radiation Oncology, University of North Carolina at Chapel Hill, Chapel Hill, NC, USA, 8Huntsman Cancer Institute and Department of Pathology, University of Utah School of Medicine, Salt Lake City, UT, USA and 9Department of Pathology & Laboratory Medicine, University of North Carolina at Chapel Hill, Chapel Hill, NC, USA
Email: Katherine A Hoadley - [email protected]; Victor J Weigman - [email protected]; Cheng Fan - [email protected]; Lynda R Sawyer - [email protected]; Xiaping He - [email protected]; Melissa A Troester - [email protected]; Carolyn I Sartor - [email protected]; Thais Rieger-House - [email protected];
Philip S Bernard - [email protected]; Lisa A Carey - [email protected]; Charles M Perou* - [email protected] * Corresponding author
Abstract
Background: The epidermal growth factor receptor (EGFR/HER1) and its downstream signaling events
are important for regulating cell growth and behavior in many epithelial tumors types. In breast cancer, the role of EGFR is complex and appears to vary relative to important clinical features including estrogen receptor (ER) status. To investigate EGFR-signaling using a genomics approach, several breast basal-like and luminal epithelial cell lines were examined for sensitivity to EGFR inhibitors. An EGFR-associated gene expression signature was identified in the basal-like SUM102 cell line and was used to classify a diverse set of sporadic breast tumors.
Results: In vitro, breast basal-like cell lines were more sensitive to EGFR inhibitors compared to luminal
cell lines. The basal-like tumor derived lines were also the most sensitive to carboplatin, which acted synergistically with cetuximab. An EGFR-associated signature was developed in vitro, evaluated on 241 primary breast tumors; three distinct clusters of genes were evident in vivo, two of which were predictive of poor patient outcomes. These EGFR-associated poor prognostic signatures were highly expressed in almost all basal-like tumors and many of the HER2+/ER- and Luminal B tumors.
Conclusion: These results suggest that breast basal-like cell lines are sensitive to EGFR inhibitors and
carboplatin, and this combination may also be synergistic. In vivo, the EGFR-signatures were of prognostic value, were associated with tumor subtype, and were uniquely associated with the high expression of distinct EGFR-RAS-MEK pathway genes.
Published: 31 July 2007
BMC Genomics 2007, 8:258 doi:10.1186/1471-2164-8-258
Received: 17 April 2007 Accepted: 31 July 2007 This article is available from: http://www.biomedcentral.com/1471-2164/8/258
© 2007 Hoadley et al; licensee BioMed Central Ltd.
This is an Open Access article distributed under the terms of the Creative Commons Attribution License (http://creativecommons.org/licenses/by/2.0), which permits unrestricted use, distribution, and reproduction in any medium, provided the original work is properly cited.
Background
The epidermal growth factor receptor (EGFR/HER1) is a member of the human epidermal growth factor receptor (HER) family of transmembrane receptor tyrosine kinases that is linked to growth control, cell adhesion, mobility, and apoptosis [1]. EGFR is an important regulator of epi-thelial cell biology, but its function in breast tumors is complicated by the observation that its function may vary according to important clinical features like estrogen receptor (ER) and HER2 status. Microarray studies have identified several subtypes of breast cancer arising from at least two different epithelial cell types [2-5]. Two of the molecular subtypes of breast cancer are partly defined by the high expression of ER, while a third is partly defined by the genomic DNA amplification and high expression of HER2 (i.e. HER2+/ER-, see [5]). The basal-like subtype has low expression of both ER and HER2, however, most basal-like tumors highly express EGFR as assessed by both gene and protein expression [6].
High expression of EGFR has been reported in a variety of epithelial tumors [7], leading to the development of drugs directed against this receptor [8,9]. One of these targeting strategies employs monoclonal antibodies (cetuximab) that bind the extracellular ligand-binding domain, while other strategies include small molecule inhibitors (gefit-inib and erlot(gefit-inib) that compete with ATP for binding to the intracellular tyrosine kinase domain [10-12]. In non-small cell lung cancer and breast cancer cell lines, it has been shown that some small molecule EGFR inhibitors increase cell killing when used in combination with chemotherapeutics [13,14]; therefore, the interactions between EGFR inhibitors and cytotoxic agents represent a promising combination for the future treatment of epithe-lial tumors that are dependent upon EGFR-signaling. The lack of clinical response in breast cancers treated with gefitinib in vivo has been partially attributed to activation of this pathway downstream of EGFR, or ineffective meth-ods of identifying those tumors that show an EGFR-dependent signature. EGF inEGFR-dependent activation of the EGFR-pathway via the PI3K/AKT pathway may occur through either loss of PTEN or mutation/activation of PI3K, both of which have been linked to gefitinib resist-ance [15-17]. Others have suggested that the MEK/ERK pathway may play a more important role in resistance to EGFR inhibitors [18-20]. Recently, Moyano et al. identi-fied αB-Crystallin (CRYAB) as a protein that can constitu-tively activate the MEK/ERK pathway in breast epithelial cells and caused a cell line to become EGF independent [21].
In this study, we hypothesized that the breast tumor "intrinsic" subtypes might vary in dependence upon EGFR-signaling, which could be reflective of differences in
gene expression patterns. Therefore, we used breast cell lines to identify an EGFR-pathway associated profile and examined interactions between EGFR inhibitors and cyto-toxic chemotherapeutics in vitro. These analyses identified multiple EGFR-associated profiles in vivo that were of prognostic significance, showed important links with tumor subtype, and highlight potential downstream acti-vators of the EGFR-RAS-MEK pathway.
Results
Cell line models of breast cancer
Breast cancer is a heterogeneous disease arising from at least two distinct epithelial cell populations, therefore, we selected cell lines models of basal-like and luminal cells to begin our investigations of the EGFR-pathway. The MCF-7 and ZR-MCF-75-1 cell lines were derived from breast tumors of luminal origin and have expression of CK8/18 and ER. Our previous studies examining cell lines of basal-like ori-gin used immortalized human mammary epithelial cell lines (HMECs) [22,23]; however, these lines are derived from normal rather than tumor tissue. Two ER-negative and HER2-non-amplified tumor-derived cell lines, SUM149 and SUM102, have been previously shown to express EGFR [18,24] and show basal-like expression pro-files [25]. The SUM102 and SUM149 lines share many characteristics with the basal-like tumors including expression of CK5/6, therefore, we included these two tumor-derived lines as in vitro models of basal-like breast cancers. By microarray analysis, EGFR gene expression was low in the luminal cell lines and higher in the basal-like lines. EGFR protein expression by Western blot analysis was detectable in the basal-like lines, but not in the lumi-nal lines (data not shown).
Drug sensitivity assays
To assess EGFR inhibitor sensitivity, the six cell lines described above were treated for 72 h with a range of doses of gefitinib or cetuximab and a MTT assay was used to determine IC50 doses (Table 1). In response to gefit-inib, the basal-like tumor-derived cell lines (SUM149 and SUM102) were two- to 100-fold more sensitive than the luminal lines. The two immortalized HMEC lines were 33- and 50-fold more sensitive to gefitinib than the lumi-nal lines, suggesting that the basal-like cell lines as a whole were more sensitive to gefitinib versus the luminal cell lines. Cetuximab sensitivity was observed in only a single cell line (SUM102, IC50 = 2 ug/ml), with IC50 doses for MCF-7, ZR-75-1, SUM149, ME16C2, and HME-CC not achievable even with cetuximab doses as high as 100 ug/ml. These cell lines were also treated with inhibi-tors that affect targets downstream of EGFR in the path-way including U1026 (MEK1/2 inhibitor) and LY294002 (PI3K inhibitor). Most of the cell lines had a similar level of sensitivity to U0126 with the exception that SUM102 was approximately 5-fold more sensitive. IC50 doses for
LY294002 were similar for most lines with the exception of ME16C and SUM149 cells, which were approximately 5-fold more resistant than the other lines. The SUM102 line was the only cell line that was sensitive to all four inhibitors and has previously been shown to be EGFR-dependent [24], and thus, was chosen for further analyses of the EGFR pathway.
Drug combination analyses
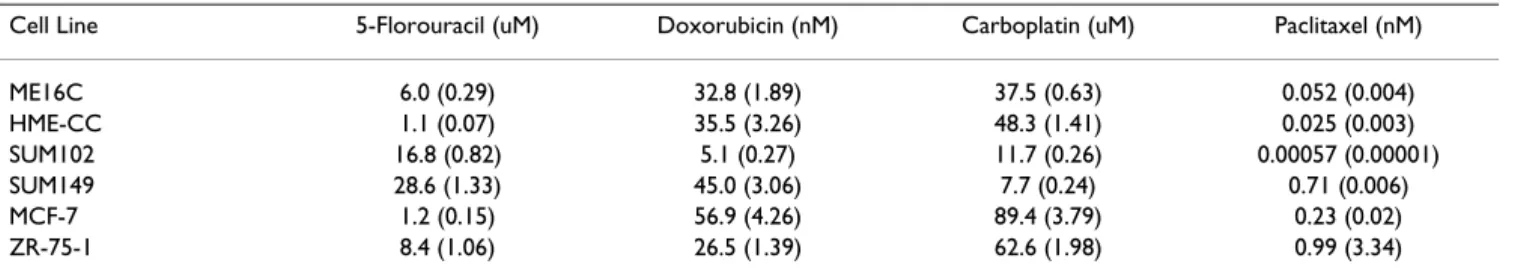
Given the observation that most biologically targeted drugs like cetuximab typically show low response rates when tested in vivo alone, we examined the effects of chemotherapeutics (carboplatin, doxorubicin, 5-fluorou-racil, and paclitaxel) as single agents across all cell lines and the combination of cetuximab plus chemotherapeu-tics in SUM102 cells. Note, we only used the SUM102 cells for the combination studies because they were the only cell line tested for which an IC50 dose for single agent cetuximab could be obtained. We also tested the combined effects of gefitinib, U0126, and LY294002 with chemotherapeutic agents in SUM102 cells. First, individ-ual drug sensitivity (IC50 doses) for each chemotherapeu-tic was determined for all six cell lines (Table 2). The relative sensitivities varied across the cell lines and did not appear to correlate with cell type (i.e. basal-like vs. lumi-nal), with the exception that the two basal-like tumor-derived cell lines (SUM102 and SUM149) were at least three-fold more sensitive to carboplatin, and at least two-fold more resistant to 5-fluorouracil when compared to
their immortalized HMEC counterparts or the luminal cell lines.
As a starting point for combination experiments, we treated SUM102 cells for 72 h with cetuximab and a chemotherapeutic simultaneously. Synergistic interac-tions were not evident in any combination and all combi-nations were antagonistic as assessed by the method of Chou and Talalay in CalcuSyn [26] (Figure 1). We next analyzed the effect of sequential treatment: cells were treated for (a) 72 h with cetuximab followed by 72 h with chemotherapy, (b) 72 h with chemotherapy followed by 72 h with cetuximab, or (c) with cetuximab and chemo-therapy simultaneously for 144 h. Chemochemo-therapy fol-lowed by cetuximab was generally more growth inhibitory than cetuximab followed by chemotherapy (Figure 1). The one exception was cetuximab with paclit-axel, where all sequence combinations were antagonistic (Figure 1). However, this antagonism may result from the high sensitivity to paclitaxel already observed in the SUM102 line (Table 2). Carboplatin followed by cetuxi-mab and the 144 h concurrent treatments were synergistic even at low doses of both drugs. 5-fluorouracil followed a similar trend to that of carboplatin, while in the doxoru-bicin combinations synergy was only evident at doses higher than the IC50 dose for doxorubicin first, or the 144 h concurrent (Figure 1). Similar results were observed for combinations with gefitinib and LY294002 (a PI3K inhib-itor) where chemotherapy followed by each inhibitor, and the 144 h concurrent treatments, were more effective
Table 2: Estimated IC50 doses of breast cell lines treated with chemotherapeutics
Cell Line 5-Florouracil (uM) Doxorubicin (nM) Carboplatin (uM) Paclitaxel (nM)
ME16C 6.0 (0.29) 32.8 (1.89) 37.5 (0.63) 0.052 (0.004) HME-CC 1.1 (0.07) 35.5 (3.26) 48.3 (1.41) 0.025 (0.003) SUM102 16.8 (0.82) 5.1 (0.27) 11.7 (0.26) 0.00057 (0.00001) SUM149 28.6 (1.33) 45.0 (3.06) 7.7 (0.24) 0.71 (0.006) MCF-7 1.2 (0.15) 56.9 (4.26) 89.4 (3.79) 0.23 (0.02) ZR-75-1 8.4 (1.06) 26.5 (1.39) 62.6 (1.98) 0.99 (3.34)
Note that the standard errors are presented within ().
Table 1: Estimated IC50 doses of breast cell lines treated with EGFR, MEK, and PI3K inhibitors
Cell Line Gefitinib (µM) Cetuximab (µg/mL) U0126 (uM) LY294002 (uM)
ME16C 0.3 (0.02) >100a 19.7 (0.66) 21.2 (0.63) HME-CC 0.2 (0.01) >100a 12.7 (0.33) 7.3 (0.17) SUM102 0.1 (0.002) 2.3 (0.15) 4.3 (0.20) 3.4 (0.10) SUM149 4.7 (0.14) >100a 21.8 (0.80) 18.4 (0.48) MCF-7 21.1 (0.29) >100a 17.0 (1.15) 3.9 (0.13) ZR-75-1 11.1 (0.12) >100a 25.0 (0.74) 2.4 (0.05)
72 h IC50 doses were calculated for the EGFR inhibitors gefitinib, cetuximab, the MEK1/2 inhibitor U0126, and the PI3K inhibitor LY294002. Note that the standard errors are presented within ()
Effects of different combination schedules of cetuximab with chemotherapeutics in SUM102 cells
Figure 1
Effects of different combination schedules of cetuximab with chemotherapeutics in SUM102 cells. Cells were
treated with four different combination schedules: 1) 72 h cetuximab followed by 72 h chemotherapy, 2) 72 h chemotherapy followed by 72 h cetuximab, 3) 72 h concurrent chemotherapy and cetuximab, and 4) 144 h concurrent chemotherapy and cetuximab. A) Growth inhibitory effects of cetuximab and carboplatin combinations. B) Combination analysis of cetuximab and carboplatin treatments. C) Growth inhibitory effects of cetuximab and paclitaxel combinations. D) Combination analysis of cetuximab and paclitaxel treatments. E) Growth inhibitory effects of cetuximab and 5-fluorouracil combinations. F) Combi-nation analysis of cetuximab and 5-fluorouracil treatments. G) Growth inhibitory effects of cetuximab and doxorubicin combi-nations. H) Combination analysis of cetuximab and doxorubicin treatments. Combination Index (CI) values below one are synergistic, equal to one are additive, and greater than one are antagonistic.
ug/ml Cetuximab uM Carboplatin 72h Cetux -> 72h Carbo 72h Carbo -> 72h Cetux 72h Cetux+Carbo 144h Cetux+Carbo 0.1 1 10 100 1000 0 0.2 0.4 0.6 0.8 1 Fraction Affected C om bi nat ion I ndex ug/ml Cetuximab pM Paclitaxel 72h Cetux -> 72h PAC 72h PAC -> 72h Cetux 72h Cetux+PAC 144h Cetux+PAC 0 20 40 60 80 100 120 140 0 4 8 12 16 % o f C on tr ol 0 1.2 2.4 3.6 4.8 1 10 100 1000 10000 100000 1000000 10000000 0 0.2 0.4 0.6 0.8 1 Fraction Affected C om bi nat io n I ndex 0 20 40 60 80 100 120 0 4 8 12 16 % of C ont ro l 0 20 40 60 80 A B C D 72h Cetux -> 72h PAC 72h PAC -> 72h Cetux 72h Cetux+PAC 144h Cetux+PAC 72h Cetux -> 72h Carbo 72h Carbo -> 72h Cetux 72h Cetux+Carbo 144h Cetux+Carbo E F G H 0 20 40 60 80 100 120 0 4 8 12 16 ug/ml Cetuximab % of Control 72h Cetux -> 72h 5FU 72h 5FU -> 72h Cetux 72h Cetux+5FU 144h Cetux+5FU uM 5-Fluorouracil 0 40 80 120 160 72h Cetux -> 72h DOX 72h DOX -> 72h Cetux 72h Cetux+DOX 144h Cetux+DOX 0.1 1 10 100 1000 0 0.2 0.4 0.6 0.8 1 Fraction Affected C o m b in ta tion I nde x 0 20 40 60 80 100 120 0 4 8 12 16 ug/ml Cetuximab % of C ont ro l 72h Cetux -> 72h DOX 72h DOX -> 72h Cetux 72h Cetux+DOX 144h Cetux+DOX nM Doxorubicin 0 10 20 30 40 0.1 1 10 100 1000 10000 0 0.2 0.4 0.6 0.8 1 Fraction Affected C om bi na tion I nde x 72h Cetux-> 72h 5FU 72h 5FU-> 72h Cetux 72h Cetux+5FU 144h Cetux+5FU
than the biological inhibitor first (data not shown). Syn-ergy was also observed in SUM149 in addition to SUM102 for combinations of gefitinib and carboplatin (see Addi-tional file 1). U0126 (a MEK inhibitor) combinations exhibited different results and chemotherapeutics given first followed by U0126 were slightly less synergistic than the U0126 first or concurrent treatment; however, for U0126, all combinations except doxorubicin first, or pacl-itaxel first, were synergistic (data not shown).
EGFR-associated gene expression patterns in vitro To identify an EGFR-pathway associated profile, we ana-lyzed the gene expression data of the SUM102 cell line treated with EGFR inhibitors (baseline) and then released from this inhibition to identify those genes that were induced upon removal of the inhibitor. Using an unsuper-vised analysis, we hierarchically clustered all time points from the cetuximab and gefitinib treatment experiments and identified over 500 genes that changed in expression at least 4-fold (Figure 2). Even though the two EGFR inhibitors have different mechanisms of inhibition, SUM102 cells treated for 48 h with gefitinib or cetuximab showed very similar gene expression patterns. Intra-class correlation (ICC) values between the gefitinib and cetuxi-mab treated samples ranged from 0.627 to 0.934, and this level of similarity is evident in the short dendrogram branches from the cluster analysis (Figure 2B). The post treatment samples (i.e. after removal of inhibitor) that represent the reactivation of the EGFR-pathway were even more similar (ICC within each time point ranged from 0.862 to 0.962). A two-class SAM analysis to look for dif-ferences between gefitinib-post treatment samples versus cetuximab-post treatment samples identified only 58 sig-nificantly different genes with a false discovery rate (FDR) of 5%; thus, from a transcription standpoint, gefitinib and cetuximab elicited very similar results in SUM102 cells. In response to gefitinib and cetuximab, the SUM102 cell line exhibited decreased expression of many proliferation genes (Figure 2). There was also a large cluster of genes that were induced by the inhibitors, consisting predomi-nately of hypothetical genes with unknown functions. We were more interested in the genes induced after the removal of the inhibitor as this reflects the gene expres-sion patterns associated with the reactivation of the EGFR pathway. As early as 4 h and 8 h after inhibitor removal there was a substantial increase in expression for two lig-ands of EGFR, namely amphiregulin and epiregulin. Cyclin
A1 was also substantially increased (Figure 2C and 2D).
Starting at 4 h and continuing through 8 h and 24 h, genes with known roles in G1/S phase such as CDC6, CDC7,
TIMELESS, and ORCL6 were increased (Figure 2E and see
Additional file 2). By 8 h and 24 h, DNA synthesis and DNA damage checkpoint genes were induced (Figure 2F). Classical gene expression-defined proliferation genes
including STK6 and Cyclin B1 were highly induced by 24 h (Figure 2G). There was also a repression of negative reg-ulators of growth such as Growth arrest-specific 1 and Cyclin
G2 (see Additional file 2).
Role of MEK and PI3K in the in vitro EGFR-profile Activation of EGFR leads to the downstream activation of other signaling components including the MEK/ERK and PIK3/AKT pathways [1]. To examine the role of these effectors, we treated the SUM102 cell line with the MEK1/ 2 inhibitor U0126 and the PI3K inhibitor LY294002 alone, and in combination. Microarray time course exper-iments using inhibitor treated cells followed by inhibitor removal were conducted for U0126 and LY294002 similar what was done for the cetuximab and gefitinib experi-ments. The observed gene expression profiles for the U0126 and the LY294002 experiments were similar in both gene identity and direction when compared to the cetuximab/gefitinib profile, but gene expression changes were typically reduced in magnitude. The U0126 and LY294002 signatures when compared to each other were very similar at the 4 h and 8 h time points (average ICC = 0.83), but diverged at 24 h post treatment (average ICC = 0.59). The gene expression signatures of LY294002 and U0126 samples were also correlated with the gefitinib/ cetuximab gene expression patterns at 4 h and 8 h post treatment (LY294002 compared to gefitinib/cetuximab ICC = 0.83, U0126 compared to gefitinib/cetuximab ICC = 0.77). The LY294002 and U0126 24 h post treatment samples were less correlated with gefitinib/cetuximab 24 h post samples (LY294002 compared to gefitinib/cetuxi-mab ICC = 0.51, U0126 compared to gefitinib/cetuxigefitinib/cetuxi-mab ICC = 0.41). We also treated cells with LY294002 and U0126 simultaneously to determine if the combined treatment would more completely recapitulate the EGFR-associated profile; the 24 h post combined treatment sam-ples showed a higher correlation value to the gefitinib/ cetuximab samples (average ICC = 0.73), but still did not account for the entire gene expression pattern of the 24 h post cetuximab/gefitinib treatments. These results suggest that the cetuximab/gefitinib profile could not be simply attributed to either the MEK or PIK3 pathway, but that the combination of these two pathways was more representa-tive of the EGFR-signature than either pathway alone. EGFR-associated gene expression patterns in vivo
To identify an EGFR-associated in vivo signature, a one-class SAM analysis was performed using the SUM102 cells to identify the genes that were statistically induced in the post treatment samples relative to the inhibitor treated samples. Adjusting the SAM delta value to obtain the larg-est gene set with less than 5% FDR resulted in a gene list that was extremely large (10,017 genes, 4.97% FDR), therefore, the top 500 induced genes were selected for fur-ther analysis (0.02% FDR). This gene list was next used to
cluster 248 UNC breast tumor and normal samples repre-senting all five breast tumor subtypes (Figure 3 and see Additional file 3). The list of induced genes from the in
vitro SUM102 experiments were not homogenously
expressed across the tumor samples; therefore, to study these multiple expression patterns in the tumors, we defined "clusters" as any gene set that contained a mini-mum of 20 genes and a Pearson node correlation greater than 0.55. Using this criteria, we identified three clusters:
Cluster #1 was highly expressed in a mix of breast tumors that contained all five breast cancer subtypes: luminal A, luminal B, basal-like, HER2+/ER- and normal-like sam-ples (Figure 3C, far right dendrogram branch, 35 genes); Cluster #2 identified a set of tumors that contained 58% of all basal-like tumors, 48% of all HER2+/ER- tumors and 3 luminal B tumors (Figure 3D, center dendrogram branch, 27 genes); Cluster #3 was highly enriched for luminal A and B tumors, and was also highly expressed in Gene expression patterns for SUM102 cells treated with gefitinib or cetuximab
Figure 2
Gene expression patterns for SUM102 cells treated with gefitinib or cetuximab. Unsupervised hierarchical cluster
analysis was performed on 48 h inhibitor treated and 4 h, 8 h, and 24 h post 48 hr inhibitor treated samples. A) The complete cluster overview with the colored bars indicating the location of the clusters shown in C-G. B) Close up of the experimental sample associated dendrogram. C+D) 4 h and 8 h post treatment induced genes including the EGFR ligands Amphiregulin and
Epiregulin. E) Genes involved with the G1/S phase transition induced beginning in the 4 h post inhibitor and continuing though
24 h. F) Genes involved in DNA synthesis induced at 8 h post inhibitor and continuing through 24 h. G) Proliferation genes typically observed in tumor derived profiles including STK6 and Cyclin B1.
Chemokine ligand 20 NM_004591 Dual specificity phosphatase 6 NM_001946 Early growth response 1 NM_001964 Amphiregulin NM_001657 48h Cetuximab DF 48h Cetuximab 3 48h Cetuximab 48h Cetuximab 2 48h Gefitinib 3 48h Gefitinib 2 48h Gefitinib DF 4h post Cetuximab 2 4h post Cetuximab 4h post Gefitinib 2 4h post Gefitinib 8h post Cetuximab 8h post Gefitinib 2 8h post Cetuximab 2 8h post Gefitinib 24h post Cetuximab 24h post Gefitinib 2 24h post Gefitinib 3 24h post Gefitinib 24h post Cetuximab 3 24h post Cetuximab 2
Serine or cysteine proteinase inhibitor, clade B, member 5 NM_002639 Cyclin A1 NM_003914
Epiregulin NM_001432
CDC28 protein kinase regulatory subunit 2 NM_001827 Sin3-associated polypeptide, 30kDa NM_003864 Hypothetical protein FLJ20647 NM_017918
Deoxythymidylate kinase (thymidylate kinase) NM_012145 Timeless homolog NM_003920
Similar to Ubiquitin-conjugating enzyme E2S XM_496186 Ubiquitin-conjugating enzyme E2S NM_014501 Hypothetical protein MGC40489 XM_373742 Uncharacterized bone marrow protein BM039 AK023669 CDC7 cell division cycle 7 NM_003503
Chromatin assembly factor 1, subunit A p150 NM_005483 Replication factor C activator 1 5, 36.5kDa NM_181578 Bloom syndrome NM_000057
WD repeat and HMG-box DNA binding protein 1 NM_001008396 Exonuclease 1 NM_130398
Ubiquitin-conjugating enzyme E2T (putative) NM_014176 Breast cancer 1, early onset NM_007295
MCM5 NM_006739
Polymerase DNA-directed, alpha 70kD NM_002689 DNA replication complex GINS protein PSF2 NM_016095 Hypothetical protein FLJ10706 NM_018186
Proliferating cell nuclear antigen NM_002592 CHK1 checkpoint homolog NM_001274 RecQ protein-like 4 NM_004260 Helicase, lymphoid-specific NM_018063 CDC45 cell division cycle 45-like NM_003504 Cell division cycle associated 5 NM_080668 Primase, polypeptide 1, 49kDa NM_000946 RAD51 homolog (RecA homolog) NM_133487 Cyclin A2 NM_001237
Polo-like kinase 4 NM_014264
Cell division cycle associated 8 NM_018101 Serine/threonine kinase 6 NM_003600 Thymidylate synthetase NM_001071 DEP domain containing 1B BC019075 More than blood homolog NM_017760 Cyclin B1 NM_031966 -6 -4 -2 1:1 2 4 6 A B C E F G D
In vivo EGFR-associated profiles and additional genes implicated in the EGFR-RAS-MEK pathway
Figure 3
In vivo EGFR-associated profiles and additional genes implicated in the EGFR-RAS-MEK pathway. A) The top 500 induced genes from the SUM102 post treatment experiments were hierarchical clustered using the 248 UNC tumors. Colored bars indicate the location of the three clusters in D-E. B) Tumor associated dendrogram color coded according to tumor subtype: Luminal A – dark blue, Luminal B – light blue, true normals and normal-like – green, HER2+/ER-negative – pink, and basal-like – red. C) Cluster #1 that identified a mixed group of tumors. D) Selected genes from the center of Cluster #2 that are high in most basal-like tumors. E) Selected genes from the center of Cluster #3 that are high in the luminal tumors. F) Data for genes with suggested roles in EGFR-pathway. G) Data for the KRAS-amplicon signature identified in Herschkowitz et
al. [35].
Peter pan homolog Drosophila NM_020230 Zinc finger, MYND domain containing 11 NM_212479 Metastasis associated gene family, member 2 NM_004739 BRI3 binding protein NM_080626
GrpE-like 1, mitochondrial E. coli NM_025196 Stress-induced-phosphoprotein 1 NM_006819 Hypothetical protein FLJ20425 NM_017816 Tripartite motif-containing 25 NM_005082 RNA binding motif protein 28 NM_018077 CAD trifunctional protein NM_004341 Hypothetical protein PRO2949 AF119907 Leucine rich repeat containing 14 NM_014665 AC012510
Armadillo repeat containing 6 NM_033415 ATPase family, AAA domain containing 3A NM_018188 ATPase family, AAA domain containing 3B NM_031921 Neurolysin metallopeptidase M3 family NM_020726 WD repeat domain 12 NM_018256 Mitochondrial ribosomal protein S17 NM_015969 Solute carrier family 25, member 19 BC001075 Chromosome 6 open reading frame 66 NM_014165 WD repeat domain 4 NM_033661 Cell division cycle associated 7 NM_031942 Bystin-like NM_004053
Endothelin converting enzyme 2 NM_032331 TIMM8A NM_004085
Cyclin E1 NM_057182
Low density lipoprotein receptor-related protein 8 NM_017522 Small nuclear ribonucleoprotein D1 polypeptide 16kDa NM_006938 Kelch-like 7 Drosophila BC009555
DC13 protein NM_020188 Neighbor of COX4 NM_006067 Frequenin homolog Drosophila NM_014286
Formyltetrahydrofolate synthetase domain containing 1 AL117452 RNA methyltransferase domain containing 1 NM_017819 Mitochondrial ribosomal protein L50 NM_019051 G elongation factor, mitochondrial 1 NM_024996 E-1 enzyme NM_021204
SYNCRIP NM_006372 GTP binding protein 4 NM_012341
Chronic myelogenous leukemia tumor antigen 66 NM_032869 DKFZP564O0463 protein NM_015420
CGI-12 protein NM_015942
Mitochondrial ribosomal protein L15 NM_014175 CGI-115 protein NM_016052 TIMM17A NM_006335
Hypothetical protein DKFZp547B1713 NM_152379 Hypothetical protein FLJ20533 NM_017866 Stem-loop histone binding protein NM_006527 XR_000199
SUMO-1 activating enzyme subunit 2 NM_005499 Splicing factor, arginine/serine-rich 2 NM_003016 Heterogeneous nuclear ribonucleoprotein D-like NM_005463 NM_001031684
Splicing factor, arginine/serine-rich 10 NM_004593 Transcription factor A, mitochondrial NM_003201 Hypothetical protein FLJ14753 NM_032558 Telomere-associated protein RIF1 homolog NM_018151 ATP-binding cassette, sub-family B, member 10 NM_012089
HER2 AREG CRYAB EGFR TGFA A B F C D E >4 1:1 >4 CGI-141 RECQL FLJ10292 STRAP FLJ10637 MRPS35 SURB7 STK38L FLJ22028 KRAS2 PPFIBP1 TM7SF3 EGF MEK1 MEK2 AKT3 PIK3CA AKT1 KRAS Amplicon Signature NRAS PIK3R1 ER HER3 HRAS KRAS2 G ERK2 ERK1
most of the HER2+/ER- and basal-like tumors that were also high for Cluster #2 (Figure 3E, left dendrogram branch- luminal A and B tumors, and center dendrogram branch – HER2+/ER- and basal tumors, 139 genes). Thus each gene cluster could represent a distinct EGFR-associ-ated signature that is enriched in different subsets of tumors (for full gene lists for each cluster see Additional File 4). Gene Ontology (GO) analysis using EASE was per-formed on each gene cluster but only Cluster #3 had any significant GO terms, which were RNA processing, metab-olism, binding, splicing, and modification (EASE scores < 0.05). Cyclin E1 was present within Cluster #2 and is a known prognostic marker for breast cancer patients [27];
Cyclin E1 is also associated with basal-like breast cancers
[28,29], which was recapitulated here. Lastly, Cyclin E1 is known to be regulated by EGFR-signaling [30], where both AKT and ERK can inhibit p27kip1, which is a negative
regulator of CDK2/Cyclin E1 complex [31,32].
To further examine the biological importance of these three EGFR-associated gene sets, we individually applied them to a test set of breast tumors (i.e. the NKI295 sample set described in [33,34]) and determine whether they pre-dicted patient outcomes. First, we determined a mean expression value of all genes within each cluster for each patient. Next, the patients were rank-ordered according to their mean expression values for each cluster and divided into halves or thirds. Kaplan-Meier survival analyses for
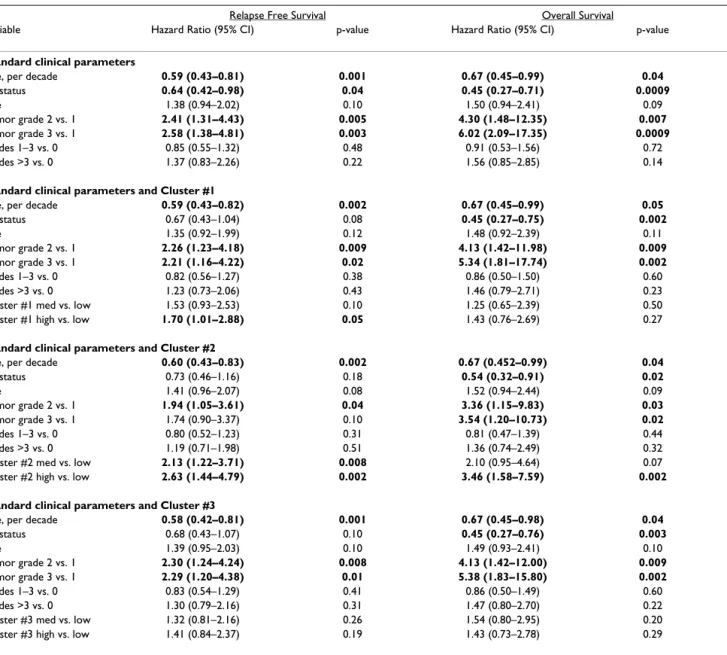
Table 3: Multivariate Cox Proportional Hazards analysis of EGFR clusters with clinical parameters in NKI295 data set
Relapse Free Survival Overall Survival
Variable Hazard Ratio (95% CI) p-value Hazard Ratio (95% CI) p-value
Standard clinical parameters
Age, per decade 0.59 (0.43–0.81) 0.001 0.67 (0.45–0.99) 0.04
ER status 0.64 (0.42–0.98) 0.04 0.45 (0.27–0.71) 0.0009 Size 1.38 (0.94–2.02) 0.10 1.50 (0.94–2.41) 0.09 Tumor grade 2 vs. 1 2.41 (1.31–4.43) 0.005 4.30 (1.48–12.35) 0.007 Tumor grade 3 vs. 1 2.58 (1.38–4.81) 0.003 6.02 (2.09–17.35) 0.0009 Nodes 1–3 vs. 0 0.85 (0.55–1.32) 0.48 0.91 (0.53–1.56) 0.72 Nodes >3 vs. 0 1.37 (0.83–2.26) 0.22 1.56 (0.85–2.85) 0.14
Standard clinical parameters and Cluster #1
Age, per decade 0.59 (0.43–0.82) 0.002 0.67 (0.45–0.99) 0.05
ER status 0.67 (0.43–1.04) 0.08 0.45 (0.27–0.75) 0.002 Size 1.35 (0.92–1.99) 0.12 1.48 (0.92–2.39) 0.11 Tumor grade 2 vs. 1 2.26 (1.23–4.18) 0.009 4.13 (1.42–11.98) 0.009 Tumor grade 3 vs. 1 2.21 (1.16–4.22) 0.02 5.34 (1.81–17.74) 0.002 Nodes 1–3 vs. 0 0.82 (0.56–1.27) 0.38 0.86 (0.50–1.50) 0.60 Nodes >3 vs. 0 1.23 (0.73–2.06) 0.43 1.46 (0.79–2.71) 0.23
Cluster #1 med vs. low 1.53 (0.93–2.53) 0.10 1.25 (0.65–2.39) 0.50
Cluster #1 high vs. low 1.70 (1.01–2.88) 0.05 1.43 (0.76–2.69) 0.27
Standard clinical parameters and Cluster #2
Age, per decade 0.60 (0.43–0.83) 0.002 0.67 (0.452–0.99) 0.04
ER status 0.73 (0.46–1.16) 0.18 0.54 (0.32–0.91) 0.02 Size 1.41 (0.96–2.07) 0.08 1.52 (0.94–2.44) 0.09 Tumor grade 2 vs. 1 1.94 (1.05–3.61) 0.04 3.36 (1.15–9.83) 0.03 Tumor grade 3 vs. 1 1.74 (0.90–3.37) 0.10 3.54 (1.20–10.73) 0.02 Nodes 1–3 vs. 0 0.80 (0.52–1.23) 0.31 0.81 (0.47–1.39) 0.44 Nodes >3 vs. 0 1.19 (0.71–1.98) 0.51 1.36 (0.74–2.49) 0.32
Cluster #2 med vs. low 2.13 (1.22–3.71) 0.008 2.10 (0.95–4.64) 0.07 Cluster #2 high vs. low 2.63 (1.44–4.79) 0.002 3.46 (1.58–7.59) 0.002 Standard clinical parameters and Cluster #3
Age, per decade 0.58 (0.42–0.81) 0.001 0.67 (0.45–0.98) 0.04
ER status 0.68 (0.43–1.07) 0.10 0.45 (0.27–0.76) 0.003 Size 1.39 (0.95–2.03) 0.10 1.49 (0.93–2.41) 0.10 Tumor grade 2 vs. 1 2.30 (1.24–4.24) 0.008 4.13 (1.42–12.00) 0.009 Tumor grade 3 vs. 1 2.29 (1.20–4.38) 0.01 5.38 (1.83–15.80) 0.002 Nodes 1–3 vs. 0 0.83 (0.54–1.29) 0.41 0.86 (0.50–1.49) 0.60 Nodes >3 vs. 0 1.30 (0.79–2.16) 0.31 1.47 (0.80–2.70) 0.22
Cluster #3 med vs. low 1.32 (0.81–2.16) 0.26 1.54 (0.80–2.95) 0.20
Cluster #3 high vs. low 1.41 (0.84–2.37) 0.19 1.43 (0.73–2.78) 0.29
Age was a continuous variable grouped in decade years, size was a binary variable (0 = < 2 cm, 1 = > 2 cm), tumor grade 2 and 3 are relative to grade 1, and node status (1–3 nodes or > 3 nodes) was relative to 0 positive nodes. Expression of the three clusters was averaged, rank ordered, divided into equal thirds; medium and high expression is relative to low expression. Significant variables are displayed in bold.
Relapse-Free Survival (RFS) and Overall Survival (OS) were performed and all three clusters were statistically sig-nificant predictors of outcomes where high expression always predicted a poor outcome (Figure 4 – OS; data not shown for RFS). High expression of clusters #2 and #3 were also significant predictors of RFS and OS in the UNC training data set (data not shown). Using a Cox regression analysis, we tested each cluster with the standard clinical parameters and determined that the high expression (top third) of Cluster #2 compared to the lowest expression (bottom third) significantly predicted a worse outcome for both RFS and OS (Table 3) after controlling for age, ER status, size, grade, and node status. Since the NKI295 data set was enriched for node-negative tumors less than 5 cm in diameter, tumor size and node status were not signifi-cant in the multivariate analysis [33,34]. Chi-squared analyses were performed to identify relations between tumor subtypes and Clusters #1–3. Consistent with obser-vations from Figure 3, the basal-like, luminal B, and HER2+/ER- tumors were associated with the high expres-sion of all three clusters while the luminal A and normal-like samples rarely showed high expression (Table 4, p =< 0.0001); in particular, the majority of basal-like tumors were almost all high for Cluster #2 (89% in top 1/3).
Analysis of EGFR-pathway components relative to expression patterns in vivo
Since most of the genes from the in vivo focused EGFR-associated signatures were not established members of the HER-signaling pathway, we examined the gene expression patterns of many of the known pathway components for their ability to predict patient outcomes, and determined if they showed correlations to any of the EGFR-associated profiles. Gene expression data for three-fourths of the HER family of receptors (EGFR, HER2, HER4), some of their ligands (TGFA, EGF, AREG), as well as other pathway components including MEK1, MEK2, PIK3CA, PIK3R1,
CRYAB, AKT1-3, the RAS proteins (H, K and N), ERK1, ERK2, and a KRAS-amplicon signature (identified and
defined in Herschkowitz et al. [35]), were individually tested for the ability to predict patient outcomes, for cor-relations with tumor subtype (Table 4), and for correla-tions with the EGFR-associated expression Clusters #1–3 (Table 5). Gene expression for individual genes was rank-order and divided into thirds as was done for Clusters #1– 3 previously, and each gene was tested for its ability to pre-dict outcomes in the UNC 248 and NKI 295 tumor data sets. No individual gene's expression pattern listed above significantly predicted RFS and OS in both the UNC and NKI data sets.
Kaplan-Meier survival plots for the 295 NKI tumors/patients using the in vivo defined EGFR-associated profiles
Figure 4
Kaplan-Meier survival plots for the 295 NKI tumors/patients using the in vivo defined EGFR-associated profiles.
The average expression value for each cluster in each patient was determined and the patients then put into rank-order and divided into two equal groups or three equal groups. Overall survival analysis was performed for each cluster. X indicates cen-sored data due loss to follow-up or to information at last checkup. Note that Clusters #2 and #3 were also similarly prognos-tic for the UNC 248 training data set.
Cluster 3 0 0.2 0.4 0.6 0.8 1 0 50 100 150 200 250 OS m onths P ro b a b ilit y Censored low med high 0 0.2 0.4 0.6 0.8 1 0 50 100 150 200 250 OS m onths P ro b a b ilit y Censored low med high Cluster 2 Cluster 1 Two Class - OS Three Class - OS p=8.3x10⁻⁶ 0 0.2 0.4 0.6 0.8 1 0 50 100 150 200 250 OS m onths P ro b a b ilit y Censored low med high p=5.2x10⁻⁵ p=1.5x10⁻⁹ p=1.3x10⁻¹⁰ p=4.4x10⁻⁶ p=0.00035 0 0.2 0.4 0.6 0.8 1 0 50 100 150 200 250 OS m onths P ro b a b ilit y Censored low high 0 0.2 0.4 0.6 0.8 1 0 50 100 150 200 250 OS m onths P ro b a b ilit y Censored low high 0 0.2 0.4 0.6 0.8 1 0 50 100 150 200 250 OS m onths P ro b a b ilit y Censored low high
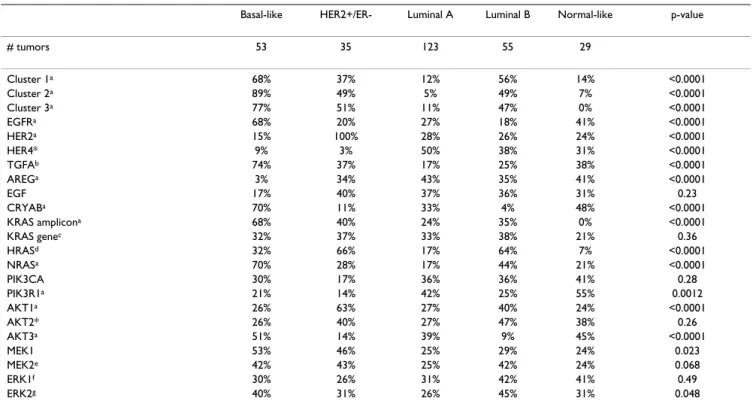
Associations of genes or clusters with intrinsic subtype were examined using Chi-square analysis and many sig-nificant associations were identified (Tables 4). For exam-ple, high HER2 expression, as expected, was significantly correlated with the HER2+/ER- subtype and high ER expression was associated with both luminal subtypes (data not shown). EGFR expression was correlated with the basal-like subtype, while high HER4, AREG, and
PIK3R1 expression was associated with the luminal A
sub-type. Many other associations with the basal-like subtype were also evident that included the high expression of Clusters #1–3, TGFA, AKT3, CRYAB, MEK1, NRAS, KRAS gene and the KRAS-amplicon signature (Table 4). Other potentially biologically relevant associations included the high expression of Clusters #2 and #3, HRAS, MEK1, and
AKT1 with the HER2+/ER- subtype, and high expression
of Clusters #1–3 and HRAS with the luminal B subtype. Even though Clusters #1–3 were identified using a basal-like tumor derived cell line, associations with luminal and HER2+/ER- tumors were identified.
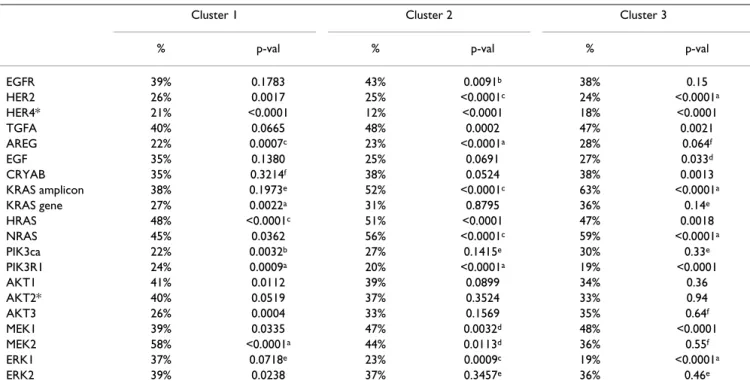
We also tested for associations between the high expres-sion of Clusters #1–3 with the high expresexpres-sion (i.e. top 1/ 3 highest group) of each of the above-mentioned genes in both the UNC and NKI datasets (Table 5). In both data-sets, the high expression of MEK2 and HRAS was associ-ated with Cluster #1, while the high expression of many other genes correlated with Clusters 2 and 3; of note was the high expression of the KRAS-amplicon, HRAS, NRAS, and MEK1 with both Clusters #2 and #3, and the high expression of EGFR with only Cluster #2. The association of different genes with the three EGFR-associated signa-tures is likely reflective of the complexity of signaling in this pathway across breast cancers and suggests possible driving molecular mechanisms for each EGFR-associated profile.
Lastly, a previously described mechanism for activation of the EGFR-RAS-MEK pathway is the somatic mutation of a
RAS gene, BRAF, or EGFR, which can be relatively frequent
events in non-small cell lung carcinomas. We performed sequencing analyses on a subset of the UNC breast tumors analyzed by microarray for EGFR mutations in exons 19
Table 4: Chi-square analysis for association of gene expression with subtypes
Basal-like HER2+/ER- Luminal A Luminal B Normal-like p-value
# tumors 53 35 123 55 29 Cluster 1a 68% 37% 12% 56% 14% <0.0001 Cluster 2a 89% 49% 5% 49% 7% <0.0001 Cluster 3a 77% 51% 11% 47% 0% <0.0001 EGFRa 68% 20% 27% 18% 41% <0.0001 HER2a 15% 100% 28% 26% 24% <0.0001 HER4* 9% 3% 50% 38% 31% <0.0001 TGFAb 74% 37% 17% 25% 38% <0.0001 AREGa 3% 34% 43% 35% 41% <0.0001 EGF 17% 40% 37% 36% 31% 0.23 CRYABa 70% 11% 33% 4% 48% <0.0001 KRAS amplicona 68% 40% 24% 35% 0% <0.0001 KRAS genec 32% 37% 33% 38% 21% 0.36 HRASd 32% 66% 17% 64% 7% <0.0001 NRASa 70% 28% 17% 44% 21% <0.0001 PIK3CA 30% 17% 36% 36% 41% 0.28 PIK3R1a 21% 14% 42% 25% 55% 0.0012 AKT1a 26% 63% 27% 40% 24% <0.0001 AKT2* 26% 40% 27% 47% 38% 0.26 AKT3a 51% 14% 39% 9% 45% <0.0001 MEK1 53% 46% 25% 29% 24% 0.023 MEK2e 42% 43% 25% 42% 24% 0.068 ERK1f 30% 26% 31% 42% 41% 0.49 ERK2g 40% 31% 26% 45% 31% 0.048
Samples were rank ordered into three equal groups and the percentage of each subtype in the highest expression group is reported for the NKI patient data set.
*Note: HER4 could not be assessed in UNC data due to too many missing values; HER3 was not present in the NKI data set; AKT2 was not present in the UNC data set
a associations were also similarly significant in the UNC sample set b nominally significant in UNC data (p-value = 0.0046)
c nominally significant association in the UNC data (p-value= 0.0051) d nominally significant in the UNC data (p-value = 0.003)
e nominally significant in the UNC data (p-value = 0.0023) f significant in the UNC data (p-value = 0.0003) g significant in the UNC data (p-value = <0.0001)
and 20, and for the common mutations in HRAS, KRAS and BRAF. No somatic sequence variants were detected in the 96 tumors that were analyzed, which were over sam-pled for basal-like and HER2+/ER- tumors.
Discussion
The epidermal growth factor receptor family is of tremen-dous biological and clinical importance for many solid epithelial tumors. In breast cancer patients, the response rate to single agent EGFR inhibitors has been low, how-ever, these trials were performed on unselected patient populations [36,37] and response rates might be improved within biologically selected tumor subsets. The EGFR-pathway has become a potential target in the basal-like subtype because at least 50% of basal-basal-like tumors express EGFR as assessed by IHC [6]. Our in vitro analyses show that all basal-like cell lines tested were more sensi-tive to gefitinib compared to luminal cell lines. Only a sin-gle cell line (SUM102) was sensitive to cetuximab when EGF was present in the media, which is the condition that best mimics the in vivo environment [38].
Given the importance of combination therapies, we eval-uated the combination of cetuximab and various chemo-therapeutics in SUM102 cells and observed that the combination of cetuximab and carboplatin was highly synergistic at low doses of each drug. Even though the short-term co-treatment of cetuximab and carboplatin was antagonistic, synergism was observed in the long-term co-treatment. Carboplatin, as well as other platinum derivatives, may also be good chemotherapeutic agents for basal-like breast cancers due to the implicated func-tion of the BRCA1-pathway in this subtype because
BRCA1 mutation carriers are likely to develop tumors of
the basal-like phenotype [3,39,40]. In our basal-like tumor-derived cell lines, it has been reported that the SUM149 line has a BRCA1 mutation and SUM102 line has barely detectable transcript levels of BRCA1 [41]. From a mechanistic standpoint, BRCA1 is required for repair of cisplatin induced DNA damage by recruiting
RAD51 to the site of damage [42,43] and BRCA1-deficient
cells exhibit increased sensitivity to cisplatin compared to wild type cells [44-47]. The combination of an EGFR inhibitor and a platinum drug has also been found to be synergistic in several other cell types [14,48,49]. In our experiments, we showed that not only are the basal-like tumor derived cell lines the most sensitive to carboplatin and the EGFR inhibitors when applied individually, but also that the combination was synergistic. These results provide supportive preclinical evidence for an ongoing clinical trial for "triple-negative/basal-like" (i.e. ER-nega-tive, PR-negaER-nega-tive, and HER2-nonamplified) metastatic breast cancer patients who are receiving either cetuximab alone versus cetuximab plus carboplatin [50].
Given the biological importance of the EGFR pathway in epithelial tumors, we identified an EGFR-associated pro-file in vitro and examined its interplay with other biologi-cal features in vivo. In primary breast tumors, the SUM102-defined set of EGFR-associated genes was broken into three distinct expression patterns (Figure 3), of which the high expression of two predicted poor patient outcomes in both the training and test data sets (i.e. Clusters #2 and #3). The prognostic ability of these clusters was further analyzed in the test set and Cluster #2 could predict poor outcomes even after controlling for the standard clinical parameters in a Cox multivariate analysis. Of the three sig-natures, Cluster #2 was the only cluster significantly asso-ciated with high EGFR gene expression.
Since most of the EGFR-associated in vivo profile genes did not have obvious functions in the HER family pathway (aside from Cyclin E1 in Cluster #2), we searched for cor-relations with the expression levels of well known genes in the pathway. Many relationships were identified that could have important mechanistic implications (Tables 4 and 5). To assist in the interpretation of these complex patterns, we used the program Cytoscape [51,52] to dis-play the gene expression data in a pathway styled format and highlighted the statistically significant associations observed within each subtype (Figure 5). Each subtype had a distinct EGFR-pathway cartoon relative to both the EGFR-associated profiles, as well as the expression of key genes from the EGFR-RAS-MEK pathway. The luminal A subtype showed low expression of most of the genes we examined in the HER family pathway, and on average, was low for all three EGFR-associated profiles. One of the few genes whose high expression was significantly corre-lated with this subtype was the HER4 receptor (Figure 5A); high expression of HER4 and average expression of two of its ligands (HB-EGF and NRG1) was observed in this tumor subtype that typically shows low grade, slow growth, and an ER-rich expression signature.
The luminal B tumors showed moderate to high sion of the EGFR-associated profiles, high HRAS expres-sion, and potentially high MEK2 expression (Figure 5B). The EGFR-HER2 pathway has often been implicated as a potential mechanism for tamoxifen resistance in ER+ patients [36,53-57]. We determined that the high expres-sion of the EGFR-associated profiles was able to predict outcome differences in ER+ and tamoxifen-treated patients in both the UNC and NKI data sets (data not shown); however, it should be noted that the expression of these clusters in ER+ patients closely parallels the dis-tinction of luminal A versus luminal B. These results sug-gest that part of the luminal A versus luminal B distinction is due to the activation of the EGFR/HER2 pathway in luminal B tumors. In support of this hypothesis, ninety-six percent of the luminal B tumors showed high
expres-sion of at least one of the three EGFR-associated clusters, whereas only 24% of luminal A tumors had high expres-sion of at least one. Our results are also consistent with the hypothesis of the "non-genomic" effects of ER to activate the HER pathway, where membrane bound ER complexes with EGFR and/or HER2 to cause activation of the RAS-MEK and p38 pathways [53,54,58], and suggests that these ER "non-genomic" effects are occurring in luminal B tumors. Response to EGFR inhibitors in ER-positive tumors have been mixed with some indicating a benefit [59,60], while others found no benefit [57]. A hypothesis that could be tested is that the high expression of one or more of the EGFR-associated gene sets in ER+ tumors might correlate with response/benefit to EGFR inhibitors. The HER2+/ER- tumors, as expected, showed statistically high expression of HER2 and were also associated with high HRAS and MEK1/MEK2 (Figure 5C). High AKT1 lev-els were also associated with this tumor subtype, which has been previously identified [61,62].
The basal-like subtype showed the high expression of each of the three EGFR-associated profiles; ninety-one percent of the basal-like tumors had high expression of at least one of the signatures with 58% of the tumors having high expression of all three. High expression of many of the genes in the EGFR-RAS-MEK pathway were also signifi-cantly correlated with the basal-like subtype including
EGFR, TGFα, MEK1, MEK2, AKT3, CRYAB, NRAS and the KRAS-amplicon signature (Figure 5D). For many of the
genes or clusters examined here, as many as 70% of the basal tumors were in the highest 1/3 expression group when compared to all other tumors. These data, when coupled to the EGFR inhibitor studies on breast cells lines, strongly suggest that the EGFR-RAS-MEK pathway plays an important role in the basal-like subtype's biology, and may be a requisite activating event for tumor formation. The pathway analysis of the basal-like subtype has also potentially provided important mechanistic clues about how the EGFR-RAS-MEK pathway is activated in basal-like
Table 5: Associations between Clusters #1–3 and individual genes using the NKI295 sample set
Cluster 1 Cluster 2 Cluster 3
% p-val % p-val % p-val
EGFR 39% 0.1783 43% 0.0091b 38% 0.15 HER2 26% 0.0017 25% <0.0001c 24% <0.0001a HER4* 21% <0.0001 12% <0.0001 18% <0.0001 TGFA 40% 0.0665 48% 0.0002 47% 0.0021 AREG 22% 0.0007c 23% <0.0001a 28% 0.064f EGF 35% 0.1380 25% 0.0691 27% 0.033d CRYAB 35% 0.3214f 38% 0.0524 38% 0.0013 KRAS amplicon 38% 0.1973e 52% <0.0001c 63% <0.0001a KRAS gene 27% 0.0022a 31% 0.8795 36% 0.14e HRAS 48% <0.0001c 51% <0.0001 47% 0.0018 NRAS 45% 0.0362 56% <0.0001c 59% <0.0001a PIK3ca 22% 0.0032b 27% 0.1415e 30% 0.33e PIK3R1 24% 0.0009a 20% <0.0001a 19% <0.0001 AKT1 41% 0.0112 39% 0.0899 34% 0.36 AKT2* 40% 0.0519 37% 0.3524 33% 0.94 AKT3 26% 0.0004 33% 0.1569 35% 0.64f MEK1 39% 0.0335 47% 0.0032d 48% <0.0001 MEK2 58% <0.0001a 44% 0.0113d 36% 0.55f ERK1 37% 0.0718e 23% 0.0009c 19% <0.0001a ERK2 39% 0.0238 37% 0.3457e 36% 0.46e
Chi-squared analyses were used to identify associations between the high expression of the individual EGFR-activation profiles for each cluster (top 1/3) and the expression of individual genes categorized as high (top 1/3). The % of tumors with the high expression of each cluster and that show the high expression of the individual gene is shown.
*Note: HER4 could not be assessed in UNC data due to too many missing values; HER3 was not present in the NKI data set; AKT2 was not present in the UNC dataset.
a the statistically significant association was also significant in the UNC data set (p < 0.0025).
b the association was nominally significant in the NKI dataset (p < 0.05), but significant in the UNC dataset (p < 0.0025).
c the association was significant in the NKI dataset (p < 0.0025), but nominally significant in the UNC dataset (p < 0.05).
d the association was nominally significant in both datasets (p < 0.05).
e the association was significant in UNC dataset (p < 0.0025).
f the association was nominally significant in the UNC dataset (p < 0.05).
EGFR pathway diagram displayed for each breast tumor subtype
Figure 5
EGFR pathway diagram displayed for each breast tumor subtype. The average gene expression value for each gene
within each subtype is displayed for the EGFR-pathway and for the three EGFR-activation profiles using the UNC 248 tumor dataset. Eight genes from the middle of each of the three EGFR-activation clusters were used to view expression of the clus-ters in each of the subtypes. A pink node border identifies the genes that showed statistically significant associations with sub-type. *Note: the NKI HER4 data spot was used since HER4 was not present in the UNC data set. A) Luminal A, B) Luminal B,
C) HER2+/ER- and D) Basal-like.
HER2+/ER-
Basal-like
Luminal A
Luminal B
Cluster 1 Cluster 2 Cluster 3 Cluster 1 Cluster 2 Cluster 3 0 >2 >2 Cluster 1 Cluster 2 Cluster 3 Cluster 1 Cluster 2 Cluster 3A
B
C
D
* * * *KRAS Amplicon KRAS Amplicon
KRAS Amplicon
tumors. One example concerns CRYAB, which has previ-ously been shown to be highly expressed in many basal-like tumors and to portend a poor outcome. Moyano et al. showed that the ectopic expression of CRYAB in breast epithelial cells caused them to become transformed and EGF-independent through activation of MEK [21]. This transformed phenotype was reverted by the addition of the MEK inhibitors PD98059 and U0126, while the PIK3 inhibitor LY294002 had little effect. CRYAB could also potentially confer resistance to EGFR inhibitors as well as chemotherapy by its anti-apoptotic mechanism, which is via the inhibition of caspase-3 activation [63,64]. Other potential activation events include the high expression of
HRAS and KRAS; in particular, the KRAS-amplicon
signa-ture (which has also been identified in a murine model of basal-like tumors[35,65]), was highly expressed in 70% of the basal-like tumors and was shown to correlate with high expression of Cluster #2. Given that most basal-like tumors showed either high expression of CRYAB or the
KRAS-amplicon signature (greater than 85%), drug
target-ing of the EGFR-RAS-MEK pathway downstream of EGFR (i.e. MEK inhibitors) might offer a more effective therapy than targeting of EGFR directly.
While these experiments only address gene expression patterns and not the protein levels or phosphorylation status of EGFR or RAS or MEK, we believe it is likely that these signatures are bona fide EGFR-pathway activation signatures. The supportive data for this hypothesis includes the in vitro observations that these are genes induced when an EGFR-dependent cell line is freed from growth inhibition via EGFR inhibitors and the in vivo associations between the high expression of these signa-tures and genes including HRAS, KRAS and EGFR itself. Regardless of the classical markers of activation of the EGFR-RAS-MEK pathway, the strong associations between these expression profiles and patient outcomes in two dif-ferent data sets suggest that they are important profiles. Currently, we have chosen only to validate our profiles using additional microarray data sets, as opposed to using western blots or quantitative PCR of the training set, since each of these signatures represents a large number of genes/proteins. Many of these genes have no current link to the EGFR-signaling pathway and we cannot be sure of which genes are driving the prognostic significance of the clusters. If these signatures show additional promise for clinical application, detailed follow up will dissect which genes are important for prognosis, and then they will be confirmed using other platforms. Perhaps another utility of these profiles might be the ability to predict response to EGFR inhibitors, however, we could not test this hypoth-esis, as there are currently no large epithelial tumor EGFR inhibitor treated microarray data sets available. However, we believe that these signatures could represent a dynamic descriptor of pathway activity compared to EGFR protein
status alone, which does not predict responsiveness to EGFR inhibitors [66-68].
Conclusion
The EGFR pathway is a complex signaling network and differences in gene expression levels of its various compo-nents can be observed across the breast cancer subtypes. EGFR-associated gene expression profiles derived in vitro were prognostic in two independent breast tumor data sets. Using these EGFR-associated gene expression pro-files, and gene expression levels of known genes within the EGFR pathway, we have identified key differences in this pathway across the subtypes. A better understanding of each subtype's EGFR signaling pathway will have an impact on identifying and determining treatment as the gene expression signature may more readily be associated with activation of the pathway than EGFR status alone.
Methods
Cell cultureSUM102 and SUM149 cells were a gift from Steve Ethier of Wayne State University [69] and represent cell lines derived from ER- and HER2- basal-like breast tumors. The SUM cell lines were maintained in an Epithelial Growth Medium developed by the Tissue Culture Facility at the University of North Carolina at Chapel Hill [70], and the SUM149 line was further supplemented with 5% FBS. The MCF-7, ZR-75-1, HME-CC and ME16C cell lines were obtained and maintained as previously described [22,23]. Cytotoxicity assay
Cell line sensitivities to drugs were assessed using a mito-chondrial dye conversion assay (MTT, Cell Titer 96, Promega, Madison, WI) as described previously with the following modifications [22]. Cells were seeded into trip-licate 96-well plates (SUM102, HME-CC, and ME16C – 5,000 cells/well, SUM149 – 10,000 cells/well, MCF-7 and ZR-75-1 – 7,000 cells/well) and allowed to adhere over-night. Cells were treated for 72 h with a range of doses of individual drugs. Carboplatin, doxorubicin, 5-fluorour-acil, paclitaxel, and LY294002 were purchased from Sigma (St. Louis, MO). Gefitinib was a gift from Astra-Zeneca and cetuximab was purchased from the UNC Hos-pitals Pharmacy Storeroom (Chapel Hill, NC). U0126 was purchased from Cell Signaling (Danvers, MA). The inhib-itory concentration that caused a 50% reduction in MTT dye conversion (IC50) dose was determined as previously described [22].
Drug combination interactions were analyzed using methods developed by Chou and Talalay [26]. Using cell lines plated as described above, seven treatment combina-tions consisting of constant ratios of IC50 doses (ranging from one-eighth of each dose to eight times the IC50) were applied to cells and growth compared to untreated
controls using the MTT assay. Four treatment schedules were tested: 72 h concurrent, 72 h inhibitor followed by 72 h chemotherapeutic, 72 h chemotherapeutic followed by 72 h inhibitor, and a 144 h concurrent dose with a media change at 72 h (similar to the sequential treat-ments). CalcuSyn (BioSoft, Cambridge, UK) was used to determine the combination index, which is a measure-ment of the type of drug interactions. A combination index (CI) of one indicates an additive response, less than one indicates a synergistic response (greater than addi-tive), and greater than one indicates an antagonistic response (less than additive).
Collection of mRNA for cell line experiments
For each treatment, the SUM102 cells were grown in 15-cm dishes until 50–60% confluence. SUM102 cells were treated for 48 h with a dose equivalent to two times the 72h-IC50 dose of each inhibitor (treated samples). To identify EGFR, MEK, and PI3K activation signatures, the medium was removed after 48 h of inhibitor treatment and replaced with fresh medium without inhibitor. mRNA was harvested at 4 h, 8 h, and 24 h (post treatment samples). Cells were harvested by scraping, quickly placed into RNA lysis buffer, and mRNA was isolated using the Micro-FastTrack kit (Invitrogen, Carlsbad, CA).
Collection of RNA for human tumor samples
248 breast tissue samples represented by 241 fresh frozen breast tumor samples and 7 normal breast tissue samples were obtained from four different sources using IRB approved protocols from each participating institution: the University of North Carolina at Chapel Hill, The versity of Utah, Thomas Jefferson University and the Uni-versity of Chicago; many of these samples have appeared in previous publications [71-74], and 117 are new to this study (see Additional file 5). The patients were heteroge-neously treated in accordance with the standard of care dictated by their disease stage, ER, and HER2 status. Tumor sequence analysis
Tumor genomic DNA samples were isolated from 96 tumors using Qiagen (Valencia, CA) DNeasy Kits accord-ing to the manufacturers protocol. Gene sequencaccord-ing anal-yses were performed at Polymorphic DNA Technologies (Alameda, CA) using an ABI 3730xl DNA sequencer and cycle sequencing, according to the manufacturers proto-col. A two-step "boost/nested" PCR strategy was used where first a PCR reaction is performed to generate a larger DNA fragment, which is then used as a template for the nested reaction with a second set of PCR primers. Double stranded sequencing was performed on the nested prod-uct using the nested PCR primers as the sequencing prim-ers. Exons 19 and 21 of EGFR were sequenced across all 96 patients, while exons 1 and 2 of KRAS2, 1 and 2 of HRAS,
and 11 and 15 of BRAF were sequenced across 54 patients. No somatic alterations were detected.
Microarray experiments
For the human tumor samples, the total RNA isolation and microarray protocols were performed as described in Hu et al. [5]; in this study, a number of tumor samples from previous studies were retested using a new custom Agilent microarray enriched for breast cancer genes. For cell lines experiments, labeled cRNA was generated from the mRNA using Agilent's Low RNA Input Linear Amplifi-cation Kit as described in Hu et al. [5]. For the cell line studies, the 48 h inhibitor treated samples were compared to an untreated cell line reference to look for effects of an inhibitor, and for the post treatment samples, to identify an activation signature for that drug/pathway. Labeled experimental sample (Cy5 CTP) and reference (Cy3 CTP) were mixed and co-hybridized overnight on the same Custom 22K Agilent Human Whole Genome Oligonucle-otide Microarray described above. Two to four microar-rays per experimental cell line condition were performed, including a dye-flip replicate for gefitinib- and cetuximab-treated samples. Microarrays were scanned on an Axon GenePix 4000B microarray scanner and analyzed using GenePix Pro 5.1 software. Microarray raw data were uploaded into the UNC Microarray Database and Lowess normalization was performed on the Cy3 and Cy5 chan-nels. The microarray and patient clinical data are available at UNC Microarray Database [75] and have been depos-ited in the Gene Expression Omnibus under the accession number GSE6128.
Statistical analyses
Intra-class correlations between cell line microarray exper-iments were performed to judge the degree of concord-ance between experiments/samples as described in Hu et
al. [5]. Unsupervised analyses of the cell line samples were
performed by selecting genes with an absolute signal intensity of at least 30 units (our cutoff for background signal intensity) in both channels in at least 70% of the samples tested and that also showed a Log2 R/G Lowess normalized ratio of two on at least two arrays. The pro-gram Cluster was used to hierarchically cluster samples and genes, and Treeview was used to view the data [76,77]. Using the SUM102 treated cells, a one-class Sig-nificance Analysis of Microarrays (SAM) was used to iden-tify significantly induced genes in all the post treatment experiments (two to three arrays for each experimental time point) [78]. Gene ontology enrichment was assessed using EASE [79].
Analyses of the primary tumor data used the top 500 induced genes from the cell line SAM analysis described above, after filtering for 30 units in both channels in at least 70% of the tumor samples. These genes were
exam-ined in a two-way hierarchical clustering analysis with the 248 UNC tumor sample set. Three distinct expression pat-terns were observed and labeled as Clusters #1–3. Next, the genes in each of these three tumor-defined clusters were identified in the NKI295 patient data set [33,34], and a mean expression value for each cluster for each patient was determined. The NKI295 patients were then rank-ordered and separated into (a) two equal groups rep-resenting low and high, or (b) three equal groups repre-senting low, medium, and high average expression for each cluster. In addition, similar gene-based rank order patient stratifications were performed for individual genes that included EGFR, HER2, HER4, EGF, TGFA, AREG,
CRYAB, KRAS, KRAS-amplicon profile, HRAS, NRAS, PIK3CA, PIK3R1, AKT1, AKT2, AKT3, MEK1, MEK2, ERK1, and ERK2. Survival analyses were performed using
Cox-Mantel log-rank test in Winstat for Excel (R. Fitch Software). Multivariate Cox proportional hazards analysis was performed in SAS v9.0 (SAS Statistical Software, Cary, NC) to estimate the hazard ratio associated with cluster expression in the three groups after controlling for stand-ard clinical predictors (age, ER status, size, grade, and node status). Chi Square tests (SAS v9.0) were used to examine correlations between cluster groups, individual genes, and tumor subtype.
Gene expression relative levels were visualized in relation to the EGFR signaling pathway using Cytoscape [51,52]. The pathway was built de novo based on information from KEGG [80,81], BioCarta [82], and a review by Yarden and Silowkoski [1] with a focus on the RAS-MEK and PI3K/ AKT components. Using the 248 UNC breast tumor microarray dataset, an average gene expression profile is displayed for the Luminal A, Luminal B, basal-like, and HER2+/ER- tumors. Tumor "intrinsic" subtype was deter-mined for each sample using the 306 gene Centroid Pre-dictor described in Hu et al. [71]; the subtype classifications used for the NKI295 sample set were also derived from this same centroid predictor and are described in Fan et al. [83].
Abbreviations
EGFR/HER1: epidermal growth factor receptor; ER: estro-gen receptor; HER: human epidermal growth factor recep-tor; MTT: mitochondrial dye conversion assay [3-(4,5-dimethylthiazol-2-yl)-2,5-diphenyltetrazolium bromide]; CI: Combination Index; SAM: Significance Analysis of Microarrays; HMEC: human mammary epithelial cell; FDR: false discovery rate; GO: gene ontology; RFS: relapse-free survival; OS: overall survival; HR: hazard ratio; 95% CI: 95% confidence interval; ICC: Intraclass correlation; PgR: progesterone receptor.
Authors' contributions
KAH performed the cell line experiments, cell line and tumor data analysis, drafted the paper and helped with the design of the study. VJW, CF, MAT assisted with data analysis. CIS made initial observations of EGFR depend-ency of SUM102 cells and assisted with the discussion. Tumor sample collection, clinical data acquisition and interpretations were accomplished by LAC, LRS, TRH, and PSB. XH performed tumor RNA preparation and microar-ray experiments for tumor samples. CMP was the Princi-pal Investigator, instigated and designed the study, and helped draft the paper.
Additional material
Acknowledgements
We thank AstraZeneca for the gift of gefitinib. We thank Steve Ethier for the gift of SUM102 and SUM149 cell lines. This work was supported by funds for CMP from the NCI Breast SPORE program to UNC-CH (P50-CA58223-09A1), by RO1-CA-101227-01, and by the V Foundation for Cancer Research. LAC was supported by M01RR00046, and K.H. was
sup-Additional file 1
Gefitinib and carboplatin combinations in breast cancer-derived cell lines. Cells were treated for 72 h with constant ratios of the IC50 doses for both gefitinib and carboplatin. Combination Index (CI) values below one are synergistic, equal to one are additive, and greater than one are antagonis-tic.
Click here for file
[http://www.biomedcentral.com/content/supplementary/1471-2164-8-258-S1.pdf]
Additional file 2
Full cluster diagram for the gene expression patterns of SUM102 cells treated with gefitinib or cetuximab.
Click here for file
[http://www.biomedcentral.com/content/supplementary/1471-2164-8-258-S2.pdf]
Additional file 3
Full cluster diagram for the in vivo EGFR-activation profiles clustered on the UNC tumor data set.
Click here for file
[http://www.biomedcentral.com/content/supplementary/1471-2164-8-258-S3.pdf]
Additional file 4
Genes from Cluster #1–3. Genes identified from the 500 SUM102 genes clustered on the UNC tumor dataset.
Click here for file
[http://www.biomedcentral.com/content/supplementary/1471-2164-8-258-S4.doc]
Additional file 5
Clinical data associated with each tumor sample.
Click here for file
[http://www.biomedcentral.com/content/supplementary/1471-2164-8-258-S5.xls]