Open Access
Proceedings
Phenotypic, genetic, and genome-wide structure in the metabolic
syndrome
Lisa J Martin*
1, Kari E North
2, Tom Dyer
3, John Blangero
3,
Anthony G Comuzzie
3and Jeff Williams
3Address: 1Center for Epidemiology and Biostatistics, Cincinnati Children's Hospital Medical Center, Cincinnati, Ohio, 45229 USA, 2Department of Epidemiology, University of North Carolina, Chapel Hill North, Carolina, 27514 USA and 3Department of Genetics, Southwest Foundation for Biomedical Research, San Antonio, Texas, 78245 USA
Email: Lisa J Martin* - [email protected]; Kari E North - [email protected]; Tom Dyer - [email protected]; John Blangero - [email protected]; Anthony G Comuzzie - [email protected]; Jeff Williams - [email protected] * Corresponding author
Abstract
Background: Insulin resistance, obesity, dyslipidemia, and high blood pressure characterize the metabolic syndrome. In an effort to explore the utility of different multivariate methods of data reduction to better understand the genetic influences on the aggregation of metabolic syndrome phenotypes, we calculated phenotypic, genetic, and genome-wide LOD score correlation matrices using five traits (total cholesterol, high density lipoprotein cholesterol, triglycerides, systolic blood pressure, and body mass index) from the Framingham Heart Study data set prepared for the Genetic Analysis Workshop 13, clinic visits 10 and 1 for the original and offspring cohorts, respectively. We next applied factor analysis to summarize the relationship between these phenotypes.
Results: Factors generated from the genetic correlation matrix explained the most variation. Factors extracted using the other matrices followed a different pattern and suggest distinct effects. Conclusions: Given these results, different methods of multivariate data reduction may provide unique clues on the clustering of this complex syndrome.
Background
The metabolic syndrome (MS) is a cluster of abnormali-ties including central obesity, abnormal glucose tolerance, elevated insulin and triglycerides, and depressed HDL-C [1-3]. Previous epidemiological studies have implicated common underlying factors influencing the clustering of this syndrome [4]. Yet, the metabolic, physiological, and genetic mechanisms responsible for this clustering have not been elucidated.
Because major genes involved in the etiology of common complex diseases are likely to exert an effect on multiple quantitative traits, statistical techniques that permit the joint analysis of correlated traits, such as factor analysis, may aid in analysis [5]. Using factor analysis, heritable clusters of MS traits have been identified based on pheno-typic relationships [6,7]. To our knowledge, no studies have used the genetic correlation matrix to construct fac-tors for MS traits. Related to this, no studies have explored the use of a 'genome-wide' correlation matrix as an alter-native to the phenotypic and genetic correlation matrices. from Genetic Analysis Workshop 13: Analysis of Longitudinal Family Data for Complex Diseases and Related Risk Factors
New Orleans Marriott Hotel, New Orleans, LA, USA, November 11–14, 2002 Published: 31 December 2003
BMC Genetics 2003, 4(Suppl 1):S95
<supplement> <title> <p>Genetic Analysis Workshop 13: Analysis of Longitudinal Family Data for Complex Diseases and Related Risk Factors</p> </title> <editor>Laura Almasy, Christopher I Amos, Joan E Bailey-Wilson, Rita M Cantor, Cashell E Jaquish, Maria Martinez, Rosalind J Neuman, Jane M Olson, Lyle J Palmer, Stephen S Rich, M Anne Spence, Jean W MacCluer</editor> </supplement>
Direct manipulation of the genetic and genomic correla-tion matrices could represent a powerful method for elu-cidating the genetic architecture of multiple complex traits. In this study, therefore, we investigated genetic influences on the aggregation of MS phenotypes by apply-ing a uniform factor analytical method to phenotypic, genetic, and genome-wide ('genomic') LOD score correla-tion matrices using five phenotypic traits (total choles-terol (CHOL), high density lipoprotein cholescholes-terol (HDL-C), triglycerides (TG), systolic blood pressure (SBP), and body mass index (BMI)) from the Framingham data set prepared for the Genetic Analysis Workshop 13 (GAW13).
Methods
Data
The Framingham Heart Study was initiated in 1948 and consisted of 5209 men and women between the ages of 30 and 62 recruited from Framingham, Massachusetts. The subjects returned every 2 years for a detailed medical his-tory, physical examination, and laboratory tests. In 1971, a second-generation group consisting of 5124 of the orig-inal participants' adult children and their spouses was enrolled. Longitudinal data were available on SBP, height, weight, CHOL, HDL-C, TG, glucose, hypertensive treat-ment, hypertensive status, number of cigarettes smoked per day, and grams of alcohol per day. Although glucose was available, we were unable to control for diabetes sta-tus, and in the absence of this information the trait was not heritable (data not shown).
The following five phenotypes from the Framingham Heart Study were used to define MS: CHOL, HDL-C, TG, SBP, and BMI. We chose to focus on a single time point for all phenotypic variables. In the original cohort, we used clinic visit 10 because this is the first visit for which data on CHOL and HDL-C were collected. In the offspring cohort, we used clinic visit 1, at which all of the pheno-typic data were available and had been collected during a similar timeframe. We also reasoned that by selecting these visits (as early as possible with the data of interest), we could maximize the number of participants included in our analyses. Outliers more than four standard devia-tions from the mean were dropped; only individuals hav-ing complete covariate data (age, sex, cohort, hypertensive treatment, hypertensive status, and smoking) were kept (n = 1648).
Genome-wide LOD correlations
Using the 330 extended families, heritabilities were esti-mated after adjustment for the above covariates. A vari-ance component model implemented in the program package SOLAR [8], was used to generate multipoint iden-tity-by-descent (IBD) matrices and genome-wide LOD scores. A LOD-score evaluation was performed every 10
centimorgans. Using SAS [9], we calculated a correlation matrix from the genome wide LOD scores.
Phenotypic and genetic correlation matrices
We used bivariate variance-component analysis to esti-mate the phenotypic, genetic, and environmental correla-tions between all pair-wise combinacorrela-tions of traits. This method has been described in detail elsewhere [10,11]; but briefly, the phenotypic covariance is modeled so that the covariation between two individuals for two traits is given by a 2 × 2 covariance matrix with the elements defined by:
Ωab = 2ΦρGσgaσgb + IρEσeaσeb, (1)
where a and b take the values of 1 or 2 and ρG and ρE are the additive genetic and environmental correlations between the traits. The genetic correlation estimates the proportion of genes shared in common between the traits. This approach has been implemented in SOLAR version 2.0. The phenotypic correlation (ρP) is given by:
where and are the heritabilities of the traits. These correlations were assembled into phenotypic and geno-typic matrices for factor analysis.
Factor analysis
The genetic, phenotypic, and genomic correlation matri-ces were factor analyzed to summarize the relationships between the five phenotypes in the MS using SAS [10]. Orthogonal factors that are linear combinations of the original phenotypes are constructed that explain as much of the total variance in the original variables as possible. Factors were varimax rotated, and factor loadings of 0.40 or greater were used to interpret the factor structures [12,13].
Results
Heritabilities were determined to be significant for BMI (38.7 ± 3.9), CHOL (41.5 ± 5.6), HDL-C (41.5 ± 5.6), TG (45.6 ± 5.7), and SBP (16.4 ± 3.5). The LOD scores for the genome scans of the traits are shown in Figure 1. Although there are several suggestive linkages, no LOD scores reach significance [14].
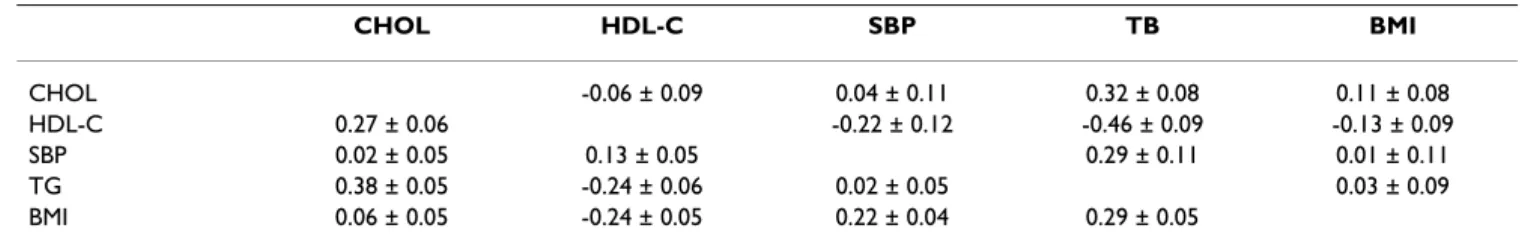
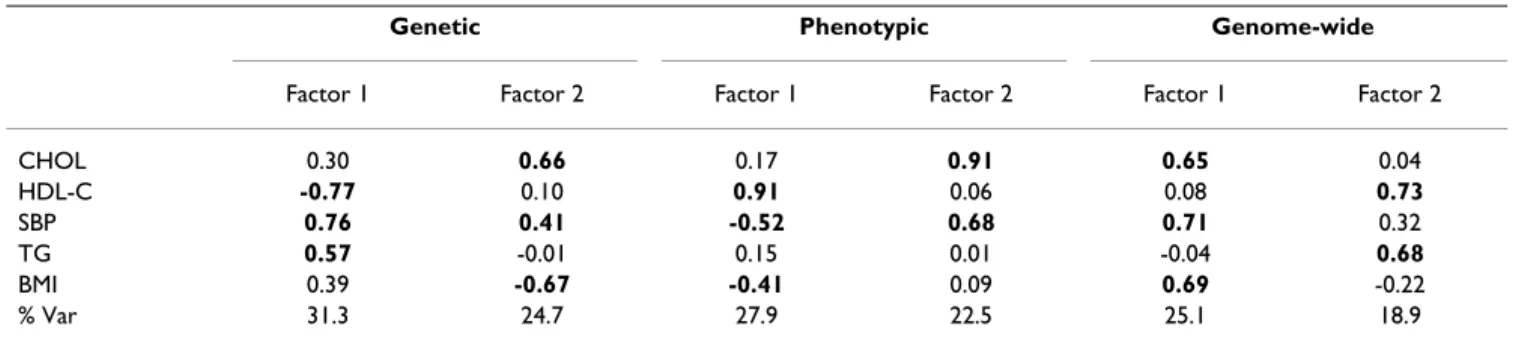
Tables 1 and 2 report the genetic, environmental, genomic, and phenotypic correlation matrices. The rotated factor loadings generated from the genetic, pheno-typic, and genome-wide LOD score correlation matrices are summarized in Table 3. Factor loadings greater that or equal to 0.40 are indicated in bold type. The genetic cor-relation factors explained the most variation with factors
ρP =ρG h12 h22 +ρE (1−h12) (1−h22), ( )2 h12 h22
Genome-wide LOD scores for CHOL (red), HDL-C (green), SBP (blue), TG (orange), and BMI (pink) Figure 1
Genome-wide LOD scores for CHOL (red), HDL-C (green), SBP (blue), TG (orange), and BMI (pink).
Table 1: Genetic (above diagonal) and environmental (below diagonal) correlation matrices ± standard error.
CHOL HDL-C SBP TB BMI CHOL -0.06 ± 0.09 0.04 ± 0.11 0.32 ± 0.08 0.11 ± 0.08 HDL-C 0.27 ± 0.06 -0.22 ± 0.12 -0.46 ± 0.09 -0.13 ± 0.09 SBP 0.02 ± 0.05 0.13 ± 0.05 0.29 ± 0.11 0.01 ± 0.11 TG 0.38 ± 0.05 -0.24 ± 0.06 0.02 ± 0.05 0.03 ± 0.09 BMI 0.06 ± 0.05 -0.24 ± 0.05 0.22 ± 0.04 0.29 ± 0.05
Table 2: Genomic (above diagonal) and phenotypic (below diagonal) correlation matrices.
CHOL HDL-C SBP TB BMI CHOL 0.01 ± 0.05 0.06 ± 0.05 0.25 ± 0.05 0.14 ± 0.05 HDL-C 0.12 0.08 ± 0.05 0.19 ± 0.05 0.01 ± 0.05 SBP 0.03 0.03 0.07 ± 0.05 -0.03 ± 0.05 TG 0.35 -0.34 0.10 0.23 ± 0.05 BMI 0.08 -0.20 0.16 0.18
G1 and G2 explaining, respectively, 31.3% and 24.7% of the total genetic variance. The pattern of loadings differs across the matrices examined, but in general the first fac-tor in each group appears to be a magnitude axis (all load-ing in the same direction) with high loadload-ings in each of the categories (lipids, fatness, and SBP). For the genetic and phenotypic factors, HDL-C loads in the opposite direction from the other variables, but given that decreased levels are a risk factor, this is to be expected. For the genomic factor, HDL-C loads in the same direction as the other variables because the genomic correlation is concerned only with whether genomic regions account for variability but not with direction of change.
Discussion
Previously, factor analysis has been used to identify com-ponents underlying the MS through the construction of factors from phenotypic values. Because factor loadings from the genetic and phenotypic correlation matrices are distinct, however, reliance on phenotypic correlation alone may fail to disclose underlying genetic relationships.
In this study we constructed factors not only from pheno-typic correlations, but also from the genetic and genome-wide LOD score correlations. Factors extracted from these correlations exhibited variable structure and suggest dis-tinctive effects. With the exception of the second factor from the genome-wide LOD score correlation matrix, SBP loaded strongly on every factor. In other studies, however, SBP has not loaded strongly with other components of MS [6,7]. Because we were unable to consider glucose or insu-lin, and because the properties of the variables chosen for analysis can unduly influence the results [15], it is not known whether SBP would remain as pivotal when con-sidered in combination with glucose or insulin.
However, as the genetic correlations are estimated from a polygenic model with no major gene effects estimated, it is possible that the first factor from the genetic correlation matrix is simply summarizing the polygenic effects
between the traits. Similarly, the second factor may sum-marize the QTL effects; indeed, the second factor of the genetic correlation matrix loads similarly to the genome-wide LOD score correlation matrix that summarizes the correlation of QTLs across the genome.
Conclusions
In summary, factors extracted using the phenotypic, genetic, and genome wide LOD score correlation matrices followed different patterns and may suggest distinct effects. Thus, these results imply that different methods of multivariate data reduction provide unique clues on the clustering of this complex syndrome.
Authors' contributions
LM and KN performed statistical analyses and interpreted results. JW assisted in the interpretation of the results. TD calculated the IBDs. JB and AC participated in the design of the study. All authors read and approved the final manuscript.
Acknowledgments
This contribution to GAW13 was supported by National Institutes of Health grants HL28972, HL45522, GM31575, and MH59490. This analysis was SOLAR powered. SOLAR is available at http://www.sfbr.org/sfbr/pub lic/software/solar/index.html.
References
1. Ferrannini E, Haffner SM, Mitchell BD, Stern MP:
Hyperinsulinae-mia: the key feature of a cardiovascular and metabolic syndrome. Diabetologia 1991, 34:416-422.
2. Despres JP, Lamarche B, Mauriege P, Cantin B, Dagenais GR, Moorjani S, Lupien PJ: Hyperinsulinemia as an independent risk factor
for ischemic heart disease. N Engl J Med 1996, 334:952-957.
3. Mitchell BD, Kammerer CM, Mahaney MC, Blangero J, Comuzzie AG, Atwood LD, Haffner SM, Stern MP, MacCluer JW: Genetic analysis
of the IRS. Pleiotropic effects of genes influencing insulin lev-els on lipoprotein and obesity measures. Arterioscler Thromb
Vasc Biol 1996, 16:281-288.
4. Edwards KL, Austin MA, Newman B, Mayer E, Krauss RM, Selby JV:
Multivariate analysis of the insulin resistance syndrome in women. Arterioscler Thromb 1994, 14:1940-1945.
5. Blangero J, Konigsberg LW: Multivariate segregation analysis
using the mixed model. Genet Epidemiol 1991, 8:299-316.
6. Edwards KL, Newman B, Mayer E, Selby JV, Krauss RM, Austin MA:
Heritability of factors of the insulin resistance syndrome in women twins. Genet Epidemiol 1997, 14:241-253.
Table 3: Factor loadings from the genetic, phenotypic, and genomic LOD score correlation matrices.
Genetic Phenotypic Genome-wide
Factor 1 Factor 2 Factor 1 Factor 2 Factor 1 Factor 2
CHOL 0.30 0.66 0.17 0.91 0.65 0.04 HDL-C -0.77 0.10 0.91 0.06 0.08 0.73 SBP 0.76 0.41 -0.52 0.68 0.71 0.32 TG 0.57 -0.01 0.15 0.01 -0.04 0.68 BMI 0.39 -0.67 -0.41 0.09 0.69 -0.22 % Var 31.3 24.7 27.9 22.5 25.1 18.9
Publish with BioMed Central and every scientist can read your work free of charge "BioMed Central will be the most significant development for disseminating the results of biomedical researc h in our lifetime."
Sir Paul Nurse, Cancer Research UK Your research papers will be:
available free of charge to the entire biomedical community peer reviewed and published immediately upon acceptance cited in PubMed and archived on PubMed Central yours — you keep the copyright
Submit your manuscript here:
http://www.biomedcentral.com/info/publishing_adv.asp
BioMedcentral
7. Arya R, Blangero J, Williams K, Almasy L, Dyer TD, Leach RJ, O'Con-nell P, Stern MP, Duggirala R: Factors of insulin resistance
syn-drome-related phenotypes are linked to genetic locations on chromosomes 6 and 7 in nondiabetic Mexican Americans.
Diabetes 2002, 51:841-847.
8. Almasy L, Blangero J: Multipoint quantitative-trait linkage
anal-ysis in general pedigrees. Am J Hum Genet 1998, 62:1198-1211.
9. SAS Institute Inc.: SAS. 8.0 ed. Cary, NC, SAS Institute 2001. 10. Hopper JL, Mathews JD: Extensions to multivariate normal
models for pedigree analysis. Ann Hum Genet 1982, 46:373-383.
11. Blangero J, Williams-Blangero S, Kammerer CM, Towne B, Konigs-berg LW: Multivariate genetic analysis of nevus
measure-ments and melanoma. Cytogenet Cell Genet 1992, 59:179-181.
12. Kleinbaum D, Kupper L, Muller K: Applied Regression Analysis
and Other Multivariate Methods. Boston, MA, Kent Publishing Co
1988.
13. Stevens J: Applied Multivariate Statistics for Social Sciences. Mahwah, NJ, Lawrence, Erlbaum Associates 1996.
14. Lander E, Kruglyak L: Genetic dissection of complex traits:
guidelines for interpreting and reporting linkage results. Nat
Genet 1995, 11:241-247.
15. Meigs JB: Invited commentary: insulin resistance syndrome?
Syndrome X? Multiple metabolic syndrome? A syndrome at all? Factor analysis reveals patterns in the fabric of corre-lated metabolic risk factors. Am J Epidemiol 2000, 152:908-911.