Comprehensive Framework for
Computer-Aided Prostate Cancer
Detection in Multi-Parametric MRI
by
Audrey Chung
A thesis
presented to the University of Waterloo in fulfillment of the
thesis requirement for the degree of Master of Applied Science
in
Systems Design Engineering
Waterloo, Ontario, Canada, 2016
c
This thesis consists of material all of which I authored or co-authored: see Statement of Contributions included in the thesis. This is a true copy of the thesis, including any required final revisions, as accepted by my examiners.
Statement of Contributions
The following two papers are used in this thesis. They are described below:
A. G. Chung, C. Scharfenberger, F. Khalvati, A. Wong, and M. A. Haider, “Statistical textural distinctiveness in multi-parametric prostate MRI for suspicious region detection,” inInternational Conference Image Analysis and Recognition (ICIAR), pp. 368 – 376, July 2015.
This paper is incorporated in Chapter 3of this thesis.
Contributor Statement of Contribution A. G. Chung (Candidate) Conceptual design (70%)
Data collection and analysis (70%) Writing and editing (60%)
C. Scharfenberger Conceptual design (10%) Writing and editing (10%)
F. Khalvati Data collection and analysis (10%) Writing and editing (10%)
A. Wong Conceptual design (20%)
Data collection and analysis (10%) Writing and editing (10%)
M. A. Haider Data collection and analysis (10%) Writing and editing (10%)
A. G. Chung, F. Khalvati, M. J. Shafiee, M. A. Haider, and A. Wong, “Prostate Cancer Detection via a Quantitative Radiomics-Driven Conditional Random Field Framework,” inIEEE Access Journal, vol. 3, pp. 2531 – 2541, 2015.
This paper is incorporated in Chapter 4of this thesis.
Contributor Statement of Contribution A. G. Chung (Candidate) Conceptual design (60%)
Data collection and analysis (70%) Writing and editing (55%)
F. Khalvati Conceptual design (10%)
Data collection and analysis (10%) Writing and editing (15%)
M. J. Shafiee Conceptual design (20%) Writing and editing (10%)
M. A. Haider Data collection and analysis (10%) Writing and editing (10%)
A. Wong Conceptual design (10%)
Data collection and analysis (10%) Writing and editing (10%)
Abstract
Prostate cancer is the most diagnosed form of cancer and one of the leading causes of cancer death in men, but survival rates are relatively high with sufficiently early diagnosis. The current clinical model for initial prostate cancer screening is invasive and subject to overdiagnosis. As such, the use of magnetic resonance imaging (MRI) has recently grown in popularity as a non-invasive imaging-based prostate cancer screening method. In particular, the use of high volume quantitative radiomic features extracted from multi-parametric MRI is gaining attraction for the auto-detection of prostate tumours since it provides a plethora of mineable data which can be used for both detection and prognosis of prostate cancer.
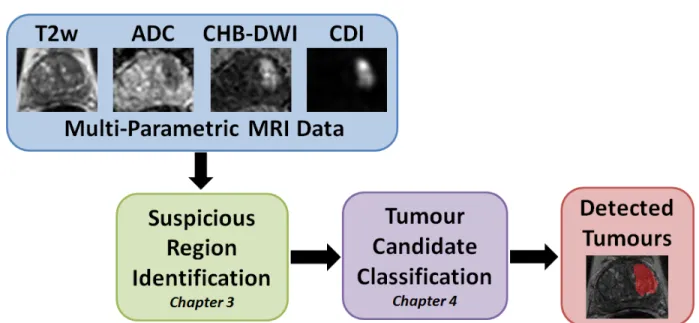
Current image-based cancer detection methods, however, face notable challenges that include noise in MR images, variability between different MRI modalities, weak contrast, and non-homogeneous texture patterns, making it difficult for diagnosticians to identify tumour candidates. In this thesis, a comprehensive framework for computer-aided prostate cancer detection using multi-parametric MRI was introduced. The framework consists of two parts: i) a saliency-based method for identifying suspicious regions in multi-parametric MR prostate images based on statistical texture distinctiveness, and ii) automatic prostate tumour candidate detection using a radiomics-driven conditional random field (RD-CRF). The framework was evaluated using real clinical prostate multi-parametric MRI data from 20 patients, and both parts were compared against state-of-the-art approaches. The suspicious region detection method achieved a 1.5% increase in sensitivity, and a 10% increase in specificity and accuracy over the state-of-the-art method, indicating its poten-tial for more visually meaningful identification of suspicious tumour regions. The RD-CRF method was shown to improve the detection of tumour candidates by mitigating sparsely distributed tumour candidates and improving the detected tumour candidates via spatial consistency and radiomic feature relationships. Thus, the developed frame-work shows potential for aiding medical professionals with performing more efficient and accurate computer-aided prostate cancer detection.
Acknowledgements
First and foremost, I would like to thank my supervisor Prof. Alexander Wong (fondly referred to as the “research dad”), whose unwavering support and eagerness to pursue all things computer vision related has long been a source of inspiration. Thank you for being a wonderful mentor, and for guiding me as I grow as a researcher. Your constant enthusiasm for new (and particularly ridiculous) ideas has shown me some of the most enjoyable aspects of research.
I would like to thank Prof. Paul Fieguth and Prof. Bryan Tripp for reviewing my thesis. Carving out the time from your exceedingly busy schedules to read and revise my thesis is greatly appreciated.
I would also like to thank the colourful and wildly eclectic mosaic of people that make up the Vision and Image Processing Research Group. Your collective love of collaborations has regularly demonstrated that great research happens at the crossroads of innovation and teamwork. There is no doubt that my research experience would have been noticeably less vibrant without you all.
In addition, I would like to thank my family and friends for their constant support and blind faith in my abilities. Thanks for listening to me spew information about topics you were unfamiliar with (but hopefully are now).
Lastly, I would like to thank the Natural Sciences and Engineering Research Council (NSERC) of Canada for funding my research in this thesis.
Dedication
This thesis is dedicated to my uncle, Peter Chung, who was recently diagnosed with prostate cancer.
Table of Contents
List of Tables x
List of Figures xi
Nomenclature xiii
1 Introduction 1
1.1 Current Cancer Screening Approaches . . . 2
1.2 Computer-aided Detection via MRI . . . 3
1.3 Multi-Parametric MRI . . . 3
1.4 Proposed Framework and Thesis Contributions . . . 4
2 Background 6 2.1 Imaging Modalities . . . 6
2.1.1 T2-weighted . . . 6
2.1.2 Apparent Diffusion Coefficient . . . 7
2.1.3 Computed High-b Diffusion Weighted Imaging . . . 8
2.1.4 Correlated Diffusion Imaging . . . 9
2.2 Conditional Random Fields . . . 10
2.3 Radiomics . . . 11
2.3.1 Suspicious Region Identification . . . 12
3 Suspicious Region Identification in Multi-Parametric Prostate MRI 15
3.1 Problem Formulation . . . 15
3.2 Region-based Textural Representations . . . 17
3.3 Sparse Texture Model . . . 17
3.4 Statistical Textural Distinctiveness . . . 18
3.5 Suspicious Region Detection via Saliency Map Computation . . . 19
3.6 Patient Data . . . 19
3.7 Experimental Setup . . . 20
3.8 Experimental Results . . . 21
3.9 Summary . . . 22
4 Tumour Detection in Multi-Parametric Prostate MRI 24 4.1 Problem Formulation . . . 24
4.2 Quantitative Radiomics-driven Feature Model . . . 25
4.3 Radiomics-driven Conditional Random Field . . . 28
4.4 Experimental Setup . . . 30
4.5 Experimental Results . . . 32
4.6 Discussion . . . 35
4.7 Summary . . . 37
5 Conclusion 40 5.1 Summary of Thesis and Contributions . . . 40
5.2 Recommendations . . . 41
5.3 Future Work . . . 42
5.3.1 Prostate Cancer Grading . . . 42
5.3.2 Prognosis and Risk Stratification . . . 42
5.3.3 Discovery Radiomics . . . 42
List of Tables
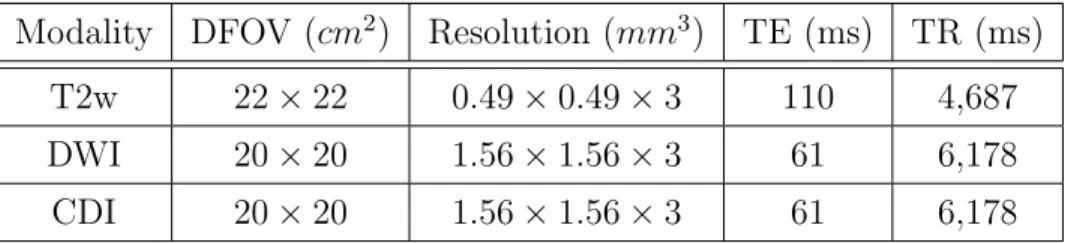
3.1 Description of the prostate T2w, DWI, and CDI imaging data . . . 20
3.2 Comparison of TD (trained with both 4 and 6 texture atoms) with ADC-based method [1] . . . 21
4.1 Comparison of RD-CRF and Khalvati et al. [2] performance metrics . . . . 32
4.2 RD-CRF performance improvement with respect to [2] for different numbers of cases. . . 32
List of Figures
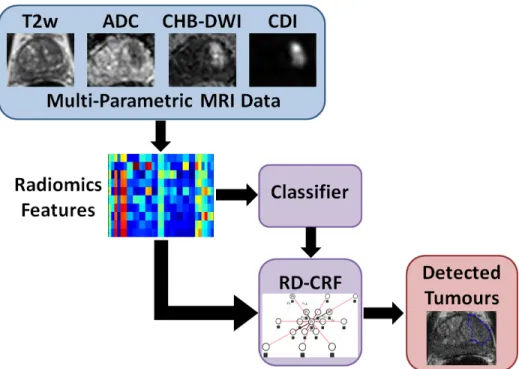
1.1 The proposed comprehensive framework for computer-aided prostate cancer detection via suspicious region detection and tumour candidate classification using multi-parametric MRI. In this thesis, the following multi-parametric MRI modalities were used: T2-weighted imaging (T2w), apparent diffusion coefficient maps (ADC), computed high-b diffusion-weighted imaging (CHB-DWI), and correlated diffusion imaging (CDI). . . 4
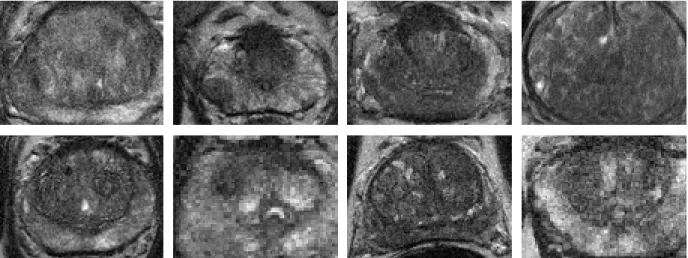
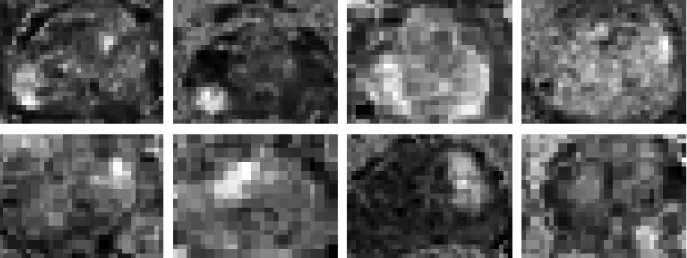
2.1 Sample T2-weighting images from eight different patients. Note that can-cerous regions are extremely difficult to identify visually in this modality. . 7
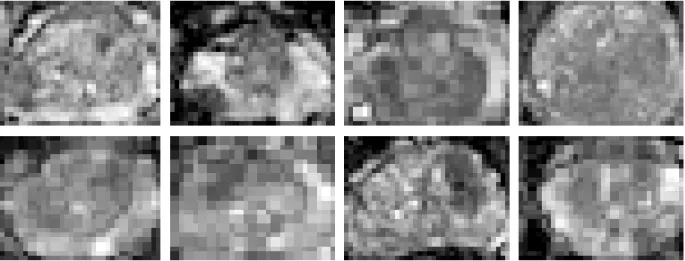
2.2 Sample apparent diffusion coefficient maps computed from diffusion-weighted images from eight different patients. While lower resolution than T2w im-ages, there is increased contrast between cancerous and healthy tissue.. . . 8
2.3 Sample computed high-b diffusion weighted images (computed using Eq. 2.7) from eight different patients. . . 9
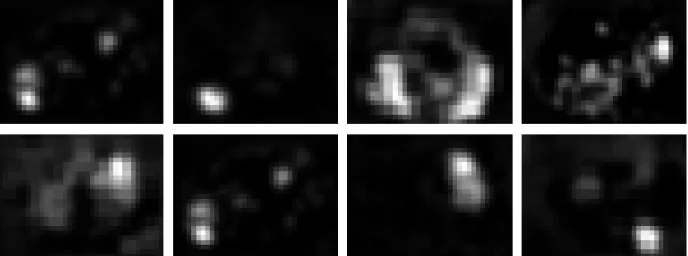
2.4 Sample correlated diffusion images (computed using Eq. 2.8) from eight different patients. . . 10
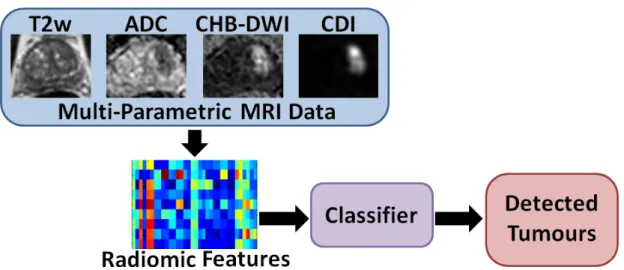
2.5 Radiomic features extracted from multi-parametric MRI in a general cancer detection framework. . . 12
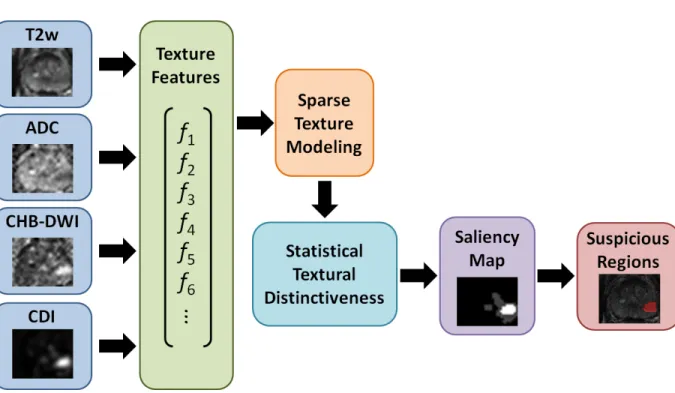
3.1 Saliency-based suspicious region identification via statistical textural dis-tinctiveness . . . 16
3.2 Visual comparison between ADC-based method [1] and texture distinctiveness 22
4.1 Automatic prostate cancer detection via a radiomics-driven conditional ran-dom field (RD-CRF) . . . 26
4.2 Examples of tumour candidates detected by [2]. . . 27
4.3 Realization of proposed radiomics-driven conditional random field framework 30
4.4 RD-CRF performance improvement in sensitivity (shown in red) and speci-ficity (shown in blue) compared to [2]; the graph shows the percent improve-ments in both sensitivity and specificity for different numbers of cases. . . 33
4.5 RD-CRF sensitivity for different number of cases compared to [2] . . . 34
4.6 RD-CRF specificity for different number of cases compared to [2]. . . 34
4.7 Visual comparison of RD-CRF results to pathology and ground truth . . . 35
4.8 Visual comparison of identified prostate tumour candidates produced by [2] and the proposed RD-CRF framework . . . 36
4.9 Examples where tumour candidates are not properly identified . . . 38
Nomenclature
αi Saliency determined from statistical distinctiveness graphical model
αmax Maximum calculated saliency determined from statistical distinctiveness graphical model
βi,j Distinctiveness metric using Kullback-Leibler divergence ˆ
A Estimation of apparent diffusion coefficient map
Λi Set of texture representations that corresponds to saliencyαi
E Set of edges in graph
V Set of vertices (nodes) representing optimal label field Y∗
Φi ith principal component of h(x)
Ψ(Y, X) Energy function factorized from different feature functions Ψc Set of potential functions for a clique c
ψp Inter-voxel spatial and radiomic features-based pairwise function
ψu Data-driven unary function
µ i, µj Mean of t r i, trj Σi, Σj Covariance of tr i, trj
xi Observations associated with voxel
a Single value in apparent diffusion coefficient map
b Gradient strength and pulse duration (b-value) in diffusion-weighted imaging
bγ Given b-value associated with reference signal Sγ
bi Given b-value associated with signal Si
C Set of cliques in conditional random field
c Clique in conditional random field
Cp(i) Pairwise clique structure for a given neighbourhood N(i)
D Strength of the diffusion in diffusion-weighted imaging
eij Edge, connectivity between a pair of nodes representing the relationship between two voxels
G(V,E) Graph realization of the radiomics-driven conditional random field
h(x) Textural representation comprised of sets of texture features
m Number of representative texture atoms
Mxy(0) Initial magnetic resonance signal value
Mxy(t) Decayed magnetic resonance signal at time t
n Number of neighbours in a clique
N(i) Set of n neighbours (neighbourhood)
P Conditional joint probability density function
S Diffusion-weighted signal in diffusion-weighted imaging
S0 Signal intensity without diffusion weighting in diffusion-weighted imaging
Sγ Reference signal associated with b-value bγ
t(x) Compact textural representation ofh(x) produced using PCA
Tr Sparse texture model
tri,trj Representative texture atom corresponding to healthy or suspicious tissue
V(x) Local sub-volume centred at xin correlated diffusion imaging
vc Random variable within clique c
w Number of principal component analysis (PCA) components selected
X Set of observations (voxels) in MR image
x Single voxel in MR image
Y Label field associated with observation set X y Single label associated with voxelx
Y∗ Optimal solution for label field Y y∗ Optimal solution for single label y
yφ Subset of labels (clique) in the surrounding neighbourhood
Chapter 1
Introduction
Prostate cancer refers to the presence of uncontrolled cellular growth (i.e., a malignant tu-mour) in the prostate, and can negatively affect urinary and erectile function in men. The prostate is a walnut-sized gland in the male reproductive system responsible for making seminal fluid, which mixes with sperm from the testicles to make semen. The prostate is located below the bladder and in front of the rectum, surrounding part of the urethra (the tube that carries urine and semen through the penis). While changes to the growth and behaviours of the cells in the prostate may lead to non-cancerous (benign) conditions such as prostatitis and benign prostatic hyperplasia (BPH), they can also lead to precancer-ous conditions such as prostatic intraepithelial neoplasia (PIN), proliferative inflammatory atrophy (PIA), and atypical small acinar proliferation (ASAP) [3].
Prostate cancer is the most diagnosed form of cancer (excluding non-melanoma skin cancers) in Canadian and American men. According to the Canadian Cancer Society [4], there was an estimated 24,000 new cases and 4,100 deaths from it in 2015, making it the third most deadly cancer and accounting for approximately 10% of cancer deaths in Canadian men. Similarly in the United States, there was an estimated 220,800 new cases and 27,540 deaths from prostate cancer in 2015, making it the second most deadly cancer and accounting for approximately 9% of cancer deaths in American men [5]. The median patient survival time for metastatic prostate cancer is between 12.2 to 21.7 months [6]. However, prognosis is relatively good if the prostate cancer is detected early. As such, fast and reliable prostate cancer screening methods are crucial and can greatly impact patient survival rate, as the five-year survival rate in Canada is 96% for patients diagnosed with prostate cancer before the metastatic stage [7].
1.1
Current Cancer Screening Approaches
There are a variety of tests that are presently being used to screen for prostate cancer. Typically, the current clinical model for initial prostate cancer screening employs a digital rectal exam (DRE) and/or a prostate-specific antigen (PSA) test. The DRE is generally done as part of a routine physical exam for adult males over the age of 50 (or in the 40s in the case of men at higher risk of prostate cancer). A healthcare professional performs a DRE by inserting a gloved finger into the rectum and feeling the prostate gland through the rectum wall to check for enlargement or abnormalities. Generally done in tandem with the DRE, the PSA test measures the amount of the PSA protein in the blood. A protein made by the cells in the prostate gland, small amounts of PSA can normally be found in the blood. While many physicians refer to a normal PSA level as 4.0ng/mL of blood of less, the level of PSA varies and tends to increase with age. A PSA level of 2.5ng/mL is typical for men younger than 50, with the upper limit of the normal PSA range increasing by 1.0ng/mL per decade of age [3].
Given a positive DRE or an elevated PSA, a patient undergoes a follow-up transrectal ultrasound (TRUS) guided multicore biopsy for risk stratification. TRUS imaging uses ultrasound to image the prostate via a small probe inserted into the rectum. The probe projects sound waves through the rectum and records the corresponding echoes. The biopsy involves the systematic regional sampling of the prostate where typically eight or more tissue samples are collected [8]. However, these samples are subject to sampling error as prostate tumours imaged by TRUS tend to appear isoechoic and are difficult to differentiate from surrounding tissue [9].
The PSA in particular has recently come under scrutiny, as recent studies [10,11] have demonstrated that the PSA test has a significant risk of overdiagnosis. Only an estimated 50% of men who were screened as having elevated levels of PSA are actually diagnosed with prostate cancer. This oversensitivity leads to expensive, painful, and often unnecessary needle biopsies, and subsequent overtreatment [10–12]. These TRUS guided prostate biopsies cause discomfort, possible sexual dysfunction, and increased hospital admission rates due to infectious complications [13,14]. In addition, the biopsies have a chance of missing the cancerous tissue altogether. The challenge diagnosticians currently face is how to improve prostrate cancer screening by reducing the overdiagnosis due to conventional screening methods while still maintaining a high sensitivity.
1.2
Computer-aided Detection via MRI
The use of magnetic resonance imaging (MRI) has recently grown in popularity as a non-invasive imaging-based prostate cancer screening method. MRI is a medical imaging tech-nique used in radiology to tomographically image anatomy and physiological processes. Using a magnetic field and radio frequency pulses, MRI repeatedly acquires detailed two-dimensional images (or “slices”) over a tissue volume. MRI has been shown to be a viable alternative to the clinical prostate cancer screening methods currently in use.
A diagnosis through MRI, however, requires an experienced medical professional to extensively review the data due to the subtle differences between cancerous and healthy tissue. Manual labelling of image data is time-consuming, and can lead to diagnostic inconsistencies due to variability between radiologists (inter-observer variability) and the variability of a radiologist over multiple sittings (intra-observer variability) [15–17]. To help raise the consistency of radiologists, the European Society of Urogenital Radiology (ESUR) introduced the Prostate Imaging – Reporting And Diagnosis System (PI-RADS) as a common set of criteria [18]. PI-RADS is a set of guidelines for interpreting multiple MRI images, and aims to raise the consistency between diagnosticians through a common set of criteria.
1.3
Multi-Parametric MRI
Within the realm of MRI, there are various types or modalities of MRI that allow for different tissue details to be emphasized. One basic type of MRI is T2-weighted MRI which focuses on measuring the fluid content of tissue, allowing for improved soft tissue contrast relative to other medical imaging techniques [19,20]. Another commonly used modality is diffusion-weighted imaging (DWI); sensitive to the diffusion process of water molecules in biological tissues, DWI has also been shown to provide promising delineation between cancerous and healthy prostate tissue [21–23]. While T2-weighted and DWI have both been shown to provide diagnostically relevant information for prostate cancer localization, the use of multiple MRI modalities (multi-parametric MRI) has been shown to improve prostate cancer screening [22,24]. This is done via the extraction and combination of unique information and features from each modality.
Despite PI-RADS and further development to standardize diagnostic practices across multi-parametric MRI [25], there is still a level of subjectiveness across different medical professionals when assessing MR images that can lead to inter-observer and intra-observer
variability. In addition, notable challenges include noise in MR images, weak contrast, non-homogeneous texture patterns, variability between different MRI modalities, and lack of registration and/or misalignment between different MRI modalities. These challenges make it difficult for diagnosticians to accurately and efficiently identify tumour candidates. As such, computer-aided cancer detection methods are being developed to help the physicians with the process.
1.4
Proposed Framework and Thesis Contributions
Figure 1.1: The proposed comprehensive framework for computer-aided prostate cancer detection via suspicious region detection and tumour candidate classification using multi-parametric MRI. In this thesis, the following multi-multi-parametric MRI modalities were used: T2-weighted imaging (T2w), apparent diffusion coefficient maps (ADC), computed high-b diffusion-weighted imaging (CHB-DWI), and correlated diffusion imaging (CDI).
The purpose of this thesis is to propose a comprehensive framework for computer-aided prostate cancer detection via suspicious region detection and tumour candidate classifica-tion using multi-parametric MRI. There are two main contribuclassifica-tions:
1. A saliency-based method for identifying suspicious regions in multi-parametric MR prostate images based on statistical texture distinctiveness is presented in Chapter3.
In this approach, a sparse texture model is learned via expectation maximization from features derived from multi-parametric MR prostate images, and the statistical texture distinctiveness-based saliency constructed using the model is used to identify suspicious regions.
2. An approach for automatic prostate cancer detection using a radiomics-driven con-ditional random field (RD-CRF) framework is detailed in Chapter 4. In addition to the high-throughput extraction and utilization of a comprehensive set of voxel-level quantitative radiomic features, the proposed RD-CRF framework leverages inter-voxel spatial and radiomic feature relationships to ensure that the auto-detected tu-mour candidates exhibit interconnected tissue characteristics reflective of malignant prostate tumours.
The two main contributions of this thesis focus on creating a comprehensive framework to provide decision support and aid medical professionals with consistently and accurately localizing prostate cancer (shown in Figure1.1). In this thesis, a review of relevant back-ground concepts and state-of-the-art methods are presented in Chapter2. Problem formu-lation, methods, and comparison test results against other state-of-the-art methods using patient data are detailed for the two main contributions in Chapters3and 4, respectively. Lastly, conclusions, recommendations, and future works are discussed in Chapter5.
Chapter 2
Background
In this chapter, background information for the thesis and related works for each pro-posed contribution are presented. The background theory for the used MRI modalities is presented in Section2.1, and the mathematical formulation for conditional random fields (CRF) is described in Section 2.2. An introduction to radiomics and related research is outlined in Section 2.3. A brief description of the existing types of approaches and their limitations are discussed to lead into the thesis contributions. The relevant work for sus-picious region identification is discussed in Section2.3.1, and the applicable literature for prostate tumour detection is presented in Section 2.3.2.
2.1
Imaging Modalities
In this thesis, the following multi-parametric MRI modalities were used: T2-weighted imaging [26], apparent diffusion coefficient maps [27], computed high-b diffusion-weighted imaging [28], and correlated diffusion imaging [29]. The modalities are summarized in the following subsections.
2.1.1
T2-weighted
One of the basic MRI pulse sequences, T2-weighted (T2w) [26] imaging is a MR imaging modality that characterizes the sensitivity of tissue using the differences in transverse (spin-spin) relaxation time of the applied magnetic field. T2 is a time constant that characterizes the time required for the magnetic resonance signal to irreversibly decay to 37% (or 1/e) of its initial value. The transverse relaxation decay is defined as:
Figure 2.1: Sample T2-weighting images from eight different patients. Note that cancerous regions are extremely difficult to identify visually in this modality.
Mxy(t) = Mxy(0)e−t/T2 (2.1)
whereMxy(t) is the decayed signal at time t, and Mxy(0) is the initial signal value.
T2w imaging has been shown to provide some useful information for classification due to a small reduction in signal for cancerous tissue in the prostate gland [22]. Figure 2.1
shows some sample T2w prostate MR images.
2.1.2
Apparent Diffusion Coefficient
Diffusion-weighted imaging (DWI) is an imaging modality in which the sensitivity of the tissue to the Brownian motion water molecules is measured through the application of lobe gradients (pairs of opposing magnetic field gradient pulses) [23]. The diffusion-weighted signalS is formulated as:
S=S0e−bD (2.2)
where S0 is the signal intensity without diffusion weighting, b is the degree of applied diffusion weighting and indicated the gradient strength and pulse duration, and D is the strength of the diffusion. The diffusion-weighted images are typically generated using
Figure 2.2: Sample apparent diffusion coefficient maps computed from diffusion-weighted images from eight different patients. While lower resolution than T2w images, there is increased contrast between cancerous and healthy tissue.
different b values, and can be used to estimate apparent diffusion coefficient (ADC) maps via least-squares or maximum likelihood methods [23] by rearranging 2.2 for the strength of diffusionD: A =−1 bln S S0 (2.3) Cancerous tissue in ADC maps (shown in Figure 2.2) is usually presented with a darker intensity relative to surrounding healthy tissue [27].
2.1.3
Computed High-b Diffusion Weighted Imaging
Previous research has shown that high b-values in DWI data (e.g., b-values greater than 1,000s/mm2) allow for increased delineation between healthy and cancerous tissue [28, 30]. Due to hardware limitations, acquiring high b-value images for prostate imaging is infeasible. CHB-DWI is a computational model for reconstructing high b-value DWI data using low b-value acquisitions [28,31].
Using the general equation for a diffusion-weighted signal Si:
Figure 2.3: Sample computed high-b diffusion weighted images (computed using Eq. 2.7) from eight different patients.
where Sγ is the reference signal corresponding to bγ and A is the ADC map, an estimate ˆ
A for the ADC map can be formulated as a Bayesian estimation problem [28]: ˆ A= arg max A P(S|A) (2.5) = arg max A Y i P(Si|A) (2.6)
whereP(S|A) is the conditional probability of the signal given A, and Si is a single DWI measurement corresponding to b-value bi.
Using the estimate ˆA, computed diffusion-weighted images ˆSi can be obtained for any desired b-valuebi as follows:
ˆ
Si =Sγe−(bi−bγ) ˆA (2.7) Our patient data includes CHB-DWI images (Figure 2.3) constructed at a b-value of 2,000s/mm2 using a Bayesian model with the least-squares estimation used to estimate our ADC maps.
2.1.4
Correlated Diffusion Imaging
Correlated Diffusion Imaging (CDI) [29] is a new diffusion MRI modality that leverages the joint correlation in signal attenuation across multiple gradient pulse strengths and timings
Figure 2.4: Sample correlated diffusion images (computed using Eq.2.8) from eight differ-ent patidiffer-ents.
to improve delineation between cancerous and healthy tissue. The overall characterization of the water diffusion is better represented via the correlation of signal attenuation across all b-values within a local sub-volume, which is obtained via signal mixing [29]:
CDI(x) = Z ... Z bn b0 S0(x)...Sn(x)P(S0(x), ...Sn(x)| V(x)×dS0(x)...dSn(x) (2.8) wherebi represents the utilized b-values,xis the spatial location,S is the acquired signals,
P represents the conditional joint probability density function, and V(x) is the local sub-volume centred atx. Figure 2.4 shows some sample CDI prostate images.
2.2
Conditional Random Fields
First proposed by Lafferty et al. [32], conditional random fields (CRFs) are a framework for building probabilistic models to label data. There are several advantages of CRFs over hidden Markov models [33] and stochastic grammars, such as the ability to relax the strong independence assumptions made in those models. In addition, CRFs also bypass the label bias problem of maximum entropy Markov models [34] and other discriminative Markov models. The label bias problem [32] refers to the susceptibility of these models to favour states with few successor states, i.e., the transitions leaving a given state compete only
against each other, rather than against all other transitions in the model. CRFs solve this bias problem by having a single exponential model for the joint probability of the entire set of labels given the observations.
CRFs can be formulated as a graph G(V,E), where V is the set of vertices (nodes) representing the states Y and E is the set of edges of the graph. Given G, (X, Y) is a conditional random field where the random variables y ∈ Y obey the Markov property with respect to the graph when conditioned on X. In this thesis, we use an undirected CRF, the probability distribution of which can represented using a product of non-negative functions of the maximal cliques of graphG [35]:
p(v) = 1
Z
Y
c∈C
Ψc(vc) (2.9)
where factors Ψcare potential functions ofvcwithin cliquec∈C; conditionally independent nodes belong to different cliques and do not appear within the same factor.
The general model for a CRF is formulated as
P(Y|X) = 1
Z(X)
Y
c∈C
Ψc(Xc, Yc) (2.10)
where P(Y|X) is the conditional probability of labels Y given observations X, and Z(X) is the normalization function given the observations X.
2.3
Radiomics
More recently, a particularly promising and powerful approach to cancer detection that could have significant potential for prostate cancer detection is radiomics [2,36–39], which involves the high-throughput extraction and utilization of a large amount of quantitative features for characterizing tumour phenotype. Radiomics facilitates for a high-dimensional mineable feature space that can be utilized for both detection and prognosis [36]. Studies on lung and head-and-neck cancer patients have confirmed the prognostic power of radiomics features when it comes to patient outcome prediction for personalized medicine [36–38]. However, the prognostic capability of radiomics features has only very recently been in-vestigated for prostate cancer detection (general framework shown in Figure 2.5) and the quantitative characterization of prostate tumour phenotype.
Figure 2.5: Radiomic features extracted from multi-parametric MRI in a general cancer detection framework.
2.3.1
Suspicious Region Identification
One specific area of research is the identification of suspicious regions to aid physicians with performing a more efficient and accurate diagnosis. The current method for identifying suspicious regions is to threshold apparent diffusion coefficient (ADC) maps, as low ADC values are associated with tumorous tissue [22]. Cameron et al. [1] proposed a threshold-based approach where tissue associated with ADC values within a threshold range are automatically identified as suspicious.
y =
(
1 a∈A, a <1000×10−6mm2/s
0 otherwise (2.11)
where a is a single value in the ADC map A. However, this method depends on fixed thresholds, making it susceptible to noisy MR images and ADC variations across different sets of multi-parametric MRI data.
2.3.2
Computer-Aided Prostate Tumour Detection
Current methods for radiomics-driven automatic computer-aided prostate tumour detec-tion typically use a supervised method trained on a set of low-level features calculated from multispectral MR images. Lemaˆıtreet al.[40] recently published a comprehensive review of
state-of-art methods for prostate cancer detection and diagnosis. These radiomics-driven methods use hand-crafted feature sets and some combination of the following classifiers: Bayesian, random forest, logistic regression, neural network, linear discriminant, Gentle-Boost, support vector machines, relevance vector machines, fuzzy Markov random fields, and conditional random fields.
Madabhushiet al.[41] extracted three-dimensional texture features from MRIs that had been corrected for background inhomogeneity and nonstandardness. For each image voxel, a trained Bayesian classifier assigns a malignancy “likelihood” to each feature indepen-dently, and the “likelihood” images are then combined using an optimally weighted feature combination scheme. Using similar features as [41], Tiwariet al. proposed a method that combines structural and metabolic imaging data for prostate cancer detection and detected cancerous regions within prostate tissue using a random forest classifier.
Dudaet al. [42] published a semi-automatic multi-image texture analysis method that simultaneously analysed several images (each acquired under different conditions) of the same organ. In addition to the features used by [41], Duda et al. also extracted fractal-based and run length features and assessed the potential of multi-image texture analysis using different classifiers including logistic regression, a neural network, and support vector machines.
Litjens et al. [43] used features that represent pharmacokinetic behaviour, symmetry and appearance, and other anatomical aspects. In a two-stage computer-aided prostate cancer detection system, Litjens et al. detected initial candidates via multi-atlas-based prostate segmentation using a selective and iterative method for performance level esti-mation (SIMPLE) [44]. The authors then experimented with three different classifiers for voxel classification and candidate classification: linear discriminant, GentleBoost, and random forest.
Similar to Litjens et al., Vos et al. [45] also developed a two-stage classification ap-proach for computer-aided prostate cancer detection. Voset al. analysed lesion candidates and discriminated prostate cancer from benign abnormalities using a linear discriminant classifier. Ozer et al. [46] used parametric images derived from DCE MRI, and proposed the use of relevance vector machines (RVM) with a Bayesian framework. Ozer et al. then evaluated the method against support vector machines (SVM) with the same framework.
Khalvatiet al.[39] proposed a multi-parametric MRI texture feature model for radiomics-driven prostate cancer analysis. The texture feature model, based on the one proposed by Peng et al. [47], comprises of 19 low-level texture features extracted from each MRI modality, including features extracted from the gray-level co-occurrence matrix (GLCM). Khalvati et al. [2] more recently published radiomics-driven models as an extension of the
previous texture feature model. An attempt at designing comprehensive quantitative fea-ture sequences, the radiomics-driven models include additional MRI modalities, additional low-level features, and feature selection.
Recently, the use of random fields for prostate cancer detection has grown in popularity. The use of fuzzy Markov random fields (MRFs) in particular has been investigated [48–50], as fuzzy MRFs are an unsupervised method for cancerous tissue classification. Liuet al.[48] proposed a new method for estimating the parameters of the Markovian distribution of the measured data, and applied it to feature vectors extracted from multispectral prostate MRI datasets for prostate cancer detection. An extension on previous work, Ozeret al.[49] also propose the use of fuzzy MRFs as an unsupervised alternative to the previously proposed SVM and RVM, and evaluate the classifiers using feature vectors formed from the peripheral zone of multispectral prostate MRI datasets.
Lastly, Artan et al. [50] presented a cost-sensitive SVM cancer localization method as an extension to the conventional SVM for prostate cancer detection. Trained via a full grid search over the ν and γ values (SVM kernel parameters) to determine the optimal parameters, the cost-sensitive SVM shows improved results relative to the conventional SVM. Artan et al. also proposed a new segmentation method by combining conditional random fields (CRF) with a cost-sensitive framework. Using node potential parameters
w obtained from SVM and subsequently estimated edge potential parameters κ, the cost-sensitive CRF demonstrated improved cost-cost-sensitive SVM results by incorporating spatial information.
Chapter 3
Suspicious Region Identification in
Multi-Parametric Prostate MRI
In this chapter, the proposed method for identifying suspicious regions using prostate multi-parametric MRI is described. The components of the method are region-based textural representations, sparse texture model, statistical textural distinctiveness, and suspicious region identification via saliency, and are presented in Section3.2, Section3.3, Section3.4, and Section 3.5, respectively. The patient data used in this thesis is described in detail in Section 3.6. Experimental setup and applicable quantitative metrics are outlined in Section 3.7, and both quantitative and visual results are shown in Section 3.8. At the end of this chapter, a brief summary of the method and implications of the results are discussed.
3.1
Problem Formulation
One specific area of research is the identification of suspicious regions to aid physicians with performing a more efficient and accurate diagnosis. The current method for identifying suspicious regions is to threshold apparent diffusion coefficient (ADC) maps, as low ADC values are associated with tumorous tissue [22]. Cameron et al. [1] proposed a threshold-based approach where tissue associated with ADC values within a threshold range are automatically identified as suspicious. However, this method depends on fixed thresholds, making it susceptible to noisy MR images and ADC variations across different sets of multi-parametric MRI data.
Figure 3.1: Proposed framework for identifying suspicious regions using prostate multi-parametric MRI. Unique texture features extracted from different MRI modalities are used to learn a sparse texture model, and suspicious regions are identified via a statistical textural distinctiveness-based saliency map.
To facilitate a more reliable diagnosis, a novel method for identifying suspicious regions indicative of potential prostate cancer using texture-based saliency in multi-parametric MR images is proposed. The proposed method uses unique texture information from each MRI modality to learn a sparse texture model, and better characterize suspicious tissue within a patient’s MRI data.
A novel method is proposed for identifying suspicious regions to better aid physicians with performing more efficient and accurate diagnoses. The proposed method uses multi-parametric MR images and incorporates cross-modality texture features to better identify suspicious regions via statistical textural distinctiveness. Figure 3.1 shows the general algorithmic framework developed.
3.2
Region-based Textural Representations
Region-based (or image patch-based) textural representations are used to allow for the characterization of texture features indicative of suspicious regions in prostate MR images. For region-based textural representations, we incorporate the feature set proposed by Khal-vati et al. [39], which consists of sets of 19 low-level texture features extracted each from T2-weighted (T2w) images, apparent diffusion coefficient (ADC) maps, computed high-b diffusion-weighted imaging (CHB-DWI) data, and correlated diffusion imaging (CDI) data, to better capture healthy and cancerous tissue characteristics. These MRI modalities were selected based on their potential to separate cancerous from healthy prostate tissue.
The sets of texture features are combined into a single textural representationh(x), and a compact version of the textural representation is produced using principal component analysis (PCA). PCA [51] is used to increase the variance between the elements of the texture descriptor and to improve the efficiency of the subsequent sparse texture model and statistical textural distinctive model stages. A compact textural representation t(x) is produced using the w principal components of h(x) with the highest variance:
t(x) = hΦi(h(x))|1≤i≤wi (3.1)
where Φi is theithprincipal component ofh(x). Whilewcan be selected based on variance compactness,wcomponents ofh(x) were selected to represent 90% of the variance of all the textural representations as determined through extensive empirical testing via parameter grid search.
3.3
Sparse Texture Model
To characterize healthy and suspicious tissue for a patient, a sparse texture model is learned using the extracted multi-parametric MRI texture features [39]. The sparse texture model incorporates unique texture features from each MRI modality to learn tissue characteristics via cross-modality texture information. Thus, the sparse texture model can better identify healthy and suspicious tissue.
Using a subset t(x)T of the compact textural representations t(x) as training data, a global texture model is defined to represent the heterogeneous characteristics of healthy and suspicious prostate tissue. As global texture modelling is computationally expensive, we generalize an MRI slice as being composed of a set of regions where a particular texture
pattern is repeated over a given area. In addition, the number of areas with unique texture patterns is assumed to be much fewer than the number of individual voxels in the training data, allowing for the a sparse texture model to fully characterize the MRI data.
Using this generalization, we can establish a textural sparsity assumption, and the global textural characteristics of prostate tissue can be well-represented using a small set of distinctive local textural representations. This allows for the use of a sparse texture model, defined as a set of m representative texture atoms:
Tr ={tri|1≤i≤m} (3.2)
The sparse texture model used in the proposed method is a set of representative texture atoms corresponding to healthy or suspicious tissue, where each texture atom represents the mean and covariance (i.e., tr
i ∼ N(µi,Σi)) of a particular texture pattern characteristic of healthy or suspicious tissue. The representative atoms in the sparse texture model are learned via expectation maximization [52] in a Gaussian mixture model [53].
3.4
Statistical Textural Distinctiveness
Suspicious regions in prostate MRI data can be characterized as areas that are highly unique and texturally distinct. Using the concept of statistical textural distinctiveness [54], we quantify the distinctiveness of texture patterns and uncover the underlying saliency by using the statistical relationship between texture patterns across different MRI modalities. To define statistical textural distinctiveness between two representative texture atoms (denoted as tr
i and trj) in the sparse texture model, we use Kullback-Leibler (KL) diver-gence [55] to measure the statistical difference between the representative texture atoms in the sparse texture model:
βi,j = log |Σj| |Σi| −w+trace(Σ−j1Σi) + (µ j−µi) TΣ−1 j (µj−µi) 2 (3.3)
whereuis the number of PCA components selected,µ
i andµj represent the mean oft r i and
trj, respectively, and Σi and Σj represent the covariance of tri and trj, respectively. Thus, the distinctiveness metric βi,j increases as the texture patterns become more distinct from one another.
3.5
Suspicious Region Detection via Saliency Map
Com-putation
As the majority of prostate tissue is considered to be healthy, salient regions can be inter-preted as suspicious due to the uniqueness and statistical occurrence of the corresponding cross-modality texture characteristics. Given a subset of compact texture features used for testing (denoted ast(x)Z), the saliency map for a given MRI image can be computed using the previously determined statistical textural distinctiveness graphical model. The saliencyαi is defined as:
αi = m
X
j=1
βi,jP(tri|t(x)Z) (3.4)
whereP(tri|Z) is the occurrence probability of tri int(x)Z.
For Λi being the set of texture representations that corresponds to saliency αi, voxels belonging to salient representative texture atoms Λi (i.e., αi > αmax2 ) are classified as regions of suspicious tissue, with all other voxels classified as healthy tissue. That is, each voxelx in a given MRI image is assigned a label y:
y=
(
1 x∈Λi, αi > αmax2
0 otherwise (3.5)
3.6
Patient Data
The performance of the proposed framework was evaluated using the MP-MRI data of 20 patients (17 with cancer and 3 without cancer) acquired using a Philips Achieva 3.0T machine at Sunnybrook Health Sciences Centre, Toronto, Ontario, Canada. Institutional research ethics board approval for this study was obtained at Sunnybrook Health Sciences Centre. For each patient, the following MP-MRI modalities were obtained (Table 3.1): i) T2w, ii) DWI, and iii) CDI. The patients’ age ranged from 53 to 83. Table3.1 summarizes the information about the 20 patients’ datasets used in this research. MP-MRI imaging data were processed in the ProCanVAS (Prostate Cancer Visual Analysis System) plat-form developed jointly by Sunnybrook Research Institute, Toronto, ON, Canada and the
University of Waterloo, Waterloo, ON, Canada. The data set includes segmentation infor-mation to isolate the prostate, and ground truth data for tumour size and location. All imaging data were reviewed and marked as healthy and cancerous tissue by a radiologist with 18 and 13 years of experience interpreting body and prostate MRI, respectively, and the radiologists’ markings were confirmed by pathology data to be Gleason scores of 7 or above.
Table 3.1: Description of the prostate T2w, DWI, and CDI imaging data Modality DFOV (cm2) Resolution (mm3) TE (ms) TR (ms)
T2w 22×22 0.49×0.49×3 110 4,687 DWI 20×20 1.56×1.56×3 61 6,178 CDI 20×20 1.56×1.56×3 61 6,178
3.7
Experimental Setup
Each patient dataset had corresponding T2w images, ADC maps, CHB-DWI data, and CDI data. Using the radiologist contour of the prostate, a rectangle cropped around the prostate gland was selected as the region of interest (ROI) for each MRI slice. The performance of each method was evaluated using leave-one-patient-out cross-validation. A subset of the training texture features were randomly selected and used to train the classifier, and the voxels in a single MRI slice were classified as either healthy or cancerous tissue and assigned the saliency value of the nearest texture atom.
In addition, the number of texture atoms used to compute the spare texture model (as described in Subsection3.3) was varied to determine the optimal number of representative texture atoms for identifying suspicious regions in prostate MR images. The ADC-based method was compared against the proposed texture distinctiveness method (TD) via sen-sitivity, specificity, and accuracy metrics.
Sensitivity = T P P Specificity = T N N Accuracy = T N +T P N +P
where the performance of each method was quantified by the metrics’ closeness to one. TP is the number of voxels in the intersection of the identified cancerous tissue and the radiologist’s tissue segmentation, TN is the number of voxels not in the identified tissue that are also not in the radiologist’s segmentation, N is the number of voxels not in the radiologist segmented tissue and P is the number of voxels in the radiologist segmented tissue.
3.8
Experimental Results
The proposed textural distinctiveness method (TD) was evaluated using both four-atom and six-atom sparse texture models. Table 3.2 shows the performance metrics for the ADC-based method [1] and the proposed method. The testing data contained 52 tumours (as identified by an experienced radiologist) across the slices from 13 different patients. Table 3.2: Comparison of TD (trained with both 4 and 6 texture atoms) with ADC-based method [1]. TD has similar sensitivity values as the ADC-based method, and improved specificity and accuracy values.
Sensitivity Specificity Accuracy ADC-based method [1] 0.7911 0.7107 0.7115 TD (4 texture atoms) 0.8088 0.8285 0.8283 TD (6 texture atoms) 0.8103 0.8303 0.8301
As seen in Table3.2, the proposed TD method outperformed the ADC-based method [1] in terms of sensitivity, specificity, and accuracy. While there was only a relatively small in-crease in sensitivity (approximately 1.5%), TD demonstrated an increase of at least 10% in specificity and accuracy relative to the ADC-based method. This is especially beneficial, as a low specificity negatively impacts a diagnostician’s ability to perform quick and accurate assessments of MRI data. By increasing specificity, TD minimizes the number of wrongly detected regions that contain no tumour candidates. This is important for procedures such as radical prostatectomy where an extremely high specificity rate is required.
Figure3.2shows a visualization of the suspicious regions detected using the ADC-based method [1] and the proposed TD method using four and six representative texture atoms. While all methods identify the cancerous regions as suspicious, the ADC-based method in particular has a tendency to be over-sensitive and often identifies a large portion of the prostate tissue as suspicious. A visual inspection of the identified suspicious regions
shows that TD consistently produces spatially compact and useful regions regardless of the number of texture atoms.
3.9
Summary
A novel method was proposed to aid physicians in efficiently and accurately diagnosing patients via the identification of suspicious regions in prostate MR images. We extracted unique textural information from different MRI modalities, and used a sparse texture model to learn tissue texture characteristics. As the majority of prostate tissue is considered to be healthy, texturally distinct regions can be interpreted as suspicious due to the uniqueness and statistical occurrence of the corresponding cross-modality texture characteristics.
(a) (b) (c) (d)
Figure 3.2: Visual comparison of identified suspicious regions (shown in red) between (a) ADC-based method [1], (b) TD using four texture atoms, (c) TD using six texture atoms, and (d) radiologist segmented regions.
The proposed statistical textural distinctiveness approach (using four-atom and six-atom sparse texture models) was evaluated against the ADC-based method [1]. In both cases, statistical textural distinctiveness produced higher sensitivity, specificity, and accu-racy values than the state-of-art ADC-based method. In additional, statistical textural distinctiveness also identified suspicious regions on a per patient basis, rather than relying on a fixed ADC value characteristic of typical cancerous tissue (as is the case with the ADC-based threshold method). Thus, statistical textural distinctiveness shows potential for more flexible and visually meaningful identification of suspicious tumour regions.
Achieving a 1.5% sensitivity increase and a 10% specificity and accuracy increase over current the state-of-the-art method, the proposed statistical textural distinctiveness method shows potential for more visually meaningful identification of suspicious tumour regions and allows for more accurate tumour classification. Particularly noteworthy is the 10% specificity increase of the proposed statistical textural distinctiveness approach, as a high specificity is crucial for imaging-guided procedures such as biopsy or radical prostatectomy.
Future work includes the further investigation of additional MRI modalities, and the use of spatial consistency to enforce more compact identified suspicious areas. Applications include identifying suspicious regions for clinicians to better stream-line a patient’s diagno-sis, and automatically identifying regions of interest for computer-aided tumour detection methods. In the next chapter, a novel algorithm for prostate cancer tumour detection is presented.
Chapter 4
Tumour Detection in
Multi-Parametric Prostate MRI
In this chapter, the method for prostate tumour detection is presented. The quantita-tive radiomics-driven feature model is introduced in Section4.2, and the radiomics-driven conditional random field (RD-CRF) is formulated in Section 4.3. Experimental setup is outlined in Section 4.4, and results were obtained using the data previously described in Chapter 3. Experimental results are shown in Section 4.5, and detailed discussion of the results is presented in Section 4.6. A brief summary of the method and related future works are discussed at the end of this chapter.
4.1
Problem Formulation
Inspired by genetic profiling for cancer risk stratification (genomics), Khalvatiet al.[2] in-troduced comprehensive and quantitative radiomics feature models consisting of hundreds of radiomics features derived from MP-MRI data via feature selection and classification for the purpose of voxel-resolution prostate tumour detection. As the first voxel-level radiomics feature models based on MP-MRI data designed for prostate tumour characterization to be introduced, the results of the studies demonstrated the prognostic power of radiomics for the purpose of automatic voxel-resolution prostate cancer detection. Nevertheless, one limitation of such voxel-resolution radiomics-driven prostate tumour detection approaches is that they utilize the extracted quantitative radiomics features associated with individual voxels on an independent basis, and do not account for the interconnected tissue character-istics reflective of cancerous tumours. As such, the incorporation of additional information
regarding the spatial and radiomics feature relationships between voxels has significant potential for achieving a more reliable voxel-resolution radiomics-driven prostate cancer detection performance.
We propose a novel approach for automatic prostate cancer detection based on a radiomics-driven conditional random field (RD-CRF) framework. The proposed RD-CRF framework utilizes the quantitative MP-MRI radiomics feature model proposed in [2] and incorporates not only the spatial relationships between voxels, but the quantitative ra-diomics feature relationships between voxels into a conditional random field model. This facilitates for the enforcement of interconnected tissue characteristics reflective of cancerous tumours, thus better representing the actual cancerous tissue phenotype.
Here, we present the methodology and underlying principles of a novel method for auto-matic pixel-resolution prostate cancer detection via a radiomics-driven conditional random field (RD-CRF) framework. While existing prostate cancer detection methods can gener-ally identify tumours, these methods tend to identify regions that are sparsely distributed (as shown in Section 4.2) that are unrepresentative of typical cancerous tissue. As such, the proposed RD-CRF framework leverages the full set of pixel-level quantitative radiomics features and incorporates inter-pixel spatial and feature relationships via a conditional ran-dom field to detect tumours more reliably by taking into account the inter-connected tissue characteristics reflective of cancerous tumours.
An overview of the proposed framework for pixel-resolution prostate cancer detection is shown in Figure4.1. First, a large amount of quantitative radiomics features are extracted from MP-MRI data using a quantitative radiomics feature model. Second, a classifier trained using such quantitative radiomics features from training data is used to perform initial pixel-resolution cancer detection. A radiomics-driven conditional random field (RD-CRF) framework is then used to perform final pixel-resolution cancer detection using the initial results produced by the classifier and the full set of extracted quantitative radiomics features of the current patient case. The detailed methodology behind each step of the proposed framework is described below.
4.2
Quantitative Radiomics-driven Feature Model
First, the proposed framework incorporates the quantitative radiomics feature model pro-posed in [2], which was specifically designed for extracting a large number of quantitative radiomics features from MP-MRI data for the purpose of prostate cancer detection. Sets of 96 low-level radiomics features (4 from first-order and 72 from second-order statisti-cal features, 8 from Kirsch edge detection, and 12 from Gabor filters [2]) were extracted
Figure 4.1: The proposed framework for automatic voxel-resolution prostate cancer de-tection. A large amount of quantitative radiomics features are extracted from MP-MRI data using a quantitative radiomics feature model. A classifier trained using quantitative radiomics features from training data is used to perform initial voxel-resolution cancer de-tection. A radiomics-driven conditional random field (RD-CRF) framework is then used to perform final voxel-resolution cancer detection using the initial results produced by the classifier and the full set of extracted quantitative radiomics features of the current patient.
from each of following 8 different forms of MP-MRI data: i) T2-weighted (T2w) imag-ing data, ii) apparent diffusion coefficient (ADC) data, iii) computed high-b diffusion-weighted imaging (CHB-DWI) data, iv) correlated diffusion imaging (CDI) data, and v-viii) diffusion-weighted imaging (DWI) data acquired at 4 individualb-values (0, 100, 400, and 1000s/mm2). This results in a total of 768 features used within the comprehensive quantitative radiomics feature model that can better capture both healthy and cancerous tissue characteristics. A SVM classifier was then trained using quantitative radiomics fea-tures extracted from training data using this radiomics feature model, which can then be used to perform voxel-resolution classification on a new unseen patient case.
The MP-MRI modalities used in this radiomics feature model were selected based on their potential to separate cancerous from healthy prostate tissue. T2w imaging data
has been shown to provide some localization information for tumour candidates due to a small reduction in signal in the cancerous tissue [22]. Similarly, cancerous tissue in ADC data is typically represented by a darker intensity relative to surrounding tissue [27]. Previous research has shown that high-b values in diffusion weighted imaging data allows for increased delineation between cancerous and healthy tissue [28,30]. Lastly, CDI data takes advantage of joint correlation in signal attenuation across multiple gradient pulse strengths and timings to improve delineation between cancerous and healthy tissue [29,56]. One challenge with classifying tissues into cancerous and healthy as performed in exist-ing state-of-the-art voxel-resolution radiomics-driven cancer detection methods (e.g., [2]) is that the detected tumour candidates tend to be sparsely distributed across the prostate region (see Figure 4.2), leading to high false positive and negative rates. This sparsity is a result of existing approaches not taking into account inter-voxel spatial relationships and radiomics feature relationships between voxels, and results in situations where there are missing voxels within a tumour candidate, as well as scattered voxels that may be considered as cancerous voxels. As cancerous tissue tends to be localized to one or two regions of a prostate, and exhibit interconnected tissue characteristics, this motivates the use of a probabilistic radiomics-driven framework that better accounts for such character-istics to improve prostate cancer detection performance, which will be described in the next section. Therefore, the proposed framework incorporates cross-modality spatial pri-ors to enforce spatial relationships between voxels while maintaining relationships between cross-modality radiomic features.
Figure 4.2: Examples of tumour candidates detected by [2]. The identified regions (shown in red) are sparsely distributed across the prostate tissue, contrary to the compact regions characteristic of cancerous tissue.
4.3
Radiomics-driven Conditional Random Field
The theory behind the radiomics-driven conditional random field (RD-CRF) framework used to perform final voxel-resolution cancer detection based on the initial results pro-duced by the classifier and the full set of extracted quantitative radiomics features of the current patient case can be described as follows. Conditional random fields [32,35] were first proposed by Laffertyet al.[32] and have previously been used for image labelling [57]. The proposed RD-CRF model extends the conditional random field (CRF) model to lever-age the full set of voxel-level quantitative radiomics features derived from MP-MRI data while taking into account the spatial relationships and quantitative radiomics feature re-lationships between voxels to better enforce interconnected tissue characteristics.
Given the prostate MP-MRI data pertaining to the patient, the tumour detection prob-lem is formulated as the conditional probability of a set of binary labels (i.e., suspected prostate tumour or healthy tissue). The RD-CRF framework models the conditional prob-ability of the binary label fieldY and corresponding X observations as follows:
P(Y|X) = 1
Z(X)exp(−E(Y, X)) (4.1) whereZ(X) is the normalizing function andE(Y, X) represents the energy function factor-ized from different feature functions. The labelling problem of the prostate as healthy or cancerous is optimized using a Maximum A Posteriori (MAP) approach where minimizing the energy functionE(Y, X) produces the best classification of healthy tissue and tumour candidates:
Y∗ = arg min Y
E(Y, X) (4.2)
whereY∗ is the optimal solution given the patient’s MP-MRI. AsY∗ maximizes the prob-ability of healthy and cancerous tissue classification via the minimization of E(Y, X), the formulation of the energy function is crucial in obtaining an accurate binary label field.
E(Y, X) can be formulated as some combination of unary and pairwise potential func-tions, and is generally defined as:
E(Y, X) = n X i=1 ψu(yi, X) + X ϕ∈C ψp(yϕ, X) (4.3)
E(Y, X) incorporates the data-driven unary function ψu(yi, X) and the inter-voxel spatial and radiomic features-based pairwise functionψp(yϕ, X) into the model. In Equation 4.3,
yi ∈ Y is a single state in the set Y = {yi}ni=1 and represents the label of a single voxel in the binary label field. X = {xi}n
i=1 is the corresponding set of observations from the prostate MR-MRI data as represented by the quantitative radiomic features, and yϕ ∈ Y is the subset of labels (clique) in the surrounding neighbourhood. For each node i, there is a set of neighboursN(i):
N(i) = {j|j = 1 : n, j6=i} (4.4)
where|N(i)|was empirically chosen to be 24 (i.e., a 5×5 neighbourhood centred at node
i). The proposed RD-CRF framework uses a pairwise clique structure
C ={Cp(i)}ni=1 (4.5)
Cp(i) ={(i, j)|j ∈N(i)} (4.6)
to enforce the consistency of spatial and radiomics feature relationships in the identification of tumour candidates. Each node i represents a single voxel in a patient’s MP-MRI data, and N(i) represents the corresponding neighbouring axial voxels.
For the proposed RD-CRF framework, the results of the trained classifier are used as the data-driven unary termψu(.), while the pairwise term ψp(.) is factorized based on the set of clique structuresC for a pairwise clique c∈C.
By taking full advantage of the comprehensive set of 768 quantitative radiomics fea-tures extracted from the different MP-MRI modalities along with spatial and radiomics feature relationships within the RD-CRF framework, one can better characterize healthy and cancerous tissue phenotype and thus achieve improved final voxel-resolution cancer detection.
To obtain the final voxel-resolution tumour detection results, the energy functionE(Y, X) is minimized using gradient descent, and the binary label field is assigned to each voxel as
y∗ =
(
1 cancerous tissue
0 healthy tissue (4.7)
GraphG(V,E) is the realization of the proposed RD-CRF for an axial MRI slice, where
V is the set of nodes representing the states Y∗ = {0,1} and E is the set of edges of the graph.
Figure 4.3: Realization of proposed radiomics-driven conditional random field framework. For each node yi, there is a set of corresponding measurements as radiomic features xi. The connectivity between each pair of nodes yi and yj is represented by the solid red line
eij.
As shown in Figure4.3, each nodeyrepresents a single voxel and has a set of associated observations xi. Eachxi represents the set of quantitative radiomics features [2] calculated across all MP-MRI modalities for a given voxel. The edge eij is the connectivity between a pair of nodes, and represents the relationship between two voxels.
4.4
Experimental Setup
The experimental setup used to assess the efficacy of the proposed RD-CRF framework for voxel-resolution prostate cancer detection is described as follows. Using the data previously
described in Chapter 3, each patient dataset had corresponding T2w imaging data, ADC data, CHB-DWI data, and CDI data. For each modality, the testing data contained a total of 40,975 samples (40,369 healthy and 606 cancerous samples confirmed by the radiologist) across the slices from 20 different patients1. Using the radiologist contour of the prostate,
a rectangle cropped around the prostate gland was selected as the region of interest (ROI) for each MP-MRI slice.
The voxel-resolution cancer detection results produced by the proposed RD-CRF frame-work was compared with that produced using the state-of-the-art method proposed in [2] via sensitivity, specificity, and accuracy metrics (as shown in Chapter3), where the perfor-mance of each method was quantified by the metrics’ closeness to one. TP is the number of voxels in the intersection of the method’s identified cancerous tissue and the voxels con-tained in the radiologist’s tissue markings, TN is the number of voxels not in the method’s identified tissue that are also not in the radiologist’s markings, N is the number of voxels not in the radiologist’s marked tissue, and P is the number of voxels in the radiologist’s marked tissue.
In addition, the Jaccard index [58] and Sørensen–Dice coefficient [59] were used to compute the overlap between the radiologist’s marked tissue and the voxel-resolution cancer detection results produced by the proposed RD-CRF framework and the state-of-the-art method proposed in [2].
Jaccard = |A∩B|
|A∪B| Sørensen–Dice =
2|A∩B| |A|+|B|
where A is the set of voxels contained in the method’s identified cancerous tissue and
B is the set of voxels contained in the radiologist’s tissue markings. The performance of each method was evaluated using leave-one-patient-out cross-validation, with training radiomics features were selected from all but one patient and used to train the classifier, and the voxels in the remaining patient’s MRI dataset were classified as either healthy and cancerous tissue.
1To balance the training data in terms of number of healthy and cancerous samples, when training the SVM classifier, smaller subsets of healthy samples are randomly selected to be the same size as the cancerous samples and this is repeated 50 times and the classification results are averaged. This way, the training data used for training SVM classifier becomes 50%−50% leveled with respect to cancerous and healthy samples [2].
4.5
Experimental Results
Table 4.1: RD-CRF performance and Khalvatiet al. [2] performance metrics for different numbers of cases. Statistical significance is shown across all performance metrics (p-values below 0.05).
Sensitivity Specificity Accuracy Jaccard Sørensen– Dice
[2] 70.21% 91.38% 90.59% 26.64% 37.12%
RD-CRF 71.47% 91.93% 91.17% 28.56% 39.13% p-value 0.0413 0.000293 0.000163 0.0217 0.0312
Table4.1show the average sensitivity, specificity, accuracy, Jaccard index, and Sørensen– Dice coefficient for the proposed RD-CRF and Khalvatiet al. [2] across all patients. The proposed RD-CRF method shows significantly improved (p-values <0.05) for all metrics. Table 4.2 shows the improvement of the proposed RD-CRF framework with respect to [2] for different cases starting with 5 worst cases for sensitivity obtained by [2]. As it can be seen from Table 4.2, for the first 5 worst cases, the proposed RD-CRF framework improved sensitivity by 3.2%. When all 20 cases were taken into account, the proposed RD-CRF framework improved sensitivity, specificity, and accuracy by 1.10%, 0.55%, and 0.59%, respectively. Given that [2] already achieved high specificity rates (e.g., 92%), the proposed RD-CRF framework was only able to improve it slightly (0.59%).
Figure4.4shows the improvement in sensitivity and specificity obtained by the proposed RD-CRF framework when compared to [2]. Figures4.5 and4.6 show the actual sensitivity and specificity numbers for [2] and the proposed RD-CRF framework.
The fact that the proposed RD-CRF framework increased the sensitivity, specificity, and accuracy of [2] indicates that taking into account inter-voxel spatial and radiomics feature Table 4.2: RD-CRF performance improvement with respect to [2] for different numbers of cases.
Cases/Results Sensitivity Specificity Accuracy 5 cases 3.20% 0.52% 0.61% 10 cases 1.41% 0.55% 0.60% 15 cases 1.50% 0.48% 0.53% 20 cases 1.10% 0.55% 0.59%
relationships helps noticeably in mitigating the identification of sparsely distributed tumour candidates and thus improving prostate cancer detection performance. Figure 4.8 shows examples of how the proposed RD-CRF framework mitigates sparsely distributed tumour candidates while promoting consistency in spatial and radiomics feature relationships to ensure the identified tumour candidates better reflect cancerous tumours.
Figure4.8 shows the prostate tumour candidates detected using [2] and that detected using the proposed RD-CRF framework in comparison to the radiologist’s markings. Fig-ure4.7shows sample results for [2], RD-CRF, and the radiologist’s markings along with the corresponding pathology data. The pathology data indicates additional smaller tumours present in the prostate tissue. While [2] and the proposed RD-CRF framework failed to detect these small areas of cancerous tissue, the radiologist’s markings also did not identify these small tumours, which illustrates that such small areas of cancerous tissue may not exhibit significantly distinctive image-based features in the MP-MRI data.
Figure 4.4: RD-CRF performance improvement in sensitivity (shown in red) and speci-ficity (shown in blue) compared to [2]; the graph shows the percent improvements in both sensitivity and specificity for different numbers of cases.
Figure 4.5: RD-CRF sensitivity (shown in blue) for different number of cases compared to [2] (shown in red).
Figure 4.6: RD-CRF specificity (shown in blue) for different number of cases compared to [2] (shown in red).
![Figure 3.2: Visual comparison of identified suspicious regions (shown in red) between (a) ADC-based method [1], (b) TD using four texture atoms, (c) TD using six texture atoms, and (d) radiologist segmented regions.](https://thumb-us.123doks.com/thumbv2/123dok_us/434406.2550171/37.918.123.810.481.921/figure-visual-comparison-identified-suspicious-regions-radiologist-segmented.webp)