Tracking Influence and Opinions in Social Media
Akshay Java
Abstract
These days Social Media such as forums, wikis and blogs in particular are playing a notable role in influencing the buying patterns of consumers. Often a buyer looks for opinions, user experiences and reviews on such sources before purchasing a product. Detecting influential nodes and opinion leaders and understanding their role in how people perceive and adopt a product or service provides a powerful tool for marketing, advertising and business intelligence. This requires new algorithms that build on social network analysis, community detection and opinion extraction.
Studies on influence in social networks and collaboration graphs have considered a static view of the network and are based purely on link analysis. These techniques have been found to be effective in performing analysis at an aggregate level and to identify key individuals who play an important role in propagating information. However, in-fluence on the Web is often a function of topic. A blog like Daily Kos that is influential in politics is less likely to have an impact on the technology related blogs. Similarly, Techcrunch, an extremely popular technology blog might not be influential when it comes to politics. We propose the notion of ‘topical influence’ and extend existing techniques to make them topic sensitive.
An important component in understanding influence is to detect sentiment and opinions. Changes in opinions, aggregated over many users, can be a predictor for an interesting trend in a community. Sufficient adoption of this trend could lead to a ’tipping point’ and consequently influencing the rest of the community. Strong opin-ions over time indicate biases. It is important to model bias to target the right audience for marketing and advertising. A community of ipod fanatics for example, needs little or no convincing about the product. Influencing an opinion leader in such already posi-tively biased communities is going to have less significant impact for the product. Here we also describe BlogVox, a blog analytics system that we developed for TREC opin-ion retrieval task. This system finds opinopin-ionated blog posts about a topic. We propose to extend this system to track aggregated opinions over many users.
Finally, we propose to model influence as a temporal phenomenon. The Blo-gosphere, being a buzzy and dynamic environment, has new topics emerging constantly and blogs rising and falling in popularity. Tracking these changes over time allows us to find blogs that are influential versus something that is just briefly popular. For ex-ample, many thousands of sites linking to a ‘Coke Mentos’ video in one day indicates popularity. But thousands of links accumulated consistently over time by a blog in-dicate that it is influential. Additionally, by studying how a meme spreads, we can identify key individuals that are either buzz generators or early adopters who create sufficient interest on the topic.
In this thesis we develop an improved influence model that includes components for community structure, topic categorization, representation of key beliefs and opinions, and a temporal analysis of how these change. We show that his model outperforms existing, simpler models by evaluating its precision and recall for appropriate tasks.
Contents
1 Introduction 3 2 Research Objectives 6 2.1 Thesis Statement . . . 6 2.2 Contributions . . . 6 2.3 Scope . . . 73 Structure of the Blogosphere 8 3.1 Blogosphere Infrastructure . . . 8
3.2 Blogosphere as a Graph . . . 10
3.3 Link Analysis on Blogs . . . 12
3.3.1 Ranking Algorithms . . . 12
3.3.2 Community Detection . . . 12
3.4 Content Analysis on Blogs . . . 13
3.4.1 Linguistic Analysis . . . 13
3.4.2 Splog Removal . . . 16
3.4.3 Post Content Analysis . . . 16
4 Influence Models 17 4.1 Introduction . . . 17
4.2 Link-based Measures . . . 18
4.2.1 Cascade Models . . . 18
4.2.2 Evaluation . . . 20
4.3 Readership based Influence Measures . . . 23
4.3.1 Dataset Description . . . 24
4.3.2 General statistics . . . 24
4.3.3 Topic Representation and Clustering . . . 28
4.3.4 Applications . . . 32
4.4 Discussion . . . 37
5 Opinion Extraction 41 5.1 Introduction . . . 41
5.2 BlogVox: Seperating Blog Wheat from Blog Chaff . . . 42
5.2.2 Pre-indexing Processing . . . 42
5.2.3 Post-retrieval Processing . . . 43
5.2.4 Data Cleaning . . . 44
5.2.5 Identifying Post Content . . . 47
5.3 Evaluation . . . 49
5.3.1 Splog Detection Evaluation . . . 49
5.3.2 Post Cleaning Evaluation . . . 50
5.3.3 Trec Submissions . . . 54
5.4 Discussion . . . 54
6 Proposed Model and Evaluation Methodology 56 6.1 Proposed Approach . . . 56
6.1.1 Influence Model . . . 56
6.2 Evaluation Methodology . . . 58
7 Research Timeline 60
Chapter 1
Introduction
Social Media is a dynamic and growing area that includes a collection of blogs, wikis, forums, photos and videos sharing sites. According to wikipedia1
“social media describes the online tools and platforms that people use to share opinions, insights, experiences, and perspectives with each other”
Opinions and views expressed in such medium are often instrumental in a customers buying decisions. In this work, we describe automated techniques to model, measure and identify influential individuals and their opinions.
Social Media sites are sometimes also referred to as Web 2.0. Web 2.0 was a term coined by O‘Rielly Media [55] to describe the emerging genre of next-generation internet sites. A typical characteristic of these Social Media sites is the high level of user participation. Using comments, trackbacks, folksonomies and underlying social networks, these sites allow users to actively participate in conversations and easily share information with others.
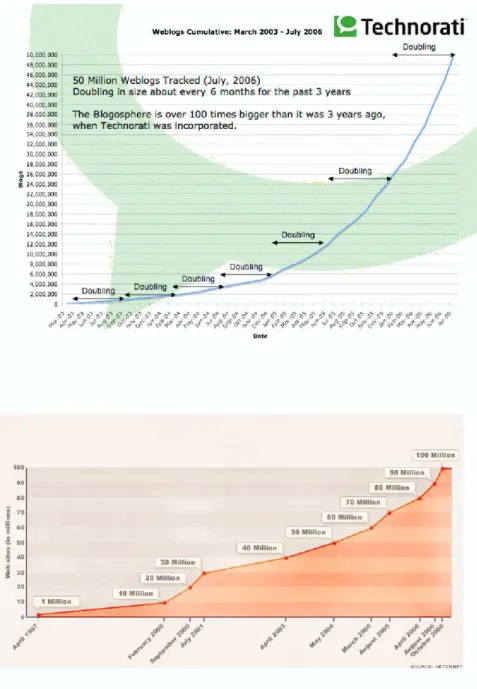
A primary component in the Social Media landscape are blogs. Weblogs or blogs started initially as online diaries or journals. Today, blogs are used for a wide variety of purposes. Typically it is a means of content publishing and a place where people share their views, opinions or experiences. There has been a phenomenal growth of the Blogosphere. Presently there are close to 52 million blogs, they are doubling ap-proximately every six months [61]. Blogs have become a means by which new ideas and information spreads rapidly on the web. They often discuss the latest trends and echo with reactions on different events in the world. The collective wisdom present on the blogosphere is invaluable for market researchers [17, 58] and companies launching new products.
In fact, advertisers are already realizing the potential of blogs in influencing buy-ing decisions of their target audience. Often when a buyer is interested in purchasbuy-ing a product, blogs offer free and frank customer reviews. As Robert Scooble puts it “blogging is one huge word-of-mouth engine” [60]. Forster Research [13] projects a sustained growth in advertising and marketing spending from around $14.7 billion in
2005, to about $26 billion by 2010 (in US alone). According to this survey, 64% of the advertisers are interested in advertising on blogs.
Many startups have pitched pre-launch and beta version of their products to vari-ous bloggers with the hope that their reviews would create a buzz on the blogosphere and bring more attention to their company. Microsoft recently launched the Origami tablet PC amongst speculations that the hype was generated by a targeted campaign to a selected set of bloggers. Companies like Wal-mart are now trying to win back pub-lic opinion on their corporate popub-licies by providing bloggers with exclusive news and inviting them for visits [7]. Even the US Department of Defense is now reaching out to hundreds of bloggers with more information about its counter-terrorism initiatives [25]. Recently, it has also become a common business practice to maintain a corporate blog and a number of the Fortune 500 companies claim to have a corporate blog [5]. This trend is changing how companies engage with their clients.
The Blogosphere provides a unique resource for studying information flow in on-line Social Media. At the same time it is also possible to monitor the trends and opin-ions that are being expressed online. The dynamic nature of the Blogosphere, the abundant user-generated content and complex social structure pose interesting ques-tions. The main focus of this thesis is to study and characterize the nature of influence and opinion formation in online social media.
Consider that your goal was to market Microsoft’s new MP3 player Zune, the new rival to Apple’s hugely popular Ipod. One of the first things to do would be to monitor the space of consumer electronics. This can be done at a meta-level by using some of the trend analysis available trend analysis tools. There are many online services like Blogpulse2and Google Trends3that allow users to track ’buzz’ and generate alerts for different keywords. This gives an aggregate picture of the popularity for the term based on the volume of online chatter. Recently there has been an interest in mining such trends to predict the success of movies [16] and the sales of books [50, 19]. However, using trend analysis alone, gives a partial view of the market and one can not make a judgment about the sentiment of the customers. A large volume in online chatter about the latest blockbuster need not be an accurate predictor of sales. While there might be many people talking about a particular movie, the overall sentiment could be negative. This underscores the importance of opinion extraction in such situations. We describe BlogVox [27], a system for monitoring the Blogosphere to find opinionated posts.
Next, we would like to identify online communities of users that talk about the different portable music devices. On the Web, a community is usually defined as a set of pages that have a greater probability of linking within the set versus outside it. Detection of such communities allows the advertiser to market a product to the right
set of audience. In comparison advertising programs such as Google Adsense work
by matching documents with keyword specific advertisements. While such systems cast a wider net, it is also useful to have a targeted marketing strategy. To this effect, we describe two ways to model communities on the Blogosphere: readership based and network based. Using the readership information from a popular blog reader, we extract groups of blogs that are in the same community. In addition we use standard
2http://www.blogpulse.com 3http://www.google.com/trends
network analysis tools such as distance-based clustering and graph partitioning to ex-tract communities of blogs. The exex-tracted communities are used to perform further analysis to extract specific individuals who are influential.
While there is little consensus amongst researchers on how influence can be de-fined, we consider influence as:
The ability of a blogger to persuade another blogger or a reader to
• take an action by means of writing a new post about the topic.
• quote the blogers comments in his own post.
• link to the originating blog by means of comments or trackbacks.
• link to the blog post/blogger through other means such as delicious links, blogrolls, etc.
Identifying the influence network and knowing who the key players are and who is already on board can be a powerful tool for marketing a product.
In this work we describe techniques to model influence based on direct measur-able properties of a blog. We describe ways to automatically identify opinions and model bias of the blogger with respect to a product or a topic and measure its effect by identifying the community it influences.
The proposal is organizes as follows: Chapter 2 formalizes the research objectives and the proposed thesis. We also specify the key contributions that would be achieved and the scope of this work. Chapter 3 describes some of our preliminary study into the structure of the Blogosphere. Understanding the structure of the Blogosphere is essential to be able to leverage existing techniques from the research in Web graphs and also helps understand the differences that need to be addressed. In Chapter 4 we describe some of the existing approaches to modeling influence and provide a novel technique that uses readership information rather than graph approach. Next, Chapter 5 describes an opinion retrieval system that was used as part of the TREC conference. This system is being developed to identify opinions and biases of the bloggers. Finally, in Chapter 6 we describe some of the ideas for the proposed approach and evaluation criteria. Chapter 7 describes the proposed timeline and the possible milestones for this work. Finally, we conclude by providing a discussion of the broader implication of this work.
Chapter 2
Research Objectives
2.1
Thesis Statement
An accurate model of influence on the blogosphere must analyze and combine many contributing factors, including topic, social structure, opinions, biases and time. We will develop, implement and experimentally evaluate such a model to demonstrate its improved accuracy over models based on any one of these factors.
2.2
Contributions
The following are the main contributions of this work:
• First we aim to characterize influence and study what makes a blog or an indi-vidual influential. In effect, by understanding the constituents and dynamics of influence we aim to effectively measure it.
• We provide a new approach to model influence in real-world, large-scale scenar-ios using blog data as our testbed. Such a model would incorporate topics and opinions which would provide a better representation of influence.
• We develop novel techniques to model communities using readership informa-tion and compare it with link-based community extracinforma-tion.
• We develop a system to detect and extract opinions from blog posts. We describe a novel technique to extend influence model to incorporate link polarity. By monitoring opinions over a period of time we can accurately map it to biases and beliefs of a blogger.
• Our hypothesis is that to model influence we need to combine many contributing factors like topic, social structure, opinions, biases and time. As part of this research we will aim to test this hypothesis and experimentally validate the effect of each of these.
2.3
Scope
The scope of this work overlaps with some areas of social sciences, where researchers worked towards understanding how human society functions. Some researchers in social science [40] as well as computer science have developed theories of individual behavior in real world organizations and that of agents in artificial societies and multi-agent scenarios[15]. While we draw and expand on the body of literature available in these fields, we limit the scope to understanding influence in online media.
With advances in opinion mining and social network analysis, in recent times there have been concerns about the negative consequences of influencing the influencers. While we understand that these are valid concerns, we feel that there are positive ben-efits of such applications can be helpful in understanding the markets, or sentiments of people in other countries a government policy. We limit our scope to the study of opinion extraction and influence propagation.
Chapter 3
Structure of the Blogosphere
This section describes the basic infrastructure of the Blogosphere and discusses certain key differences of blog content from Web documents.
3.1
Blogosphere Infrastructure
In terms of size, though it constitutes only for a portion of the whole Web, the Blo-gosphere is already quite significant and is getting increasingly bigger. Presently there are close to 52 million blogs and are rapidly doubling every six months and a large frac-tion of these blogs are active. Blogs are typically published through blog hosting sites or tools like wordpress that can be self-hosted. An entry made by a blogger appears in a reverse chronological order. Whenever a new post is published, a ping server is notified of the fresh content. Infrastructurally, this is one of the critical difference from the Web. While on the Web, search engines rely on crawlers to fetch and update the index with new content, the stream of pings provides information that new content has been published on a blog. This is done essentially to ensure that downstream services (like search engines and meme trackers) can quickly find new content, thus ensuring the freshness of their index.
The blog home page can contain various anchortext links that provide personal information, links to recent posts, photos, blogrolls (links to blogs frequently read), delicious bookmarks, FOAF descriptions etc. Each blog post contains a title, date, time and the content of the post. Additionally, posts can also be assigned tags or categories that provide information about the topic or keywords that are relevant to the post. This form of meta-data information or folksonomies have been popularized by sites like delicious1 and flickr2 and provide a way for users to conveniently organize content. Finally the blog itself can be subscribed via RSS (Really Simple Syndication) feeds. Through this simple XML formatted file, users can subscribe to blogs, news sites and also personalized content such as alerts and search results.
1http://del.icio.us 2http://www.flickr.com
Figure 3.1:The blogosphere continues to double every six months. This increase has also contributed to the growth of the Web in general (sources: Technorati, Netcraft, CNN)
Figure 3.2:A number of companies are now providing blog analytics tools and ‘brand monitoring’ tools.
The current trends are only indicators of sustained growth in user-generated con-tent. As this space becomes larger, there is an increasing need to develop tools and techniques that can help keep tabs on the ’pulse of the Blogosphere’. Figure 3.2 sum-marizes some of the commercial vendors in this space.
3.2
Blogosphere as a Graph
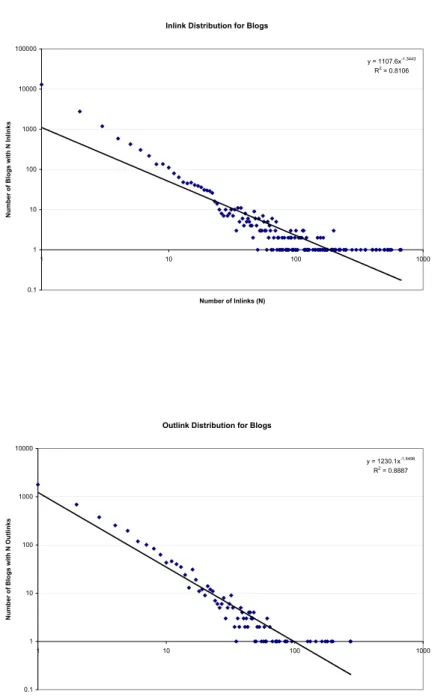
A number of researchers have studied the graph structure of the Web. According to the classic ‘Bow Tie’ model [9] the WWW exhibits a small world phenomenon with a relatively large portion of links constituting the core or Strongly Connected Component (SCC) of the graph. Ravi Kumar et. al. [38] have studied the evolution of the blog graph and find that the size of the Blogosphere grew drastically in 2001. They find that at a microscopic level there was also emergence of stronger community structure. Using a graph represented by the link structure of the blog post to blog post links from a collection of about 3 Million blogs we find power law distributions for both the inlink and outlinks in the graph (see Figure 3.3). Similar results were also discussed in [20] while studying how topics propagate on the Blogosphere. Herring et al. [23] performed an empirical study the interconnectivity of a sample of blogs and found conversations more concentrated to a subset of bloggers known as a-listers.
Inlink Distribution for Blogs y = 1107.6x-1.3443 R2 = 0.8106 0.1 1 10 100 1000 10000 100000 1 10 100 1000 Number of Inlinks (N) N um be r of B logs wit h N Inlink s
Outlink Distribution for Blogs
y = 1230.1x-1.5496 R2 = 0.8887 0.1 1 10 100 1000 10000 1 10 100 1000 Number of Outlinks (N) Num ber of Blogs with N Outlinks
3.3
Link Analysis on Blogs
3.3.1
Ranking Algorithms
While there are a number of ranking techniques for the Web, many blog search engines still use inlink counts for a post or a blog as a measure of ‘authority’. Such metrics are at best a measure of popularity, nevertheless they remain in practice today. The PageRank algorithm works by simulating a random walk by a user who follows a link with probability q and jumps to a random section of the web graph with probability of (1-q). IfC(a)is a set of outlinks for page a andPi..Pn are the pages pointing to a. Then P R(a) =q+ (1−q) n X i=1 P R(pi)/C(pi)
One advantage of the pagerank algorithm is that it is relatively less expensive to com-pute and has fast convergence.
Another ranking scheme used is HITS [31] which assigns a hub and authority score. A good hub is one that points to a number of authoritative sources, while a good au-thority is one that is pointed to by many hubs. H(p)= hub value of the page p and
A(p)= authority value of a page p.
Authority(v) = X v∈S,v→p Hub(p) And Hub(p) = X v∈S,p→v Authority(v)
Similarly, for the Blogosphere, Adar et al. [3] have proposed a variation of PageR-ank, called iRPageR-ank, described to rank blogs based on their informativeness. In this scheme, each directed edge is assigned a weightWij = w(∆dij)where∆drefers to the time difference between the blogs citing a URL andw(∆)is the weight function that gives importance to URL citations which are closer in time. The edge weights are then normalized and PageRank computation follows. This weighted graph is called the
implicit information flow graph. iRank makes use of the temporal nature of blogs by
differentially weighing each citation in the graph by the time difference between when the blog mentions a URL and how soon it is referenced by other blogs.
3.3.2
Community Detection
Social structure in any society emerges from our desire to connect with others around us who share similar views and interest. Communities emerge in many types of net-works. Starting with Milgram’s experiments [48] that led to the popular anecdote on the ‘six degrees of separation’, the study of the underlying structure and properties has interested researchers for many years. Many real world networks like collabora-tion/coauthor [51], biological networks [64] and internet exhibit the small-world phe-nomenon.
Flake et. al. [1] describe a network flow based approach to partitioning the graph into communities. Recently, there has been renewed interest in community detection for blog data. Lin et. al. [43] identify a group of blogs that are mutually aware of each other. Post-to-post links, comments, trackbacks, all constitute to different types of actions that indicate awareness. Using an algorithm similar to PageRank each pair of blogs is weighted with an association score based on the different actions between the corresponding blogs. However, this technique requires a seed set of blogs to extract the community. Additionally, they provide a clustering algorithm to visualize such communities [62].
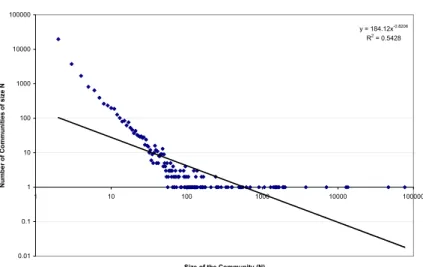
Some community detection techniques require computation of “betweenness cen-trality” which is an expensive calculation over very large graphs [53]. Betweenness centrality is a measure of the number of times a node is on the shortest path route amongst all other pairs of nodes. Newman provides a fast approximation [52] to this measure. Using their algorithm we have extracted some of the communities from the WWW 2006 dataset. Figure 3.4 shows the distribution of community size in this set. It can be observed that there are a number of small communities. Smaller communities are those that are extremely narrow in their topic or are a group of blogs of friends linked to each other. Most of the popular blogs tend to be in the large community of forming the core of the Blogosphere. By analyzing one such community we find that there are a large number of interconnected political blogs. Figure 3.5 shows a visual-ization of this graph. The size of the node is proportional to the degree of the blog.
3.4
Content Analysis on Blogs
Blogs, tend to be informally written, poorly structured, prone to spelling and gram-matical errors, and feature non-traditional content. In addition, performing linguistic analysis on blogs is plagued by two new problems: (i) the presence of spam blogs and spam comments, and (ii) extraneous non-content including blog-rolls, link-rolls, and advertisements. In Chapter 5 we describe useful techniques designed to eliminate noisy blog data by sharing our experiences with BlogVox - a blog analytics engine we developed for TREC. Our findings underscores the importance of removing spurious content from blog collections.
3.4.1
Linguistic Analysis
Traditional natural language text processing systems are usually applied to tasks with high quality text. In practical environments, including online chat, SMS message, email messages, wiki pages and blog posts NLP systems are less effective. Blog posts are noisy, ungrammatical and poorly structured text and which make it difficult to process even using information extraction tools and shallow parsers. The main reason for this is the dependence of such tools on capitalizations and proper sentence bound-ary detection. In addition the extensive use of slangs and neologisms in blogs makes it difficult for NLP tools to extract useful information. In some of the related work, RSS feeds from news sources have been somewhat easier to process using OntoSem, a
Distribution of Community Size y = 184.12x-0.8206 R2 = 0.5428 0.01 0.1 1 10 100 1000 10000 100000 1 10 100 1000 10000 100000
Size of the Community (N)
N u m b e r o f C o m m u n it ie s o f s iz e N
Figure 3.4:The graph shows the distribution of the size of the communites extracted from a Blog graph. There are a few very large communities, while most of the graph contains smaller communities typical of a power law distribution.
Figure 3.5: A view of a sub-community containing a number of political blogs consisting about 13K vertices. The size of the node is proportionate to its degree.
sophisticated ontological-semantics-based NLP system [26]. However, our experience is that large scale linguistic processing of blog data is more difficult.
3.4.2
Splog Removal
Recently, Spam blogs, or splogs have received significant attention, and techniques are being developed to detect them. [34] have recently discussed the use of machine learning techniques to identify blog pages (as opposed to other online resources) and to categorize them as authentic blogs or spam blogs (splogs). [36] extends this study by analyzing a special collection of blog posts released for the Third Annual Workshop on the Weblogging Ecosystem held at the 2006 World Wide Web Conference. Their findings on spam blogs confirms the seriousness of the problem. In our work we use some of their proposed techniques for data cleaning and minimizing the effect of splogs in our algorithms.
3.4.3
Post Content Analysis
The very nature of blogging platforms poses an important challenge. The blog hosting tools provide a number of structural and formatting elements that help provide informa-tion and share content. Blog owners promote friends, products, services and often their own posts by featuring them on blog-rolls and link-rolls that are often replicated across the entire blog. Such extraneous content makes it difficult for text analysis tools to analyze blogs. Spam blogs, spam comments and extraneous content indexed by a blog processing system put an unnecessary strain on the computational infrastructure, and ultimately skew results of blog analysis. To some extent this problem is alleviated by the use of RSS syndication. However, not all of the blogs use full syndication. Hence some of the search engines and other tools need to still parse or scrape content from homepages and permalinks. We describe novel techniques that use simple heuristics and and machine learning to filter extraneous links to identify the actual content of the post.
Chapter 4
Influence Models
4.1
Introduction
Research in the area of information propagation was inspired by a large body of work in disease and epidemic propagation. As described in [20] this model applies well in the Blogosphere where a blogger may have a certain level of interest in a topic and is thus
susceptible to talking about it. By discussing the topic he/she may infect others and
over time might recover. The authors use this approach in characterizing individuals into various phases of a topic in which they are more likely to become infected. They model individual propagation and use an expectation maximization algorithm to predict the likelihood of a blogger linking to another blogger. They also study the different types of topics present in the dataset and describe an approach to categorize topics into subtopics. Certain topics are more infectious than others and spread through the social network of bloggers. Automatically predicting such topics and developing models to accurately identify the propagation patterns on the Blogosphere is the main focus of this work.
Since bloggers are constantly keeping abreast of the latest news and often talk about new trends before they peak, recent research has focused on extracting opinions and identifying buzz from blogs [17]. Gruhl et al. [19] have found strong correlation be-tween spikes in blog mentions to Amazon sales ranks of certain books. More recently, Lloyd et al. [45] found similar trends for named entities in blog mentions and RSS news feeds.
Blogs are often topical in nature and their link structures constantly evolve as new topics emerge. Ravi et al. [38] study the word burst models [32] and community structure on the Blogosphere [39]. They find a sustained and rapid increase in the size of the strongly connected component on the Blogosphere and explain that the community structure is due to the tendency of the bloggers to topically interlink with posts on other blogs.
4.2
Link-based Measures
The link-based analysis in this section is based on the problem posed by [58] and influence models proposed by [30, 29]. These models aim to mathematically simulate the spread of information in social networks. Kempe et al. proposed an approximation of the NP-Hard problem of identifying a set of influential nodes to target so that we can maximize the number of nodes that are activated or influenced. We use the basic
Linear Threshold Model as proposed by Kempe et al. While the original models were
validated on citation graphs, which are much smaller, we apply these algorithms on graphs derived from links between blogs. The citation graphs tend to be much cleaner and some of the techniques proposed do not apply well in the presence of splogs. We also discuss the applicability of simpler, PageRank-based heuristics for influence models on the Blogosphere and the web in general.
Bloggers generally tend to follow mainstream media, the Web, and also blog posts from people who may share similar interests. When an interesting meme emerges on some site, a blogger may choose to share it with his audience. Additionally, he may provide more insights and trackback to other sources of similar information. Other readers may comment on this post and thereby contribute to the conversation. Such an interactive process leads to the flow of information from one blogger to another. In approximating this interaction, we consider the presence of a link from site u to site
v as evidence that the site u is influenced by site v. We consider only outlinks from
posts and do not use comment links or trackback links for building the blog graphs. we take a rather simplistic view in the influence models and convert the blog graph to a directed influence graph. Figure 4.1 shows a hypothetical blog graph and its corre-sponding influence graph. An influence graph is a weighted, directed graph with edge weights indicating how much influence a particular source node has on its destination. Starting with the influence graph we aim to identify a set of nodes to target a piece of information such that it causes a large number of bloggers to be influenced by the idea.
4.2.1
Cascade Models
Different influence models have been proposed [29, 30]. The two general categories are Linear Threshold Model and Cascade Model. We describe some of these below: In the basic Linear Threshold Model each node has a certain threshold for adopting an idea or being influenced. The node becomes activated if the sum of the weights of the active neighbors exceeds this threshold. Thus if node v has thresholdθvand edge weightbwvsuch that neighbor w influenced v, then v becomes active only if
X w active neighbors of v bwv≥θv and X bwv≤1
Another model is the Independent Cascade Model in which a node gets a single chance to activate each of its neighboring nodes and it succeeds with a probabilityPvwwhich is independent of the history.
Blog Graph Influence Graph 4 3 2 1 5 4 3 2 1 5 2/5 1/5 2/5 1/3 1/3 1/3 1 1/2 1/2 1
Figure 4.1: This diagram shows the conversion of a blog graph into an influence graph. A link from u to v indicates that u is influenced by v. The edges in the influence graph are reverse of the blog graph to indicate this influence. Multiple edges indicate stronger influence and are weighed higher
As described in the above model, we rank each directed edge between u, v in the
Influence Graph such that the presence of multiple directed edges provides additional
evidence that node node u influences node v. IfCu,vis the number of parallel directed edges from u to v the edge weight
Wu,v=Cu,v
dv
wheredvis the indegree of node v in the influence graph.
Since computing the optimal value of expected size of the influenced set, σ(A), remains an open question, the algorithm runs the influence propagation model for pseudo-random threshold values and computes the approximate size ofσ(A).
In selecting the order of activation of nodes, the simplest ranking scheme is one using the number of inlinks (which corresponds to the outlinks in the influence graph). This represents how many other nodes can be influenced by activating the selected node. We also explored PageRank [56] as a heuristic in selecting the target set.
Finally we compare these heuristics with the greedy hill climbing algorithm. In the greedy approach nodes are incrementally added to the initial activation set without backtracking. At each time step, the influence model is run and a node is selected to be added to the initial target set. The node is selected such that adding it to the target set would provide the largest locally optimal increase in the size of the influenced node set.
Other methods such as “distance centrality” based heuristic are also widely used in many studies. This however could not be applied to the blog dataset since computing
the centrality scores over large graphs is expensive without partitioning or identifying subgraphs.
4.2.2
Evaluation
The following section describes some of the experiments and results.
Weblog Dataset The dataset released by Intelliseek/Blogpulse1for the 2006 Weblog-ging Ecosystems Workshop consists of posts from about 1.3 million unique blogs. The data spans over 20 days during the time period in which there were terrorist attacks in London. This time frame witnessed significant activity in the Blogosphere with a number of posts pertaining to this subject. The link graph that we extracted from this dataset consists of 1.2 million links among 300K blogs. However it was also observed that Livejournal2 sites tend to be highly interlinked and hence for the purpose of the influence models presented in the following sections, we do not consider blogs from these sites for inclusion in the initial activation set. However, we do not discard the blogs from the link graph.
In addition to the Blogpulse dataset we have used the publicly listed feed sub-scriptions from 82,428 users which consisted of 2,786,687 feeds in all, of which about 496,893 are unique. Bloglines allows users to organize their subscriptions in folders. Although only 35% of Bloglines subscribers use this feature, it provides substantial data to categorize the feeds into different topics.
Effect of Splogs Firstly we investigate the influence of splogs on the different rank-ing schemes. Splogs are identified usrank-ing a supervised learnrank-ing with Support Vector Machines as described in [35]. Figure 4.2 shows the distribution of the splogs in the top results as ranked by PageRank, HITS and Indegree heuristic. From this graph we can observe that the indegree and HITS based heuristics were subject to being easily spammed. As described in [65] the HITS algorithm is susceptible to spamming and this is particularly true in presence of Tightly Knit Communities which have been pro-posed by [8] and also studied by [41]. Other variations of the HITS algorithm attempt to solve this problem, however it was interesting to note that this issue, though may have already been seen in the case of web spam, is also true for the blog domain. How-ever, PageRank was found to be much resilient to splogs. In order to further investigate this, we analyze the link types. Table 4.1 shows the different types of links in the graph. From this, we can observe that splogs generally tend to link to other splogs. Thus in-dicating that there is a presence of a community structure in splogs. However splogs also link to legitimate blogs, which most often are high ranked or popular pages.
Node selection heuristics We run the influence models using different heuristics such as PageRank, indegre and greedy algorithm. In PageRank and indegree the nodes are added to the initial target set in the order of their rank. Once a node is selected, the influence model is run and nodes are activated depending on their threshold. The
1http://www.blogpulse.com 2http://livejournal.com
Figure 4.2:Percentage Splogs in PageRank, HITS, Indegree. The above graph shows what percentage of the top N results in each of the ranking schemes are splogs.
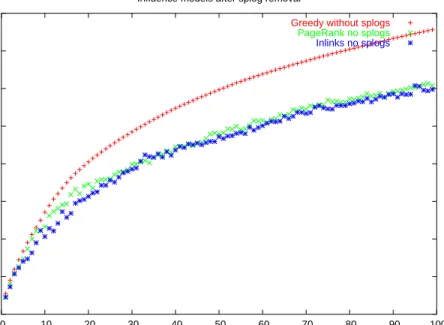
number of nodes influenced is estimated over multiple iterations. In greedy algorithm nodes are incrementally added to the target set if they locally maximize the size fo the influenced node set. Figure 4.3 shows that the indegree heuristic (which corresponds to the outdegree in the influence graph) at first seems to perform well, but fails to influ-ence more nodes as the initial set grows. Looking further at the results of the top ranks, suggested that the spread of influence plateaus due to the presence of a community of splogs, quite likely from a tightly knit community, around the top ranks. Elimi-nating such spam using the algorithm previously described results in the 4.4. Thus, by eliminating splogs, the top results obtained from the indegree heuristics almost approx-imated PageRank. This was also due to the fact that about 70% of the blogs as ranked by PageRank and indegree match after splog elimination.
However, it was found that the PageRank and greedy heuristics seem to perform almost the same even after the elimination of roughly 103687 nodes which correspond to splogs (including failed URLs).
PageRank vs Greedy Heuristic The Greedy heuristic of node selection performs better than both PageRank or indegree. However one of the disadvantages of the greedy approach is that it is computationally quite expensive. PageRank on the other hand is an iterative algorithm that converges to the principal eigenvector of the adjacency matrix. While it is faster to compute, it requires knowledge of the structure of links which
Link type count splog+failed to splog+failed 704451 splog+failed to blogfailed 81846 blog to blog 452305 blog to splog+failed 33108 total 1271710
Table 4.1:Table shows the link types from the link graph of 301700 nodes. 35.5% were from a blog to a blog while 55.4% were from splog+failed to splog+failed.
might emerge only after the Blogpost has been read and linked to by other blogs over a period of time.
As observed in table 4.1, splogs often link to blogs and hence when a blog is ac-tivated it may happen that the influence propagation could lead to the activation of some splogs (which may be a part of a community). These splogs may in turn activate other splogs. Due to this reason it can be observed that after the elimination of splogs from the link graph, the number of activated nodes at target set size of 100 is actually slightly lower than the number of activated nodes when we considered the link graph with splogs in it.
0 2000 4000 6000 8000 10000 12000 14000 16000 18000 0 10 20 30 40 50 60 70 80 90 100
Number of nodes influenced
Rank
Performance of Greedy heuristic, PageRank, Indegree
Greedy hill climbing
PageRank Indegree
Figure 4.3:The graph shows the performance of greedy heuristic vs PageRank heuristic vs indegree. The above results show the average influence after 10 iterations of each heuristic.
0 2000 4000 6000 8000 10000 12000 14000 16000 0 10 20 30 40 50 60 70 80 90 100
Number of nodes influenced
Number of nodes selected Influence models after splog removal
Greedy without splogs
PageRank no splogs Inlinks no splogs
Figure 4.4:The graph shows the performance of the indegree and pagerank heuristic after splog elimina-tion. The above results show the average influence after 10 iterations of each heuristic.
4.3
Readership based Influence Measures
Blogs have become a means by which new ideas and information spreads rapidly on the web. They often discuss the latest trends and echo with reactions to different events in the world. Protocols such as RSS, ATOM and OPML have made it much easier to share information online. Both RSS and ATOM are XML based file formats used for syndication. Outline Processor Markup Language (OPML) is a popular XML based format used to share an outline of the feed subscriptions.
Today feeds are being used to provide a wide variety of content online - blogs, wikis, main stream media, search results, etc. all support different forms of syndication. Users can subscribe to such feeds in an RSS reader such as Bloglines3, Google Reader4, News Gator5, etc. Typically, a user adds a feed to an RSS reader when she came across it (perhaps, by chance) as a reference on another blog.
The emphasis in blog search results is on freshness and relevance may be measured in terms of how related and how recent the blog post is. Measures of authority are mostly based on the number of inlinks. As Michael Arrington points in a recent post
3http://www.bloglines.com 4http://www.google.com/reader 5http://www.newsgator.com
[6], this can be misleading since a single post from a popular blogger on any topic may make him the top most blog for that topic, even if his blog has little to do with it.
In this section we present readership-based measures of the topical influence of a blog. The study presented here is based on the feed subscriptions of a large sample of Bloglines publicly listed users. Using this data, we first characterize the general feed usage patterns. Next, we try to identify the feeds that are popular for a given topic using the folders names as an approximation for a topic. By merging related folders we can create a more appropriate and compact set of topics. Finally we discuss some of the preliminary results in using this approach in support of a number of blog-related applications: feed browsing, feed recommendations, and searching for influential blogs in a different dataset.
By combining measures of topical authority with link-based algorithms we can provide better results for general or conceptual queries for which the goal is to find a resource of useful blogs on a topic.
4.3.1
Dataset Description
Bloglines provides a feature wherein a user may choose to share their subscriptions. We conduct a study of the publicly listed OPML feeds from 83,204 users consisting of a total of 2,786,687 subscriptions of which 496,879 are unique. Figure 4.5 shows the distribution of the top domains in the blogines dataset and compares this with do-main distribution from the Blogpulse dataset that was released by Intelliseek for the Webloggling Ecosystems Workshop held at the 15th International World Wide Web Conference. This dataset consists of posts from about 1.3 million blogs over a span of 20 days. The charts indicate differences in blog search engines indexes and RSS mon-itoring services. In particular, while there are a number of Bloglines users who sub-scribe to Web 2.0 sites and dynamically generated RSS feeds over customized queries, most of the Blogpulse dataset consists of blogs from blog hosting companies such as livejournal, xanga etc.
4.3.2
General statistics
According to Bloglines/Ask in July 2005 there were about 1.12 Million feeds that re-ally matter, which is based on the feeds subscribed by all the users on Bloglines. A study of the feeds on Bloglines by McEvoy [47] in April 2005 showed that there were about 32,415 public subscribers and their feeds accounted for 1,059,140 public feed subscriptions.
We collected similar data of the publicly listed users on Bloglines. From last year, the number of publicly listed subscribers had increased to 83,204 users (2.5 times that of last year) and there were 1,833,913 listed feeds (1.7 times) on the Bloglines site. Hence, even though the Blogosphere is almost doubling every six months, we found that the number of feeds that “really matter” doubles roughly every year. Inspite of it, it is still only a small fraction of the entire Blogosphere. Following sections describe some of the usage patterns and interesting statistics obtained from our analysis.
Figure 4.5: The distribution of domains in the Bloglines dataset. In comparison the second graph shows the data from Blogpulse.
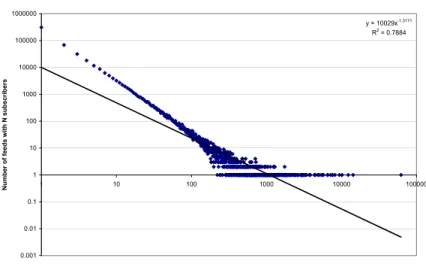
Distribution of Number of Subscribers of Feeds y = 10029x-1.3171 R2 = 0.7884 0.001 0.01 0.1 1 10 100 1000 10000 100000 1000000 1 10 100 1000 10000 100000 Number of Subscribers (N) N u m b e r o f fe e d s w it h N s u b s c ri b e rs
Figure 4.6: The number of subscribers for feeds follows a power law distribution. A few feeds are highly subscribed but most of the feed have a modest number of sub-scriptions. There are a number of feeds that have single digit subscribers.
User Statistics
Figure 4.6 shows the distribution of the number of subscribers for 496,879 unique feeds across 83,204 subscribers. This graph indicates a typical power law behavior with a few feeds having a large number of subscribers while most having a modest number of subscribers.
The number of subscribers for a feed is an indication of its authority and influence over its audience.
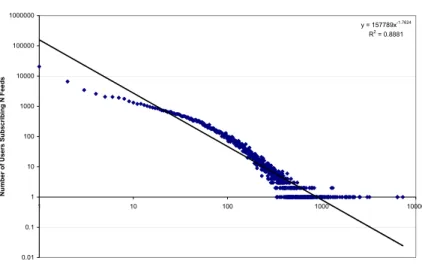
Next, we analyzed the number of feeds subscribed per user. Figure 4.7 indicates a slight deviation from a power law curve. We find that there are a few users, which are mostly automated tools posting to Bloglines, having very high number of feeds. Most of the users on the other hand have between 30 and 100 subscriptions. It is possible that for most users there is an inherent limit on the amount of information that they can keep track of at any given time. A new user who joins Bloglines might subscribe to a few feeds from the long tail (such as blogs belonging to friends or based on special interests) but is more likely to also subscribe to feeds that are already quite popular (such as Slashdot, Boingboing etc.).
Distribution of Number of Feeds Subscribed/User y = 157789x-1.7624 R2 = 0.8881 0.01 0.1 1 10 100 1000 10000 100000 1000000 1 10 100 1000 10000
Number of Feeds Subscribed (N)
Nu mb er o f Users S u b scri b in g N F eed s
Figure 4.7: The total number of subscribed feeds across all users. Most users have about 80-100 feeds subscribed per user.
of feeds subscribed by a user. It can be observed from this graph that as the number of feeds subscribed increase, the users tend to organize them into greater number of folders.
Distribution of Folders and Number of Feeds Subscribed (by each User)
y = -0.0113x2 + 11.341x - 3.1581 R2 = 0.3352 1 10 100 1000 10000 1 10 100 1000 Number of Folders N u m b e r o f F e e d s S u b s c ri b e d
Figure 4.8: Scatter plot showing the relation between the number of folders and number of feeds subscribed. Note: This includes the feeds subscribed under the default folder. Inspite of the high variance there is a clear trend that as the number of feeds increase, users tend to organize them into more folders.
Folder Statistics
Bloglines has a feature by which a user may organize their feeds into different fold-ers. While only some (26,2436 or about 35%) of the public subscribers use folders, it provides a user generated categorization of feeds. Other 4.9 shows the distribution of folder usage across these users and Figure 4.10 shows the number of folders per user.
4.3.3
Topic Representation and Clustering
Folder names can be treated as an approximation of a topic. Folder names in Bloglines are used in a way that is similar to Folksonomies on the web. As shown in Figure 4.11, by aggregating folders across all users, we can generate a tag cloud that shows the relative popularity and spread of various topics across Bloglines users. The tag cloud
Folder Distribution y = 3575.5x-0.816 R2 = 0.9067 0.1 1 10 100 1000 10000 100000 1 10 100 1000 10000 100000
Rank of the Folder (Based on Number of Feeds Classified Under the Folder)
N u m b e r o f U s e rs U s in g t h e F o ld e r
Figure 4.9: The number of users who use a folder
shown here is based on the top 200 folders. Note that the tag cloud contains terms such as ‘humor’ and ’humour’, etc. These terms represent variations in which different users label feeds. By merging folder names that are ‘related’ we can generate a more appropriate and compact representation of the tag cloud.
Next, we describe an approach used to merge related folders together. We were first tempted to use a morphological approach – merging the blog and blogs categories, for example. However, we soon discovered that folders with lexically similar names might actually represent different categorization needs of the users. For example, the folder ‘Podcasting’ consists of feeds that talk about how to podcast and provide tools. On the other hand ‘Podcasts’ refers to feeds containing actual podcasts. Other examples include ‘Music’ vs. ‘Musica’ (a topic with Spanish music blogs).
For each folder we construct a vector containing the feeds that have been catego-rized under that folder name and their corresponding counts. At this step we take only the top 100 most frequently occurring feeds per folder. Ideally this threshold would have to be determined statistically. Some folders, such as ‘friends’, were observed to consist of a large set of feeds for each of which there are only a handful of subscribers. On the other extremely popular folders like ‘politics’ contained a number of feeds that have many subscribers.
Two cases need to be considered for computing folder similarity: first is the case where feeds in one folder may either partially or completely subsume feeds present in
Distribution of Folder Usage y = 108524x-2.4115 R2 = 0.8839 0.01 0.1 1 10 100 1000 10000 100000 1 10 100 1000
Total Number of Folders Used (N)
N u m b e r o f U s e rs u s in g N f o ld e rs
Figure 4.10: Distribution of the number of folders per user
another folder. Subsumption indicates that there is a broader category and the larger folder is more general. For example the folder ‘news’ subsumes a number of folders that are more specific, such as ‘tech news’,‘IT news’, ’general news’, etc. For detecting the topics, it suffices to put these into a single category titled ‘news’. To compute subsumption we first find an overlap factor. For all folder pairs i,j we maintain a score of the overlap of feeds in folder j with feeds in folder i as follows:
overlap=matches
sizej
Folder similarity can be described in terms of the feeds that are contained in the folders. Two folder names are considered to be similar if they contain similar feeds in them. For each pair of folder names we compute the cosine similarity as follows:
cos(i, j) = P kWi,kWj,k q P kW 2 i,k∗ P kW 2 j,k
The weight Wi,k is determined by a TFIDF score for each feed in the vector. The weights are computed using the following formula:
Wf older(f eed) =f reqf older(f eed)∗log(
f olderCount
Before Merge
After Merge
Figure 4.11: The tag cloud generated from the top 200 Folders before and after merging related folders. The size of the word is scaled to indicate how many users use the folder name.
First we start by ranking the folders based on the number of users using the folder. Next we go through this ranked list and merge related folders together. A lower ranked folder is merged into a higher ranked folder ifoverlap > θ orcosine > δ. These thresholds were empirically set to 0.4. The table 4.2 shows the list of top 200 folders with the corresponding merged folders.
4.3.4
Applications
Our original motivation for this work was the need to classify blogs with respect to a set of topics for a study of influence on the Blogosphere [28]. We hoped that the folders common to many Bloglines users would provide an intuitive set of blog topics. Moreover, the feeds that Bloglines users assigned to the folders could be used to collect training data for the categories. This is in fact the case, but after working with the data, we recognized that it supports the needs of many other studies and applications.
Feed Recommender Folder similarity allows us to compare how related two folder vectors are based on the feeds that occur in them. Feed similarity can be defined in a similar manner: two feeds are similar if they often co-occur under similar folders. Note that this definition of feed similarity does not use the textual content of the feed but is entirely based on the subscription data. This gives us an ability to compare two feeds and recommend new feeds that are like a given feed. For each feed there is a folder vector that maintains a count of the number of times the feed has been categorized under a folder name. For a pair of feeds i,j feed similarity is defined as:
cos(i, j) = P kWi,kWj,k q P kW 2 i,k∗ P kW 2 j,k
The weightWi,k is determined by a TFIDF score for each folder in the feed vector. The weights are computed using the following formula:
Wf eed(f older) =f reqf eed(f older)∗log(
f eedCount
|f eedsLabeledF older|)
Identifying Influential Feeds Consider a scenario where a user has a few blogs that she subscribes to or is familiar with a couple of extremely popular blogs for a topic. Now, she wishes to find other blogs that are also opinion leaders in this area. In this section we present a simple heuristic that is based on an influence propagation model using linear threshold that was described in the previous section.
Algorithm 1 can be used to identify a set of nodes that are influential for a given topic. As shown in figure 4.12, starting with some seed blogs for a given topic, we can induce a set of blogs that are termed as the followers. Followers are those blogs that are often influenced by the seed set. The goal is to infer other authoritative blogs or
leaders for the topic. The pseudocode of the Leaders Influence Followers Algorithm 1
Rank Folder Merged Folders
1 news technology, tech news, it news, general news, technews, world news, news feeds, newspapers
2 blogs friends, misc, personal, people, other, general personal blogs, blogroll, daily, weblogs, tech blogs, other blogs, favorites, bloggers
3 tech friends, technology, tech news, gadgets, other, general, it, geek, blogroll, daily, english, it news, tech blogs, computer, technews, technology news, computers, favorites, technical, public, gadget, tech stuff, geek news, computing, techie, geek stuff
4 comics fun, humor, funny, humour, cartoons, fun stuff, webcomics, comix, comic strips
5 music mp3, mp3 blogs
6 politics political, political blogs
7 podcasts podcast
8 design web design, web, web development, webdesign, webdev, css, web dev,web standards
9 sports
10 science science news 11 business biz, business news 12 software downloads 13 entertainment fun, movies 14 linux
15 mac apple, macintosh, mac stuff, mac news 16 flickr
17 food cooking, food blogs 18 marketing
19 games gaming, video games 20 weather
21 photography photos, photo, fotografia 22 security
23 java
24 blog blogger
25 programming development, dev, technical, software development, code Table 4.2: The top 25 folders with corresponding merged folders
Seed Blogs
http://www.dailykos.com
http://www.talkingpointsmemo.com
Top Leader Blogs
http://www.huffingtonpost.com/theblog http://americablog.blogspot.com http://thinkprogress.org http://www.tpmcafe.com http://www.crooksandliars.com http://atrios.blogspot.com http://www.washingtonmonthly.com http://billmon.org http://www.juancole.com http://capitolbuzz.blogspot.com http://instapundit.com http://www.opinionjournal.com http://digbysblog.blogspot.com http://michellemalkin.com http://www.powerlineblog.com http://theleftcoaster.com http://www.andrewsullivan.com http://www.thismodernworld.com
Figure 4.12: Identifying leaders: Starting with a few seed blogs on a topic a set of followers are induced and other leaders for this set are identified using the influence graph.
Starting with a few top ranked feeds from the Bloglines dataset for the folders ‘Politics’, ‘Tech’,‘Business’ and ‘Knitting’ we use the LIFT algorithm to find other leaders in the Blogpulse dataset. Table 4.3 to 4.6 show some of the results.
FTM! Feeds That Matter FTM!6 is a site that was implemented out of a need to find a high quality listing or index of topical blogs and feeds. This site is based on the Bloglines dataset described in this paper and implements the algorithms presented here for merging folders and providing recommendations. For example if the user was interested in a topic, say photography, she could look at the tag cloud and quickly find feeds that are most often categorized under the folder name “photography”. Next, the system allows users to subscribe to the popular feeds directly in their Bloglines or Yahoo RSS readers. Alternatively, one could start a known feed and FTM! would provide recommendations based on the subscription information. By monitoring the number of subscriptions for such recommendations we hope to further evaluate the recommendation algorithm itself.
We evaluate if folder similarity results in grouping related feeds together. We do
Seed Blogs
http://blog.fastcompany.com
http://business2.blogs.com/business2blog
Top Leader Blogs
http://headrush.typepad.com/creating passionate users http://blog.fastcompany.com http://www.ipodlounge.com http://www.fastcompany.com/homepage http://brandautopsy.typepad.com/brandautopsy http://gigaom.com http://www.mobileread.com http://blogs.salon.com/0002007 http://sethgodin.typepad.com/seths blog http://ad-rag.com http://www.warrenellis.com http://www.micropersuasion.com http://battellemedia.com http://www.adrants.com http://customerevangelists.typepad.com/blog
Table 4.4: The influential leaders found starting with a small seed set for topic
‘Busi-ness’
Seed Blogs
http://slashdot.org http://www.kuro5hin.org
Top Leader Blogs
http://www.boingboing.net http://www.engadget.com http://www.metafilter.com http://www.c10n.info http://www.makezine.com/blog http://radio.weblogs.com/0001011 http://mnm.uib.es/gallir http://www.mozillazine.org http://weblogs.mozillazine.org/asa http://www.gizmodo.com
Table 4.5: The influential feeds found starting with a small seed set for the topic
Algorithm 1 Leaders Influence Followers Algorithm S←SeedSet
F←Inf luencedF ollowersSet IG←Inf luenceGraph
for allisuch that0≤i≤max iterationsdo
ActivateS for allv∈IGdo θv= random score end for for allv∈IGdo ifP
w active neighbors of vbwv≥θvthen
Activate v add v toFi end if end for end for F=FiS Fi+1S· · ·Fmax iterations
for allkhas inlinks toFdo ok= outlink count of k
nk= number of nodes linked from k to F
leader score= nk
ok ∗log(ok) end for
this by comparing the folder similarity based on co-citations in URL vectors to text similarity of text obtained form the homepages of the feeds.
Figure 4.13 shows a comparison of average text similarity of feeds in the top 20 folders. For all the folders it was found that the feeds shared a greater similarity within the folder rather than across other folders. While the scores may seem low, studies on Technorati data by Brooks [10] show cosine similarity of posts sharing the same tag to be around 0.3. According to their study, when the same posts were clustered using the high scoring TFIDF terms the average text similarity was around 0.7.
Table 4.7 shows some of the recommendations for a few blogs. The feed recom-mendations are obtained by comparing the feeds to find how often they co-occur in the same folder. To evaluate the effectiveness of this system, we use the text based cosine similarity as a measure of how related the feeds are. We find that many of the recommended feeds have a high similarity score with the feed submitted.
4.4
Discussion
As described in this section, there are different possible ways in which we can use direct measurable attributes of the network to analyze influence. In the first case we used a simple model for tracking information cascades in the network. The second technique used a different approach through readership information. The assumption here was that the readers were a representative set of the people who follow blogs
Seed Blogs
http://www.yarnharlot.ca/blog http://wendyknits.net
Top Leader Blogs
http://booshay.blogspot.com http://mamacate.typepad.com/mamacate http://www.thejonblog.com/knit http://alison.knitsmiths.us http://www.dioramarama.com/kmel http://knittersofdoom.blogspirit.com http://tonigirl.blogdrive.com http://www.crazyauntpurl.com http://www.januaryone.com
http://nathaniaapple.typepad.com/knit quilt stitch http://www.knittygritty.net
http://www.katwithak.com
http://www.myblog.de/evelynsbreiwerk http://nepenthe.blog-city.com
http://zardra.blogspot.com
Table 4.6: The influential feeds found starting with a small seed set for the topic
‘Knit-ting’
and their intuitive classifications into folders gave indication of the category to which the feed belonged. Both these approaches look promising and we plan to use them in the following manner: First, we plan to refine the cascade models to include polarity, topical sensitivity and temporal effect. Next, using either simulated graphs or data from the Blogosphere, we will test our models with the readership information as the benchmark. Such an approach would allow us to model and test topical influence.
http://www.dailykos.com Similarity http://www.andrewsullivan.com 0.496 http://www.talkingpointsmemo.com 0.45 http://atrios.blogspot.com 0.399 http://jameswolcott.com 0.466 http://mediamatters.org 0.262 http://yglesias.typepad.com/matthew/ 0.285 http://billmon.org/ 0.343 http://digbysblog.blogspot.com 0.555 http://instapundit.com/ 0.397 http://www.washingtonmonthly.com/ 0.446 http://blog.fastcompany.com http://business2.blogs.com/business2blog 0.303 http://www.fastcompany.com 0.454 http://sethgodin.typepad.com/seths blog/ 0.374 http://www.ducttapemarketing.com/ 0.028 http://customerevangelists.typepad.com 0.399 http://blog.guykawasaki.com/ 0.441 http://www.tompeters.com 0.457 http://www.paidcontent.org/ 0.351 http://slashdot.org http://www.techdirt.com/ 0.516 http://www.theregister.co.uk/ 0.1 http://www.geeknewscentral.com/ 0.286 http://www.theInquirer.net 0.2 http://news.com.com/ 0.24 http://www.kuro5hin.org/ 0.332 http://www.pbs.org/cringely/ 0.087 http://backword.me.uk/ -http://digg.com/ 0.165 http://www.infoworld.com/news/index.html 0.203 http://www.yarnharlot.ca/blog/ http://wendyknits.net/ 0.419 http://www.woolflowers.net/ 0.139 http://zeneedle.typepad.com/
zeneedle process of art/ 0.383
http://WWW.markarkleiman.com/ -http://www.keyboardbiologist.net/knitblog/ 0.297 http://alison.knitsmiths.us/ 0.284 http://knitandtonic.typepad.com/knitandtonic/ 0.542 http://www.crazyauntpurl.com/ 0.521 http://www.lollygirl.com/blog/ 0.4 http://ma2ut.blogspot.com 0.423
Figure 4.13: The average text similarity of the top 20 Folders. The chart shows the average similarity for the top 15 feeds within and across all the folders.
Chapter 5
Opinion Extraction
5.1
Introduction
Each person has a distinct set of likes and dislikes. Some of these are based on judg-ment and assessjudg-ment of a past experience, while others may look seemingly random or subjective. Personal preferences, social and cultural factors shape our view and opin-ions. Social interactions play a major role in sharing our views and hence our opinions with others. Some individuals may be more vocal and expressive about what they think or believe while others may do so in a subtle way. Blogs started as online journals and diaries, which by nature tend to be informal, expressive and often opinionated. With the low barrier for creating content, social media, especially blogs have made it easier for people to share their views with others. Often such opinions manifest in subtle ways while talking about everyday experiences. The realization that such opinions have the power to influence others in the social network, has led to increased interest in “opinion/ sentiment” extraction. One such effort has been through the annual Text Extraction and Retrieval Conference (TREC) held by NIST.
Here, we describe our approach to the 2006 TREC Blog track opinion retrieval task. For the opinion retrieval task, we used a number of approaches to score the retrieved posts based on different features. The scores were then combined using machine learn-ing. We also found that a challenging part of the opinion retrieval task was to effectively eliminate spam blog posts (splogs) and cleaning the blog posts to eliminate extraneous links.
UMBC and JHU/APL collaborated as a team for athe 2006 TREC Blog track spon-sored by NIST. This track asked participants to implement and evaluate a system to do “opinion retrieval” from blog posts. Specifically, the task was defined as follows: build a system that will take a query string describing a topic, e.g., “March of the Penguins”, and return a ranked list of blog posts that express an opinion, positive or negative, about the topic. For evaluation, NIST provided a dataset of over three million blogs drawn from about 100,000 blogs. Participants built and trained their systems to work on this dataset. Contestants do an automatic evaluation by downloading and running, without further modification to their systems, a set of fifty test queries.
5.2
BlogVox: Seperating Blog Wheat from Blog Chaff
This section describes BlogVox [27], an opinion extraction system.
5.2.1
The TREC Blog Track
Opinion extraction has been studied for mining sentiments and reviews in specific do-mains such as consumer products [12] and movies [57, 16]. More recently, blogs have become a new medium though which users express sentiments. Opinion extraction has thus become important for understanding consumer biases and is being used as a new tool for market intelligence [18] [54][44]. Different sentiment classification tech-niques have been applied in movies and product domains. Many of these techtech-niques use a combination of machine learning, NLP and heuristic techniques. While some of the work looks at identifying opinions at a document level, others have tried to clas-sify sentences and summarize opinions. Sentiment classification techniques often rely on identifying subjective terms and phrases using NLP, machine learning or wordlists. Nigam and Hurst use a combination of shallow parsing and machine learning to iden-tify polarity and topical classification of sentences. The sentence level models are used in making document level classifications. Turney [63] proposes a simple unsupervised technique using search engine hits to determine the semantic orientation of phrases containing adjectives or adverbs in the reviews.
Minqing Hu and Bing Liu [24] propose using WordNet to determine the polarity of different adjectives. Their goal is to identify sentiment at a sentence level. The overall polarity score for a sentence is determined by combining the weights contributed by each of the adjectives near a feature word. The Opinion Observer system [44] extends this work to summarizing the pros and cons of various features of a product.
For TREC our team developed a system based upon the Lucene information re-trieval system for the basic rere-trieval task. Compared to domain-specific opinion extrac-tion, identifying opinionated documents about a randomly chosen topic from a pool of documents that are potentially unrelated to the topic is a much more difficult task. Our goal for this project was to create a system that could dynamically learn topic sensi-tive sentiment words to better find blog posts expressing an opinion about a specified topic. We use a meta-learning approach and designed an architecture where a set of scorers would each evaluate every relevant document and produce a score represent-ing how opinionated it is. These scores would then be used as a feature vector for an SVM [11] to classify our documents. Following is a description of the BlogVox system which utilized machine learning techniques for both pre-indexing data preparation and post-retrieval ranking for opinionatedness.
5.2.2
Pre-indexing Processing
The TREC dataset consisted of a set of XML formatted files, each containing blog posts crawled on a given date. The entire collection consisted of over 3.2M posts from 100K feeds [46]. These posts were parsed and stored separately for convenient indexing,
using the HTML parser tool1. Non-English blogs were ignored, as was any page that failed to parse due to encoding issues.
To make the challenge realistic NIST explicitly included 17,969 feeds from splogs, contributing to 15.8% of the documents. There were 83,307 distinct homepage URLs present in the collection, of which 81,014 could be processed. The collection contained a total of 3,214,727 permalinks from all these blogs. Our automated splog detection technique identified 13,542 blogs as splogs. This accounts for about 16% of the iden-tified homepages. The total number of permalinks from these splogs is 543,086 or around 16% of the collection. While the actual list of splogs is currently not available for comparison , the current estimate seem to be close. To prevent the possibility of splogs skewing our results permalinks associated with splogs were not indexed.
To improve the quality of opinion extraction results, it is important to identify the title and content of the blog post because the scoring functions and Lucene indexing engine can not differentiate between text present in the links and sidebars of the blog post. Thus, a post which has a link to a recent post titled ‘Why I love my Ipod’ would be retrieved as an opinionated post even if the actual post is actually about some other topic. Non English Blog removal Non English Blog removal 2 Collection Parsing Collection Parsing 1 Splog Detection Splog Detection 3
Pre Indexing Steps
Title and Content Extraction
Title and Content Extraction
4
Figure 5.1: BlogVox text Preparation steps: (i) parsing the TREC corpus (ii) removing non English posts (iii) Eliminating splogs from the collection (iv) removing spurious material from the DOM tree.
5.2.3
Post-retrieval Processing
After pre-indexing blog posts are indexed using Lucene, an open-source searc