POLICY RESEARCH WORKING
PAPER
2369
How the Proposed Basel
The Basel Committee hasproposed linking capital asset
Guidelines on Rating-
requirements for banks to theAgency Assessments
Would
banks' private sector ratings.Doing so would reduce the
Affect Developing Countries
capital requirements for banksthat lend prudently in high-income countries; the same
Giovanni Ferr incentives would not apply in
Li-Gang Liu developing countries.
Giovanni Majnoni
The World Bank
Financial Sector Strategy and Policy Department June 2000
Public Disclosure Authorized
Public Disclosure Authorized
Public Disclosure Authorized
Summary findings
Using historical data on sovereign and individual sovereign downgrading would bring greater changes in
borrowers, Ferri, Liu, and Majnoni assess the potential capital allocations than an upgrading, and would call for impact on non-high-income countries of linking capital larger capital requirements at the very time access to asset requirements for banks to private sector ratings, as capital markets was more difficult.
the Basel Committee has proposed. Under the new guidelines, capital requirements in
They show that linking banks' capital asset developing countries would thus be exposed to the
requirements to external ratings would have undesirable cyclical swings associated with the revision of sovereign
effects for developing countries. ratings in recent crises.
First, ratings of banks and corporations in developing Ultimately, linking banks' capital asset requirements to countries are less common, so capital asset requirements private sector ratings would reduce the credit available to would be practically insensitive to improvements in the non-high-income countries and make it more costly, quality of assets - widening the gap between banks of limiting economic activity. Bank capital needs in
equal financial strength in higher- and lower-income developing countries would be more volatile than those
countries. in high-income countries.
Second, bank and corporate ratings in developing These findings suggest that the Basel Committee countries (unlike their counterparts in high-income should reassess the role it proposes assigning to external countries) are strongly linked to the sovereign ratings for ratings, to minimize the detrimental impact of the the country - and appear to be strongly related regulatory use of such ratings on developing countries.
(asymmetrically) to changes in the sovereign ratings. A
This paper - a product of the Financial Sector Strategy and Policy Department - is part of a larger effort in the department
to study the impact of financial regulation on economic development. Copies of the paper are available free from the World Bank, 1818 H Street NW, Washington, DC 20433. Please contact Elena Mekhova, room MC9-622, telephone 202-458-5984, fax 202-522-2031, email address emekhova(%worldbank.org. Policy Research Working Papers are also posted on the Web at www.worldbank.org/research/workingpapers. The authors may be contacted at [email protected] or [email protected]. June 2000. (31 pages)
The Policy Research Working Paper Series disseminates the findings of work in progress to encourage the exchange of ideas about development issues. An objective of the series is toget the findings out quickly, even if the presentations are less than fully polished. The papers carry the names of the authors and should be cited accordingly. The findings, interpretations, and conclusions expressed in this paper are entirely those of the authors. They do not necessarily represent the view of the World Bank, its Executive Directors, or the countries they represent.
by Giovanni Ferri, Li-Gang Liu, and Giovanni Majnoni * World Bank; University of Bari (Italy)
JEL classification numbers: G15, G18, G21
Keywords: external credit ratings, bank capital asset requirements
* We wish to thank Noemi L. Giszpenc and Hosook Hwang for valuable research assistance. Helpful comments on a previous version of the paper were provided by Lea Carty, Stjin Claessens, Cem Karacadag and by participants of the New York University Conference on "Credit Ratings and the New Basel Guidelines on Capital Adequacy for Bank Credit Assets" and in the World Bank "Annual Bank Conference on Development Economics".
Introduction
The release for public comments in June 1999 of the new Basel Committee proposal on bank Capital Asset Requirements (CARs) has ignited a lively discussion on whether and how the orientation taken by the Committee should be revised. Part of the criticism questions the role that the proposal assigns to external ratings. Specifically,
according to the proposal, CARs on assets vis-a-vis high-rated agents would be much lower than CARs on assets vis-a-vis low-rated and non-rated agents. This would be a desirable step towards enhancing bank efficiency in allocating loans if credit ratings displayed a homogeneous quality across markets and borrowers. Unfortunately, whereas credit rating agencies have a longer record in assessing the health of banks and corporations in the USA and some other developed countries, their experience with sovereign and private sector ratings in NIHICs' is often limited to the last decade, which is
likely to affect the quality of ratings.2
In this paper we provide evidence that linking bank CARs to external ratings would, from the perspective of less developed financial systems, introduce modest improvements at the cost of substantial distortions. Volatility of banks' capital requirements in poorer countries would be increased and the cost of capital for the best institutions of those countries would be higher than for peer institutions from more developed economies. In turn, this would negatively affect the availability and cost of credit in NHICs. The damage would stem from three distinct effects. The first effect is mundane in nature: as ratings are by far less widespread for banks and corporations in NHICs, bank CARs would not decrease (or increase) in these countries according to the risk exposure of individual corporations, as opposed to what would happen for high-income countries (HICs). The second effect stems from the fact that, based on the historical experience, NHICs have experienced downgradings of their sovereign ratings
which a number of recent studies have labeled as "excessive". 3 Since the sovereign rating
is generally the pivot of all the other country's ratings -determining defacto a ceiling for the private sector- this entails a generalized negative impact on the country's bank CARs. The third effect depends on the fact that bank and corporate ratings in NHICs are more tightly linked to sovereign rating changes, introducing an element of asymmetry between the treatment of bank CARs in HICs and NHICs.
From these perspective, our findings suggest a reassessment of the role assigned to external ratings in the new Basel Committee proposal, with a view to minimizing the detrimental impact that the regulatory use of external ratings could have for NHICs. A modest reassessment could be to grant banks a time frame to phase-in the new rules long enough to allow for a substantial increase in the number of rated banks and corporations
1 Non-high-income countries include high middle-income, middle-income, and low-income countries as categorized by the World Bank.
2 IMF (1999) provides an extensive discussion of a) the problems faced in assessing the accuracy of ratings in developing economies; b) the changes in the analytical methodology used by credit rating agencies during the recent crises.
3See among others, Ferri, Liu and Stiglitz (1999) and Monfort and Mulder (2000). See Cantor and Packer (1994, 1996) for early analyses of rating agencies' behavior. See also Kuhner (1999) and Partnoy (1999) for additional critical discussion of rating agencies' assessments.
located in developing countries and to allow time for rating agencies to stabilize the quality of their assessments. A more radical step would be to abandon altogether, for the time being, external ratings as determinants of bank CARs in NHICs. An intermediate revision would be to recognize that ratings cannot be considered a "sufficient" statistic for assessing the quality of sovereign and corporate borrowers in countries which lack
transparent institutional setting as it is the case for most NHICs.4 In these cases they
should therefore be integrated by additional sources of information in order to prevent regulatory induced distortions.
The paper is structured as follows. In Section 2, we describe the geographical distribution of sovereign and private ratings throughout the globe. This substantiates the claim that private sector ratings are heavily concentrated in (some) HICs. Using the geographical distribution of private sector ratings and their levels, Section 3 simulates the impact of the new proposed regulation on bank CARs in different countries. In Section 4, we provide some descriptive evidence of the asymmetric impact of ratings in East Asian
crisis countries, in the aftermnath of the crisis. Following the economic recovery in 1999,
sovereign ratings were promptly brought back to investment-grade, while the revision of corporate ratings has been considerably more conservative. More systematically, the econometric analysis in Section 5 contrasts the experience of corporate ratings in HICs and NHICs, providing an empirical measure of the higher sensitivity to sovereign downgrading displayed by banks and non bank corporates in NHICs. In Section 6, drawing on the previous results, we offer some illustrative examples of how the proposed revision of the capital accord could have affected bank capital requirements for those NHICs which have suffered a sovereign downgrading. Section 7 concludes stressing the policy implications of our findings.
2. The geographical distribution of ratings
The geographical coverage of rated firns has greatly increased in the last two decades together with the progressive globalization of goods and financial markets. This development is the consequence of both the greater scope of coverage of the larger international rating agencies (S&P, Moody's, Fitch-IBCA) and of a more active presence of nationally based rating agencies.
In this paper we shall focus on the role of international rating agencies, whose assessments are more easily comparable on a homogeneous basis and which provide a more transparent -if not exclusive- benchmark for regulatory purposes. An exam-ple of the development in the scope of coverage by large international rating agencies is provided by the increase in the number of foreign currency sovereign ratings provided by Standard and Poors, which has gone from only 11 countries twenty years ago to 25 in 1989 and to 80 in 1999. The expansion of the number of rated firms has followed that of the sovereign ratings. At the end of 1999, only 6 countries, among those who had an S&P sovereign rating, did not have any individual firm rating.
4 The interpretation of bank ratings as a sufficient statistics is supported by the following excerpts from
Moody's (1999a, p.9): "Paraphrasing Friedrich von Hayek, who famously saw the beauty of the market in the fact that it assinmilates information by reducing it to a single price, we can suggest that the beauty of a rating is that it assimilates credit information and analysis into a symbol.".
The number of rated firms per country, computed as the average number of firms who held a foreign or domestic currency rating from S&P and Moody's in the second half of 1999, shows that the scope of coverage for banks is substantially similar to that of the total of rated firms. In both cases Africa, Central America, Central Asia and the Middle East show the lowest density of coverage. Most developing countries show the lowest degree of concentration of rated firms, exception made for fast growing economies as Korea and Indonesia and for large countries as China, Brazil, Argentina and Chile.
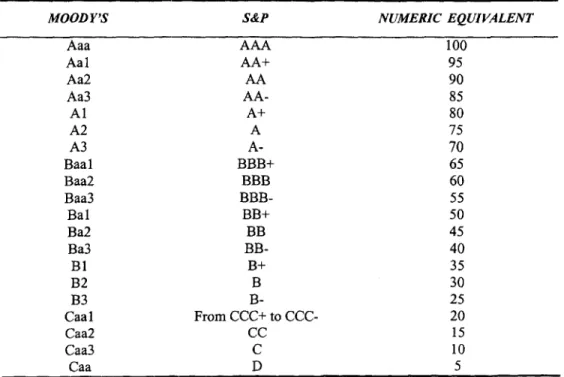
In what follows, we conventionally convert the equivalent Moody's and S&P alphanumeric rating scale into the numeric scale as reported in Table 1.
The progressive extension of the rating coverage also seems to be closely associated with the level of economic development and the rate of economic growth. Are the number of rated firms and the level of their ratings positively associated with their country's income level? In order to shed some light on this issue, we have grouped the countries with at least one rated firm in four categories according to their income level: GIO countries, High income non-GIO countries, Upper-middle income countries and Low-middle income countries. Table 2 shows the number of rated institutions-banks and non-banking firms alike-and the median rating for each of the four categories as reported by S&P. It appears that the total number of rated firms declines sharply in countries of low income. The reduction of rated firms is particularly steep when it comes to non-banks. The number of rated firms in G10 countries is 24 times higher than that of firms located in the lowest income group, as opposed to a GDP level eight times larger. The number of rated banks is instead only five times larger. The median rating of the four categories shows that the first two groups of high-income countries (GIO and non-G10) are solidly positioned above the level of investment grade (55 in the numeric scale), while both the middle and lower income groups are below the level of investment grade. An analogous situation can be found for non-banks as well. Though the values of median ratings do not exhibit a decreasing, monotonic pattern, they are generally lower for firms in NHICs than for firms in high-income countries. This finding will be explored in more detail in the next sections of the paper.
Are firms' ratings closely associated with sovereign ratings? What is the role of income levels in this relationship? Figure 1, which plots the distribution of sovereign and firms' ratings for the four income groups of countries previously defined, sheds some light on these two questions. The correlation between firms' and sovereign ratings is almost non-existent for G10 countries. However, it becomes increasingly tighter for the other three groups of countries as the income level decreases. Furthermore, GI0 countries display a very clear bimodal distribution of firms' ratings, as a result of two different distributions for firms in the banking sector and outside the banking sector: the former group of firms displays a maximum below the investment grade level while the latter group is much more concentrated towards higher ratings. In contrast, the behavior of the three remaining groups of countries demonstrates that there is a closer correlation between firms' and sovereign ratings, that ratings for both banks and non-banks exhibit a
similar pattern and that average ratings decrease with the level of income.
Overall, this brief overview of the worldwide distribution of sovereign and firm ratings shows that US based rating agencies, in spite of the very rapid growth of their
international activities in the last decade, have devoted most of their efforts to relatively more developed economies, where marginal and fixed costs associated to the coverage of additional firms are lower and/or where the demand for ratings is higher. Second, the attainment of a worldwide scope of coverage is a very recent phenomenon, providing rating agencies with too limited a sample for comprehensive assessments of their accuracy in non-GI0 countries. Third, rating agencies tend to concentrate initially on the banking sector and only subsequently move to the non-bank sector of the economy. Finally, firms' ratings follow more closely sovereign ratings as the income level decreases. While these outcomes may be fully consistent with rational assessments of credit risk in economies with large information costs and unstable institutional structures, they also point to potential shortcomings in the use of ratings for regulatory purposes. In the Sections below, we shall try to characterize with greater detail some of these shortcomings and to assess their implication on the design of bank capital regulation.
3. From the distribution of ratings to that of capital requirements
As reported in Table 3, the rule relating higher capital requirements to lower rating categories is not a monotone one and differs for banks and non-banks. The distribution of capital requirements, which is implicit in the Basel proposal, is therefore not an obvious outcome of the distribution of ratings, which we have just reviewed. In order to derive the distribution of changes in capital requirements implied in the transition from the present system to the proposed one, we have simulated the effect on the regulatory capital of a bank which would lend to the rated firms located in any single country. The exercise-based on the ratings provided by S&P-simulates the capital requirements that banks would have faced, had the proposed revision of the Capital Accord come into force in the month of November 1999. We then compare the outcome of the simulation with the current capital requirements as defined by the 1988 Capital
Accord.
The 1988 regulation imposed different capital requirements according to: 1) the nature of the borrower-bank versus non-bank; 2) the location of the borrower-OECD vs. non-OECD country; 3) the maturity of the loan-less than or more than one year. To
compare the 1988 regulation with the new Basel proposal effectively, we focus on the differential impact of the proposed new regulation according to the geographical location of the borrower, its economic sector (bank versus non-bank), and the maturity of loans.
Figure 2A shows the dlifferential capital requirements for all the rated non-bank corporations located in the four previously described groups of countries. Given the nature of the current regulation, which defines a specific regulatory treatment for OECD countries, we have modified the composition of the first two groups along the partition of OECD vs.non-OECD countries instead of that Gl0 vs.non-G10 countries.
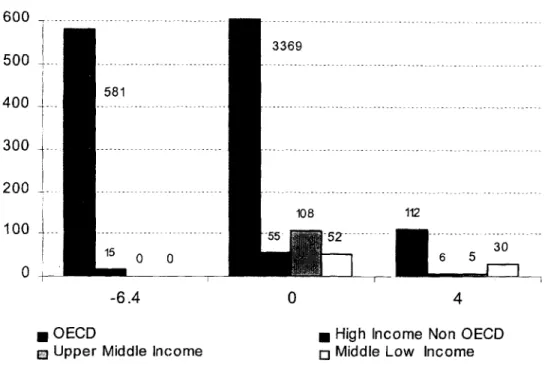
For non-bank corporations, which start all from an 8 per cent requirement, there are three possible outcomes: a. decrease of 6.4 percentage points, no change, an increase of 4 percentage points. In our sample, the number of high rated corporations (better than AA), which will allow a lower capital requirement and will accordingly face a lower cost of bank credit, is equal to 581 OECD based firms and to only 15 non-OECD based firms, located in the high income category. Accordingly, no firm belonging to the two lower
income categories would experience a reduction in its borrowing costs. Among OECD based corporations, about four fifths would see no change in the capital banks have to set aside against loans to them. The same is true for the vast majority of the two intermediate groups of countries. However, more than one third of rated firms located in the lower income category would instead face a steep increase. As a result, the average increase of capital that banks would be required to set aside for lending to an OECD corporation would be reduced by I percentage point while that required for lending to a corporation based in the poorer group of countries would increase by 1.5 percentage points. This average level, though, may hide the marginal impact on different groups of borrowers (Figure 2A, section b). Differential capital requirements associated with different ratings may reach 10.4 percentage points, with potentially relevant effect on the direction of bank capital flows.
Regarding banks we use a base reference of a common capital requirement of 1.6 per cent on all loans made to other banks, following the notion that foreign borrowing of non-OECD banks from OECD banks has mostly been concentrated in the short end of the maturity spectrum. As for the newly proposed rules, we have concentrated on the case in which bank capital weights are referred to individual bank ratings (option 2 of the Basel Consultative paper) and not to the sovereign rating of the country where the bank is incorporated (option 1 of the Consultative paper). The differential impact of the two options is very limited and does not add new elements to our exercise.
Given these assumptions, the new rules would imply that, differently from the non-bank case, four possible outcomes could prevail: no change, increases of 2.4, 6.4, and 10.4 percentage points. The median value of the increase in capital requirements for loans to OECD banks is equal to 2.4 percentage points, while that for loans to non-OECD banks is equal to 6.4 percentage points. On average, capital requirements would increase by 2 percentage points for OECD banks and up to more than 6 percentage points for banks of poorer countries (Figure 2B, section b). For the sake of completeness, we report also the impact on average capital requirements of long-term lending to non-OECD banks, which was assigned an 8 per cent weight in the 1988 Accord. Even in this case, lending to lower income countries' banks would imply increased capital requirements. As for non-banks, foreign controlled subsidiaries of highly rated firms, which are assigned the rating of their holding company or can borrow from it, might face capital requirements on their borrowing which could differ up to 10.4 percentage points from
those of domestic banks.
Of course the increase in capital requirements discussed so far would give rise to an equivalent demand for new capital only in the case in which national regulations were fully aligned to the 1988 Capital Accord and did not already incorporate stricter requirements. From this perspective, our estimates could be seen as a ceiling to the
amount of new capital required. At the same time, it could be argued that national requirements may very well be revised upward in order to maintain a more restrictive stance at the national level.
Although it impossible to assess the welfare implications of the external rating procedure for defining minimum bank capital ratios without incorporating additional elements into the analysis, we can already see that less developed economies are likely to
suffer from a substantial increase in their borrowing cost.5 Even in the case in which this increase is generated by the desirable removal of previous subsidization schemes, it appears important to devote particular attention to the phasing-in process of any regulatory change in the domrain of minimum bank capital ratios. Such caution is needed in order to avoid undesired systemic implications, which could increase rather than reduce the fragility of banking systems.
More generally, all other things being equal, any risk-related criterion for the definition of minimum capital ratios would substantially decrease the cost of credit for internationally diversified fitms and could result in an increase in the share of credit to the domestic sector provided by internationally diversified firms. Although the equilibrium allocation should arguably benefit from the removal of an implicit subsidization scheme to the riskiest firms in the market, the potential consequences of a large reallocation of credit flows among different categories of financial interrnediaries would need to be analyzed carefully.
4. A tale from the 1997-98 crises: downgrading sovereigns, banks and corporations
The experience of soviereign and private sector ratings in emerging economies in 1997-98 may provide an example in which the revision of ratings could have had some undesired macroeconomic consequences had it been related to banks minimum capital requirements. Indeed, the East Asian crisis and the other crises that hit emerging economies during 1997-98 induced markets and rating agencies to a delayed and large set of revisions of their assessment on crisis countries. Ratings were sharply downgraded for sovereigns. The astounding downgrading is depicted in the rating-transition Figure 3.
Based on Moody's data for a. large set of countries,6 Figure 3 reports on the x axis 1996
(pre-crisis) sovereign ratings and on the y axis the relative 1998 (peak-of-the-crisis) ratings. The rating-transition graph can be read as follows. Figure 3 is divided into different regions by three lines: the 450 continuous line contrasts 1996 with 1998 ratings; the vertical dotted line separates below-investment-grade from above-investment-grade ratings for 1996; the horizontal dotted line separates below-investment-grade from above-investment-grade ratings for 1998. Points lying below the 450 line identify those countries suffering a downgrading between 1996 and 1998; points lying on the 450 line refer to those countries whose rating did not change; points above the 450 line identify those countries whose rating improved between 1996 and 1998. In addition, the horizontal and vertical dotted lines divide the graph into four quadrants. Points in the Northwest quadrant identify countries holding above-investment-grade ratings in both 1996 and 1998. Points in the Southeast quadrant identify countries holding below-investment-grade ratings in both 1996 and 1998. Points in the Southwest quadrant ' The limited number of rated firms in NHICs and the fact that those firms are likely to have easier access to non-bank sources of financing does not weaken our conclusions. Bank regulators, in fact, will not put at a disadvantage rated finns, which are likely to have lower risk profiles. They, instead, are expected to extend the higher capital requirements of rated firms to non-rated concerns as well.
6 Specifically, for each of the two years, we consider the year-minimum sovereign rating for the following 31 countries: Argentina, Australia, Austria, Belgium, Brazil, Canada, Chile, China, Colombia, Denmark, Finland, France, Germany, India, Indonesia, Japan, Korea, Luxembourg, Malaysia, Mexico, Netherlands, New Zealand, Norway, Philippines, Singapore, Sweden, Switzerland, Thailand, UK, USA, Venezuela.
identify countries holding above-investment-grade ratings in 1996 and switching to below-investment-grade in 1998. Points in the Northeast quadrant identify countries holding below-investment-grade ratings in 1996 and switching to
above-investment-grade in 1998.
The distinction between above-investment-grade and below-investment-grade (or speculative-grade) ratings is very important: besides affecting the cost at which issuers can borrow, ratings determine also the amount of the supply of funds. Specifically, statutes and regulations often forbid institutional investors to invest in assets carrying ratings below a certain level (Dale and Thomas, 1991): these assets are referred to as "below-investment-grade" or "speculative" assets. Thus, when an issuer receives a rating below-investment-grade, the number of potential investors significantly shrinks. In practice, such issuer will no longer face the demand from all investors. If the legal
restriction becomes binding for institutional investors, our below-investmnent-grade issuer
will have to rely only on the small fraction of investors to which such restriction does not apply.
A few facts stand out clear from Figure 3. Besides the downgradings of Brazil and Venezuela (in Latin America) and that of India, the sharpest downgradings affected the East Asian crisis countries: Indonesia, Korea and Thailand fell below investment grade and Malaysia came close to the threshold. Various papers have claimed that rating
agencies behaved procyclically,7 downgrading these countries' sovereign ratings
excessively with respect to their underlying fundamentals.
Downgradings were extensive not only for sovereigns but they amply affected the respective banking systems. This was an outcome to be expected if one considers that currency and banking crises tend to coincide in emerging economies (Kaminsky and Reinarth, 1999). However, the extent to which bank ratings dropped is astounding: the bank rating-transition Figure 4 shows this. Specifically, the dramatic fall brought below investment grade ratings for Korea, Malaysia and Thailand and worsened greatly those
for Indonesia as well.8
It was perhaps less easy to predict that (non-bank) corporate ratings would be severely downgraded as well. Yet, this is the evidence we gather from the non-bank rating-transition Figure 5.9 Corporate downgradings were sharpest in Indonesia, but they were sufficient to bring the average corporation below-investment-grade also in Korea and in Thailand.
Finally, it is worth noticing that sovereign ratings did show some upward revision in 1999, as soon as recovery started for East Asian crisis countries (Figure 6A), consistently with the hypothesis that the 1997-98 downgradings were excessive. This, however, did not translate equally rapidly in a relief for these countries' corporations (Figure 6B). Both the Korean and Thai sovereign ratings were brought back to
7 See, among the others, Ferri, Liu, and Stiglitz (1999); Monfort, and Mulder (2000).
8 Specifically, for each of the two years, we consider the year-minimum average-bank rating for the following 15 countries: Argentina, Brazil, Canada, China, Colombia, Denmark, Indonesia, Japan, Korea, Malaysia, Mexico, Philippines, Singapore, Sweden, Thailand.
9 Specifically, for each of the two years, we consider the year-minimnum average-non-bank rating for the 31 countries included in Figure 3.
investment grade in 1999, but this did not materialize as quickly for Korean and Thai corporations.
The main messages we derive from the descriptive evidence we just showed are that, in emerging economies, private sector ratings seem to greatly depend on the pattern of sovereign ratings. To the extent that sovereign ratings are procyclical, this directly entails that perverse swings in the cost of capital to the private sector will be amplified. This will be even more so should ratings be built into bank CARs, according to the new Basel proposal. Drawing these conclusions on the basis of descriptive analysis only is however improper. It is now time to turn to the econometric analysis to ascertain whether and to what extent private sector ratings show excess sensitivity to sovereign ratings in emerging economies.
5. The pattern of sovereign and individual ratings
We adopt an error correction model (ECM) in the spirit of Harvey (1981) and Hendry (1995). The error correction specification of the model allows us to capture not only the short-term dynamics of the relationship between private sector and sovereign ratings but also the long-term structure of such relation. The model that we estimate has the following specification:
1) ARatingi, = a +,/3AStvRatingi, + yRatingi t-l + SSovRatingi,,t- + Dummies+ ei,
where Rating i, is the private rating of firm i at time t; SovRatingi;, is the sovereign rating
in firm i's country at time t, a is the constant term, 131<1 and £ is the error term. Changes
in the variables are indicated by A. The coefficient of the long-terrn relationship is given
by -61y. The short-term (or immediate) impact of the sovereign rating on the individual
firm rating is ,B. In order to investigate the impact of sovereign up- and down-grading on individual firms in particular groups of countries, we also include a dummy for HICs. Other dummies include industry dummies.
The econometric approach we follow consists of estimating two panels of individual firm ratings-referred respectively as banks and non-banks--by examining their dependence on their countries' sovereign ratings over the period I 990-99.i1 The reason we opt to keep the bank ratings separate from the non-bank ratings has to do with the special role banking systems have come to play in emerging economies' crises. Namely, as stressed by Kaminsky and Reinhart (1999), in emerging economies, currency/balance of payments and banking crises tend to be "twin crises", in the sense that a banking crisis may trigger a currency crisis and vice-versa. Accordingly, particularly in the case of downgradings, we may well expect a strong relationship between sovereign and bank ratings, whereas, a priori, we should be agnostic on whether there is a strong link between sovereign and non-bank ratings. Several motivations for a close relationship between individual banks and sovereign ratings are also described in
1° The linear rule used to attribute numerical equivalents to ratings is likely to underestimate the strength of the relationship between rating changes at lower levels of ratings. An alternative non linear rule, based on the level of credit spreads associated to different levels of ratings, would highlight a stronger correlation between sovereign and non sovereign rating changes in NHICs, thus strengthening our findings.
Moody's (1999a, 1999b) methodology for assessing bank credit risk in emerging markets. " l
The two panels are unbalanced because not all firms have a rating for each year. The ratings we use are those attributed by Moody's. The basic statistics of the two panels are reported in Table 4. For each year, we attribute to each firm the minimum rating held during that year. In addition, in order to ascertain whether the hypothesized excess sensitivity of emerging economies' private sector ratings to changes in sovereign ratings is asymmetric, we dichotomize firm rating changes into positive (upgradings) and negative (downgradings). Our a priori is that the excess sensitivity might be stronger for negative than for positive changes.
5.1 The case of non-bank corporations
The non-bank corporation panel contains observations referring to 980 rated firms-rated in one or more years over 1990-99-from 40 countries.2 Tables 4 and 5 describe the composition of the sample in 1999, when we observe a rating for 895 of the
980 firms. Country-wise, 84.5 per cent of the firmns are based in high-income countries.
Sector-wise, approximately one third of the firms are utilities (oil; electric; telecom; water). The median rating is substantially higher in high-income countries (65 against 40); in low-income countries median firn ratings are closer to their respective sovereign ratings (40 to 52.5 against 65 to 100 for high-income countries). Median firm ratings are higher for most utilities and automotive firms; they are lower for firms in the metal
industry and in the service sector.
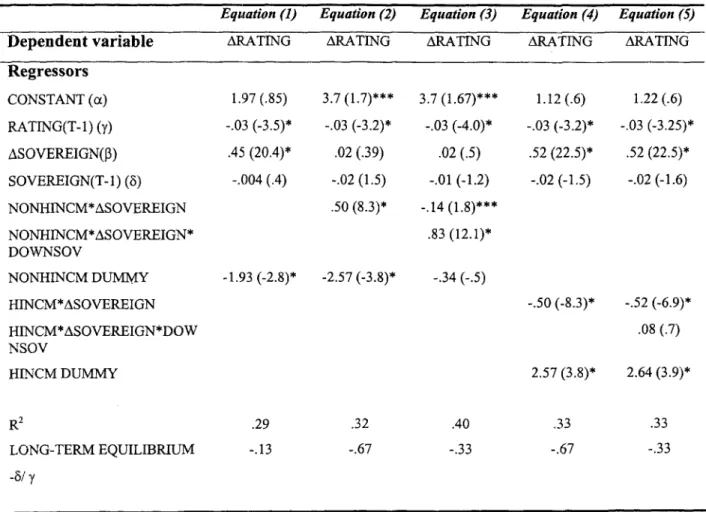
Table 6 reports the results of five different specifications of the panel regression.13
The first specification is the base one. Results show that non-bank ratings for firm i at time t are negatively related to rating changes for firm i at time t-1 (RATING(T-1)) and
are strongly positively related to sovereign rating changes at time t (ASOVEREIGN).1 4
i The relationship between sovereign ratings and ratings on domestic denominated instruments should be
looser than that for foreign currency denominated instruments (Moody's, 1999). No relationship should instead exist between Moody's Financial Strength Ratings -assessing the firm's stand-alone financial strength - and sovereign ratings. Our empirical analysis will be devoted to assess the relationship between sovereign ratings and ratings on long term bank deposits and debt issues of non-bank corporations.
12 Specifically, we consider the year-minimum sovereign rating for: Argentina, Australia, Austria, Belgium,
Brazil, Canada, Chile, China, Colombia, Czech Republic, Denmark, Finland, France, Germany, Greece
India, Indonesia, Ireland, Japan, Kazakhstan, Korea, Luxembourg, Malaysia, Mexico, Netherlands, New Zealand, Norway, Panama, Philippines, Poland, Portugal, Russia, Singapore, Spain, Sweden, Switzerland, Thailand, UK, USA, Venezuela.
13 All the regressions are run by OLS with random effects using RATS. The 18 dummies controlling for sector effects are not reported for convenience: they are generally not significant and omitting them doesn't qualitatively alter regression results. The fourth and fifth columns report the same specification as the second and third columns, respectively, the only change being that the specific effect is singled out for HICs instead than for NHICs.
14 We must point out that SOVEREIGN(T-1) is non-significant in the non-bank panel. This suggests that,
in our sample, we cannot identify a long-term relation between firm and sovereign ratings, although a short-term relation is still identified. As we will see below, this contrasts with what we find for the bank panel. Although we don't have a fully satisfactory explanation for this lack of a long-term relation between firm and sovereign ratings, we detect that the paucity of observations for NHICs' firms is more pronounced
Furthermore, the negative and significant coefficient of the dummy for NHICs (NONHINCM DUMMY) suggests that rating changes are generally smaller in size in these countries. Nevertheless, since these countries' rating levels are lower than for high-income countries, smaller-sized rating changes may still be larger in relative terms for non-high-income countries (NHICs).
The second specification adds the new variable NONHINCM*ASOVEREIGN, in order to check whether sensitivity to sovereign rating changes is larger for firms in NHICs. Results strongly support our priors: ASOVEREIGN is no longer significant while NONHINCM*ASOVEREIGN is significant and its positive coefficient is larger in size than the coefficient for ASOVEREIGN in the first specification (0.50 against 0.45). We interpret this as evidence that non-bank rating changes are sensitive to sovereign rating changes in NHICs but not in high-income countries.
The third specification includes the additional variable
NONHINCM*ASOVEREIGN*DOWNSOV, i.e. the variable singling out only sovereign
downgradings for NHICs.15 This is meant to check whether firm ratings in NHICs are
more sensitive to sovereign downgradings than to sovereign upgradings. Results are quite telling. On the one hand, NONHINCM*ASOVEREIGN becomes almost non-significant, its sign changes, and its coefficient shrinks (-0.14 in lieu of 0.50). On the
other hand, NONHINCM*ASOVEREIGN*DOWNSOV is significant and its coefficient
is even larger than the one for NONHINCM*ASOVEREIGN in the second specification (0.83 against 0.50). The fact that the R2 sizably increases indicates that this final specification improves on the previous one. This suggests that the excess sensitivity to sovereign rating changes is ample but it is by and large limited to sovereign
downgradings in NHICs. In practice, a 10-point--or two notches-sovereign
downgrading translates into a 6.9 point downgrading for NHICs' firms whereas it does not systematically affect non-bank ratings in high-income countries.
Finally, the specification of equations (2) and (3) are replicated for HICs. Their estimation shows the absence of short and long term relationships between sovereign and private sector ratings both in the upgrading and in the downgrading episodes.
in the non-bank panel than in the bank panel. This possibly precludes identification of the long-term relation in the non-bank panel.
15 To be sure, in our sample, most downgradings refer to NHICs. However, there are also downgradings for
HICs: e.g. Canada was downgraded in both 1994 and 1995, Denmark and Finland were downgraded in 1992, Japan was downgraded in 1998, New Zealand was downgraded in 1998, Sweden was downgraded in 1991, 1993 and 1995.
5.2 The case of banks
In order to highlight the difference between bank and non-bank ratings, we replicate the previous set of estimates also for banks. Although, in a large number of cases, bank deposit ratings are a mechanical reflection of sovereign ratings, it is useful to
verify to what extent this rule applies in equal measure to HIUCs and NHICs. The bank
panel contains observations referring to Moody's long term bank deposits ratings for 959 banks from 57 countries. Country-wise, 73.4 per cent of the banks are based in high-income countries holding a median rating equal to 80.4 (or just above Al), which compares with 44.5 (or just below Ba2) for rated banks in NHICs. This entails that bank ratings are generally higher than non-bank ones in both high-income and NHICs.
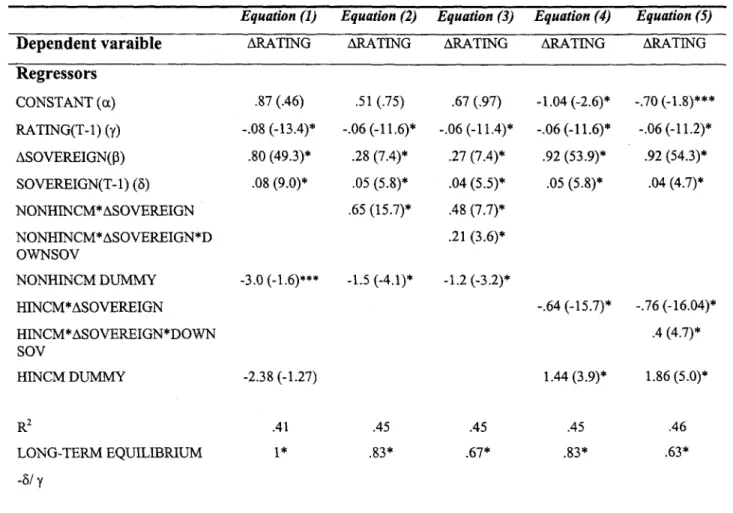
Table 7 reports the results for the same five specifications of the panel
regression'6 used for non-banks. The results of the first specification show that rating
changes for bank i at time t are negatively related to the rating of bank i at time t-1 (RATING(T-1)); they are strongly positively related to sovereign rating changes at time t (ASOVEREIGN) and they also depend positively on the level of sovereign ratings at time
t-1 (SOVEREIGN(T-1)).17 As in the non-bank panel, the negative and significant
coefficient of the dummy for NHICs (NONHINCM DUMMY) suggests that rating changes are generally smaller in their absolute size-but not necessarily in relative terms-in these countries.
Similar to the results obtained for non-banks, the second specification adds the new variable NONHINCM*ASOVEREIGN, in order to check whether sensitivity to sovereign rating changes is larger for banks in NHICs. Results are interesting. Although ASOVEREIGN is still significant, its coefficient drops from 0.80 to 0.28, while
NONHINCM*ASOVEREIGN is significant and exhibits a large coefficient (0.65). This
implies that bank rating changes are sensitive to sovereign rating changes in both high and NHICs but the sensitivity in the former countries is much smaller than in the latter countries (0.28 against 0.93).
In full conformity with the non-bank panel, the third specification includes the
additional variable NONHINCM*ASOVEREIGN*DOWNSOV, i.e. the variable singling
out only sovereign downgradings for NHICs. Although the results differ with respect to the non-bank panel, in qualitative terms they point to the same direction. First, ASOVEREIGN is still significant, and its coefficient doesn't change substantially with
respect to the second specification (0.27 instead of 0.28). Second,
NONHINCM*ASOVEREIGN is still significant too but its coefficient drops from 0.65 to
0.48. Third, NONHINCM*ASOVEREIGN*DOWNSOV is significant and its coefficient
16 Specifically, we consider the year-minimum rating for the banks of the following 57 countries:
Argentina, Australia, Austria, Belgium, Brazil, Canada, Chile, China, Colombia, Czech Republic, Denmark, Ecuador, Egypt, Estonia, Finland, France, Germany, Greece, Hungary, Iceland, India, Indonesia, Ireland, Italy, Japan, Jordan, Kazakhstan, Korea, Lebanon, Luxembourg, Malaysia, Malta, Mauritius,
Mexico, Morocco, Netherlands, Norway, Oman, Pakistan, Panama, Peru, Philippines, Poland, Portugal, Romania, Russia, Singapore, Slovak Republic, Slovenia, Spain, Sweden, Switzerland, Taiwan, Thailand,
Tunisia, Turkey, UK, USA.
17 As noted above, here we can identify a long-term relation between bank and sovereign ratings, which is equal to 1 in the first specification, to 0.83 in the second, and to 0.67 in the third.
is sizable (0.21). Finally, equations (4) and (5) replicate the above specifications for high-income countries as well.
These results may be interpreted as follows. Bank ratings are a function of sovereign ratings both in high and in NHICs. Nevertheless, ratings of NHICs' banks exhibit higher short term sensitivity to changes in their sovereign ratings, and such
sensitivity is noticeably asymrmetric: namely, it is larger for sovereign downgradings than
for sovereign upgradings. In practice, a 10-point--or two notches-sovereign rating change translates into a 2.7 point rating change for high-income countries' banks and into a 7.5 point rating change for NHICs' banks. In addition, a 10-point sovereign rating downgrading would imply a 9.6 point downgrading for NHICs' banks, as opposed to 5.6 point for HICs.
While the observed clynamics of rating changes may be the hardly avoidable consequence of the informational constraints with which rating agencies are confronted in their activity, we claim that it is important to avoid that such dynamics could induce undesired pro-cyclical patterns on bank capital requirements. More so when this feature may be a peculiar feature of less developed economies.
6. The simulated impact on the CARs of crisis countries
Using the coefficients estimated above, it is possible to offer an appraisal of how national banking systems would be affected by sovereign downgradings, should the newly proposed weights apply. It would be presumptuous to claim that our simulations provide a precise estimation of the impact of sovereign downgradings on the availability and the cost of capital in the countries we analyze. Sovereign downgradings, in fact, happen along with significant changes in the way countries are perceived by markets and there may be several channels through which such changes affect international investors' attitudes towards affected countries. Nevertheless, we deem it illustrative to present some simulations based on the application of our previous findings to actual cases of sovereign downgradings materialized in recent years.
The approach we adopt runs as follows. First, we identify a numnber of countries,
which experienced a sovereign downgrading in recent years. These include six NHICs (Brazil, Colombia, India, Korea, Malaysia, and Mexico) for both the bank and the non-bank simulation, together with five high-income countries (Canada, Finland, Japan, New Zealand, and Sweden) for the non-bank simulation and four high-income countries (Finland, Italy, Japan, and Sweden) for the bank simulation. Second, we define two different simulations based on the estimated impact of the sovereign downgrading on banks and on non-banks. The spirit of the former simulation is that, due to their sensitivity to sovereign rating changes, the country's banks will also be downgraded. In turn, when this implies a higher weighting of interbank exposures vis-a-vis these banks, other domestic or international banks lending to them will have to step up their CARs and the downgraded country's banks will likely experience a worsening in the availability and/or cost of interbank credit. The second simulation assesses how the affected country's bank CARs would change with the sovereign downgrading under the
hypothesis that domestic banks were lending just to the domestic non-bank corporations
for which we observe a rating in the pre-crisis year.18
In practice, we use the estimated values of the coefficients linking sovereign downgradings to bank and non-bank downgradings-respectively from Tables 6 and 7-separately for high-income and NHICs. We then multiply these values by the entity of the observed sovereign downgrading. The resulting downgrading is applied to the pre-crisis individual bank and non-bank ratings in the affected country. Depending on whether or not this implied downgrading leads to a change of CAR weight class for some of the domestic rated banks or non-banks, implied CARs will increase or stay the same. Of course, given the size of the estimated coefficients, our a priori is that implied CARs will more likely increase in NHICs.
The results of the bank downgrading simulation are shown in Figures 7A and 7B, depicting, respectively, the case for non-high-income and high-income countries; Figure 7A shows that interbank CARs would have stayed constant at 8 per cent in the case of the three downgradings-each by two notches, or 10 points in the numeric scale-of Colombia, India, and Mexico. On the contrary, interbank CARs would have increased substantially in the two-notch downgrading of Brazil (from 8 to 12 per cent), in the four-notch downgrading of Malaysia (from 1.6 to 4 per cent), and in the six-four-notch downgrading of Korea (from 2.8 to 7.3 per cent). Figure 7B detects no change for any of the high-income downgradings: interbank CARs stay put at 1.6 per cent in all four cases.
Figures 8A and SB-respectively for non-high-income and high-income countries-depict how non-bank downgradings would have affected domestic banks' CARs. Contrary to the case of the interbank CARs, in this simulation domestic bank CARs increase also for most high-income countries: they remain constant at 1.8 per cent in the downgrade of New Zealand, but they increase from 3.3 to 3.8 per cent for Canada, from 2.4 to 3.2 per cent for Finland, from 3.7 to 4.1 per cent for Japan, and from 2.8 to 3.1 per cent for Sweden (Figure 8B). Nevertheless, even in this case, CAR increases are by far more pronounced for NHICs (Figure 8A). The only exception is Mexico, whose bank CARs increase form 7.3 to 8 per cent. Brazil increases from 7.4 to 8.9 per cent; Colombia from 7 to 10 per cent; India and Malaysia double, respectively, from 4 to 8 per cent and from 1.6 to 4 per cent; Korea triples from 1.9 to 5.7 per cent.
All in all, these illustrative simulations may offer a simple device to assess the impact on bank capital requirements of different regulatory schemes, without using the individual ratings but simply making use of the observed patterns of sovereign ratings and of the level of national income. In addition, given the limited number of available individual ratings for NHICs, we can provide estimates of the impact which could be
expected from the perspective increase in the number of rated entities. In our case we have shown that a sovereign downgrading has little or no impact at all for bank CARs in
high-income countries, whereas it induces ample swings for bank CARs in NHICs19. In
turn, this implies that the new Basel proposal would exacerbate the volatility of bank
18 In order to simplify our computations, we make the further assumption that domestic bank loans are
uniformly distributed among these rated corporations.
19 For the case at hand the same result could have been obtained - with a loss of generality - computing the observed changes of individual ratings for every single country.
CARs in emerging economies. Considering the direct impact of increased bank CARs and the additional institutional feature that emerging economies' banks would need to tap less developed financial markets to raise the needed capital, the new Basel proposal could considerably worsen the availability and cost of credit to these countries' private sector.
In turn, even a temporary worsening in their access to bank credit could have a negative impact on corporate sectors in emerging economies-e.g. amplifying corporate bankruptcies and holding corporate production constrained below potential. This would provoke a depletion of orgaiiizational capacity in emerging economies' corporate sectors with potential long-lasting (letrimental consequences for these economies' recovery Greenwald and Stiglitz (1993).
7. Conclusions
In this paper historical data on sovereigns and individual borrowers ratings are used to examine what would be the effect on less developed countries of the introduction of a link between bank Capital Asset Requirements and external ratings, as contemplated in the new Basel proposal.
We find that the Base.l proposal would increase the volatility of capital needs of banks in NHICs versus high-income countries' banks. In fact, bank and corporate ratings in NHICs appear to be strongly related and in an asymmetric way to changes in sovereign ratings. A sovereign downgrading would, for instance, imply larger changes in capital allocations than an upgrading and would call for larger capital requirements at the very time in which access to capital markets is more difficult. In addition, the lack of a widespread use of ratings for banks and corporations in NHICs would not provide an
effective incentive to adopt nmore sound risk assessments on the part of banks. In fact,
while good banks in HICs would see their capital requirements reduced as a consequence of a prudent lending behavior, their peers in NHICs would not draw an equivalent benefit from an analogous attitude.
As a result of these empirical findings, especially in the case of NHICs, we encourage the adoption of an integrated approach, in which the use of rating agencies' assessments for the definition of capital requirements is supplemented by a larger set of regulatory tools.
References
Basel Committee on Bank Supervision (1999) "Consultative paper on the Basel Capital Accord", Basel, June.
Cantor, R. and F. Packer (1994), "The Credit Rating Industry", Federal Reserve Bank of New York Quarterly Review, Summer-Fall, 1-26.
Cantor, R. and F. Packer (1996), "Detreminants and Impacts of Sovereign Credit Ratings", Economic Policy Review, Federal Reserve Bank of New York, Vol. 2 (October) pp. 37-53.
Dale, R.S., and S.H. Thomas (1991), "The Regulatory Use of Credit Ratings in International Financial Markets", Journal of International Securities Markets, Spring, 9-18.
Ferri, G., L. Liu, and J.E. Stiglitz (1999), "The Procyclical Role of Rating Agencies: Evidence from the East Asian Crisis", Economic Notes.
Greenwald, B., and J.E. Stiglitz (1993), "Financial Market Imperfections and Business Cycles", Quarterly Journal of Economics, vol. 108, pp. 77-114.
Harvey (1981), The Econometric Analysis of Time Series, Philip Allan Publishers Limited.
Hendry (1995), Dynamic Econometrics: Advanced Econometric Text, Oxford University Press.
Kaminsky, G.L., and C. Reinhart (1999), "The Twin Crises: The Causes of Banking and Balance-of-Payments Problems", American Economic Review.
Kuhner, C. (1999), "Rating Agencies: Are They Credible? - Insights Into the Reporting Incentives of Rating Agencies in Times of Enhanced Systemic Risk", University of Munich, mimeo.
International Monetary Fund (1999), International Capital Markets: Developments, Prospects and Key Policy Issues, September.
Monfort, B., and C. Mulder (2000), "The Impact of Using Sovereign Ratings by Credit Rating Agencies on the Capital Requirements for Banks: a Study of Emerging Market Economies", IMF working paper, WP/00/69, March.
Moody's Investors Service (1999a), Rating Methodology - Bank Credit Risk: An Analytical Framework for Banks in Developed Markets, April.
Moody's Investors Service (1999b), Rating Methodology - Bank Credit Risk in Emerging Markets: An Analytical Framework, July.
Partnoy, F. (1999), "The Siskel and Ebcrt of Financial Markets: Two Thumbs Down for the Credit Rating Agencies", University of San Diego School of Law, mimeo.
Table 1: Moody's and S&P alphanumeric ratings conversion into numeric values
MOODY'S S&P NUMERIC EQUIVALENT
Aaa AAA 100 Aal AA+ 95 Aa2 AA 90 Aa3 AA- 85 Al A+ 80 A2 A 75 A3 A- 70 Baal BBB+ 65 Baa2 BBB 60 Baa3 BBB- 55 Bal BB+ 50 Ba2 BB 45 Ba3 BB- 40 Bi B+ 35 B2 B 30 B3 B- 25 Caal From CCC+ to CCC- 20 Caa2 CC 15 Caa3 C 10 Caa D 5
Table 2: S&P's scope of coverage and median rating by income category groups')
Number of ratedfirms Median grade
Banks Non Banks Banks Non Banks
GIO 478 3712 80 60
HighIncomenonG10 131 343 75 70
Upper Middle Income 104 196 45 45
Low Middle Income 91 82 45 35
l) Figures refer to S&P scope of coverage and ratings based on the November 1999 CD Rom.
Table 3: The newly proposed weights for bank capital asset requirements
Rating Level Proposed Risk Weight
Interbank Loans
S&P Moody's Moody's Sovereign Option I (1) Option 11(2) (3) Corporate numeric
AAA to AA- Aaa to Aa3 100 >= R>=85 0% 20% 20% 20%
A+ to A- Al to A3 85> R >=70 20% 50% 20% 20% BBB+ to BBB- Baal to Bal 70> R>=50 50% 100% 50% 50% BB+ to B- Bal to B3 50>R>=25 100% 100% 100% 100% Below B- BelowB3 25>R 150% 150% 150% 150% Unrated Unrated 100% 100% 100% 100% 1988 Accord OECD 0% 20% 20% 100% Non-OECD 100% 100% 20% (4) 100%
(1) Risk weighting based on the weighting of the sovereign of the country in which the bank is incorporated (2) Risk weighting based on assessment of individual bank, which is assumed here to be the highest possible.
The risk weight is 50% for unrated banks unless capped by the sovereign rate.
(3) For short-term claims the risk weight of the individual bank is one category more favorable. The proposed accord defines short-term as six months maximum.
(4) Short-term loans. The 1988 Accord defines short-term as one year maximum.
Table 4: Description of the 1999 bank and non-bank samples with median ratings')
Number (& %) of ratedfirms Median grade Sovereign
Banks Non Banks Banks Non Banks Rating
Australia 11 (1.1%) 36 (4.0%) 77 75 95 Austria 7 (0.7%) 4 (0.4%) 86 80 100 Belgium 7 (0.7%) 7 (0.8%) 85 80 95 Canada 10 (1.0%) 99 (11.0%) 85 60 92.5 Denmark 4 (0.4%) 3 (0.3%) 80 85 97.5 Finland 6 (0.6%) 8 (0.9%) 78 62.5 100 France 88 (9.2%) 31 (3.4%) 84 70 100 Germany 38 (4.0%) 13 (1.5%) 92 80 100 Greece 9 (0.9%) 5 (0.6%) 61 35 75 Iceland 2 (0.2%) n. a. 70 n. a. 92.5 Ireland 7 (0.7%) 4 (0.4%) 79 20 100 Italy 27 (2.8%) n. a. 76 n. a. 85 Japan 59 (6.2%) 138 (15.3%) 72 60 95 Luxembourg 6 (0.6%) 6 (0.7%) 85 75 100 Netherlands 8 (0.8%) 108 (12.0%) 93 70 100 New Zealand n. a. 10 (1.1%) n. a. 90 95 Norway 4 (0.4%) 8 (0.8%) 73 90 100 Portugal 5 (0.5%) 2 (0.2%) 72 92.5 90 Singapore 6 (0.6%) 6 (0.7%) 80 72.5 97.5 Spain 21 (2.2%) 6 (0.7%) 83 80 90 Sweden 8 (0.8%) 15 (1.7%) 83 70 92.5 Switzerland 9 (0.9%) 7 (0.7%) 91 90 100 UK 27 (2.8%) 140 (15.5%) 84 70 100 USA 335 (34.9%) 106 (11.7%) 80 65 100
Total high-income countries 704 (73.4%) 762 (85.0%) 80.4 65 100
Argentina 13 (1.4%) 27 (3.0%) 36 40 40 Brazil 28 (2.9%) 14 (1.6%) 25 30 25 Chile 11 (1.1%) 14 (1.6%) 63 65 72.5 China 15 (1.6%) 2 (0.2%) 60 55 70 Colombia 6 (0.6%) 2 (0.2%) 47 25 52.5 Czech Republic 6 (0.6%) 1 (0.1%) 60 65 72.5 Ecuador 2 (0.2%) n. a. 22 n. a. 25 Egypt 7 (0.7%) n. a. 45 n. a. 57.5 Estonia 3 (0.3%) n. a. 54 n. a. 72.5 Hungary 6 (0.6%) n. a. 52 n. a. 65 India 8 (0.8%) 3 (0.3%) 46 45 45 Indonesia 12 (1.3%) 8 (0.8%) 30 20 25 Jordan 3 (0.3%) n. a. 35 n. a. 40 Kazakhstan 3 (0.3%) 1 (0. 1%) 31 35 35 Korea 18 (1.9%) 8 (0.8%) 48 50 60 Lebanon 4 (0.4%) n. a. 30 n. a. 35 Malaysia 5 (0.5%) 3 (0.3%) 59 55 55 Malta 2 (0.2%) n. a. 72 n. a. 70 Mauridus I (0.1 %) n. a. 60 n. a. 67.5 Mexico 10 (1.0%) 28 (3.1%) 40 35 52.5 Morocco 4 (0.4%) n. a. 45 n. a. 50 Oman 4 (0.4%) n. a. 55 n. a. 60 Pakistan 4 (0.4%) n. a. 16 n. a. 20 Panama 3 (0.3%) 2 (0.2%) 53 42.5 50 Peru 4 (0.4%) n. a. 32 n. a. 47.5 Philippines n. a. 8 (0.8%) n. a 47.5 52.5 Poland 8 (0.8%) 1 (0.1%) 48 55 65 Romania 4 (0.4%) n. a. 26 n. a. 22.5 Russia 12 (1.3%) 2 (0.2%) 19 10 5 Slovak Republic 3 (0.3%) n. a. 47 n. a. 55 Slovenia 2 (0.2%) n. a. 55 n. a. 77.5 Taiwan 10 (1.0%) n. a. 72 n. a. 85 Thailand 10 (1.0%) 6 (0.7%) 47 50 57.5 Tunisia 8 (0.8%) n. a. 50 n. a. 60 Turkey 16 (1.7%) n. a. 32 n. a. 35 Venezuela n. a. 3 (0.3%) n. a. 30 25
Total non-high-income countries 255 (26.6%) 133 (15.0%l/) 44.5 40 52.5 Grand Total 959 (100.0%) 895 (100. 0%) ... 65 95 Data are derived from Moody's public database. Ratings are converted to numeric according to the conversion scale in Table i.
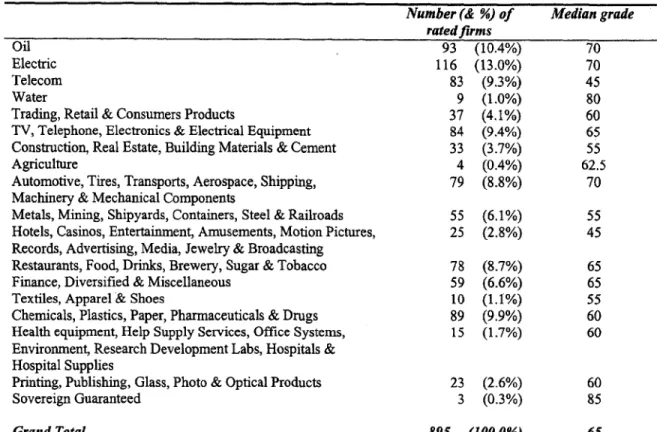
Table 5: Description of the 1999 non-bank sample by sector with median ratings'1
Number (& Y) of Median grade
rated firms
Oil 93 (10.4%) 70
Electric 116 (13.0%) 70
Telecom 83 (9.3%) 45
Water 9 (1.0%) 80
Trading, Retail & Consumers Products 37 (4.1%) 60
TV, Telephone, Electronics & Electrical Equipment 84 (9.4%) 65
Construction, Real Estate, Building Materials & Cement 33 (3.7%) 55
Agriculture 4 (0.4%) 62.5
Automotive, Tires, Transports, Aerospace, Shipping, 79 (8.8%) 70
Machinery & Mechanical Components
Metals, Mining, Shipyards, Containers, Steel & Railroads 55 (6.1%) 55
Hotels, Casinos, Entertainment, Amusements, Motion Pictures, 25 (2.8%) 45
Records, Advertising, Media, Jewelry & Broadcasting
Restaurants, Food, Drinks, Brewery, Sugar & Tobacco 78 (8.7%) 65
Finance, Diversified & Miscellaneous 59 (6.6%) 65
Textiles, Apparel & Shoes 10 (1.I%) 55
Chemnicals, Plastics, Paper, Pharmaceuticals & Drugs 89 (9.9%) 60
Health equipment, Help Supply Services, Office Systems, 15 (1.7%) 60
Environment, Research Development Labs, Hospitals & Hospital Supplies
Printing, Publishing, Glass, Photo & Optical Products 23 (2.6%) 60
Sovereign Guaranteed 3 (0.3%) 85
Grand Total 895 (100.0Y) 65
1) Data are derived from Moody's public database. Ratings are converted to numeric according to the conversion scale proposed in Table 1.
Table 6: Regression results on non-banks
Equation (1) Equation (2) Equation (3) Equation (4) Equation (5)
Dependent variable ABATING ARATING ARATING ARATING ARATING
Regressors CONSTANT (a) 1.97 (.85) 3.7 (1.7)*** 3.7 (1.67)*** 1.12 (.6) 1.22 (.6) RATING(T-1) (y) -.03 (-3.5)* -.03 (-3.2)* -.03 (-4.0)* -.03 (-3.2)* -.03 (-3.25)* ASOVEREIGN(3) .45 (20.4)* .02 (.39) .02 (.5) .52 (22.5)* .52 (22.5)* SOVEREIGN(T-1) (o) -.004 (4) -.02 (1.5) -.01 (-1.2) -.02 (-1.5) -.02 (-1.6) NONHINCM*ASOVEREIGN .50 (8.3)* -.14 (1.8)*** NONHINCM*ASOVEREIGN* .83 (12.1)* DOWNSOV NONHINCM DUMMY -1.93 (-2.8)* -2.57 (-3.8)* -.34 (-.5) HINCM*ASOVEREIGN -.50 (-8.3)* -.52 (-6.9)* HINCM*ASOVEREIGN*DOW .08 (.7) NSOV HINCM DUMMY 2.57 (3.8)* 2.64 (3.9)* R2 .29 .32 .40 .33 .33 LONG-TERM EQUILIBRIUM -.13 -.67 -.33 -.67 -.33
Note: t statistics reported in parentheses. *, **, *** indicate 1%, 5%, 10% statistical significance levels, respectively. ARATING: First difference of individual firm rating.
RATING(T- 1): Lagged individual firm rating. ASOVEREIGN: First difference of sovereign rating. SOVEREIGN(T- 1); Lagged sovereign rating. NONHINCM: Non-High-Income country dummy.
DOWNSOV: Sovereign downgrading dunmmy. HrNCM: High-income country durmmy.
Table 7: Regression results on banks
Equation (1) Equation (2) Equation (3) Equation (4) Equation (5)
Dependent varaible ARATING ARATING ARATING ARATING ARATING
Regressors CONSTANT (cx) .87 (.46) .51 (.75) .67 (.97) -1.04 (-2.6)* -.70 (-1.8)*** RATING(T-1) (y) -.08 (-13.4)* -.06 (-11.6)* -.06 (-11.4)* -.06 (-11.6)* -.06 (-11.2)* ASOVEREIGN(,B) .80 (49.3)* .28 (7.4)* .27 (7.4)* .92 (53-9)* .92 (54.3)* SOVEREIGN(T-1) (6) .08 (9.0)* .05 (5.8)* .04 (5.5)* .05 (5.8)* .04 (4.7)* NONHINCM*ASOVEREIGN .65 (15.7)* .48 (7.7)* NONHINCM*ASOVEREIGN*D .21 (3.6)* OWNSOV NONHINCM DUMMY -3.0 (-1.6)*** -1.5 (-4.1)* -1.2 (-3.2)* HINCM*ASOVEREIGN -.64 (-15.7)* -.76 (-16.04)* HINCM*ASOVEREIGN*DOWN .4 (4.7)* soV HINCM DUMMY -2.38 (-1.27) 1.44 (3.9)* 1.86 (5.0)* R2 .41 .45 .45 .45 .46 LONG-TERM EQUILIBRIUM 1* .83* .67* .83* .63* -8/ y
Note: t statistics reported in parentheses. *, * *** indicate 1%, 5%, 10% statistical significance levels, respectively. ARATING: First difference of individual firm rating.
RATING(T-1): Lagged individual firm rating. ASOVEREIGN: First difference of sovereign rating. SOVEREIGN(T-1); Lagged sovereign rating. NONHINCM: Non-High-Income country dummy. DOWNSOV: Sovereign downgrading dummy. HINCM: High-income country dummy.
Figure 1: Relative rating distribution Section a. GI0 0.80 . 0. 70
.4
0.60. °060
--__
--- --
--
--
-- --
--
--
--
---
----
--
--
--
--
--
--
--
--
--
--
---
---
--
--
--
---
--
--
--
--
--- ---
--
---
-- ---
_
---
--
--- ---
--
-0 .2 -0 - - -- -- - -- -- - - ----.-* Sovereign C] Banks. EbN-Banks
Section b. High In come Non G10
0.35 0325
4
0 .1 5 A ---- ------0.10
---
---
---
--
---
---
-- -
-&--
---
----°°o00
a-,-L
t-
.1_V
1,-
I
C)I @ i? bRf @ ;:t @ St 0@ 90 w*Sovereign o Banks * Non-Banks
s)Iue88uON s)uSNU ° U6!9J8AOSE
00,
p 0t 0 000 09) Ocy 0 0i __ 00 0
.
1-
-S£0--- --- --- --- --- ---~ ~ ~~~~ Ot" 0b
aWO-ulh M07 alPP!kV' p UO!BaS
SlueO-UON E S)jUe9 0 U6ieaJAoS U
---
----
---
--
---
-- -- -- -- -
---
---
----
---
,
- -' ---
--
---
---
--
--
--
--
--
--
--
---
--
--
'---
- 9
01 0
V°
.
.--
- - - -- - - -- - -o -0 9 o
---. S~~~~~~~~~~~~~~~~~~~ £ 0
awuoujI d/pp!JtA addf -a uois i uo!lnq!plsip utuJ aAlla-d :1 ajn;li
Figure 2A: Capital adequacy ratio change for non bank loans
Section a. Distribution of CAR change for non banks loans
600 3369 500 1 . -581 400A
2
0
0
t-
--
---
---
---
---
----
--- ---
---
- --- ---
---300~~~153 I64 108 112 1004
-5S 52- ~ ~~~~~~-30-~ 0) _ _ _!!lII -6.4 0 4H OECD a High Income Non OECD
3 Upper Middle Income o Middle Low Income
Section b. Average CAR change for non bank loans
1 .5 0 .}.
1.00
0 .00 . , .-- , ._,__
|EGD H gh Income Non Upper Middle Middle Low
-.50 OECD Income Income
-1.00 -.
-1.50 -2.0 0 l_____
wJaO Buol c030 UON 3 WiJUIJOqS 03 0 UONM
-- -6 w- u i- A--- -6 bbu --- 032 i UbON - ---- ---- --- 00'
MO1 alPP!W GI addn GWOOLA I6!H I320
E9 I --
, I00
0
T= |~~~~~] 1 . ~~~~~00 1 ;
O 00 9
-- 00*8
SUnol yrwq Jof a2Urnf yVD a2wa V 'q uo0zoa5
EDUOOUI MOl GlPP!N a awooul Ilpp!WV jaddn la
3030 UON GWOOUI 16!H * C030O
0t Li|. SEO
1"N tl' 9 tl' z 0
0 9 I.
--- £Dz
081
ooz
SUvoj1 tuvq iofa9'urn &Irnfoi uop}nq74S?Q 2VU7}
sueol auieq ioj aSuln op!l Xtenbape pe!dwj :a
aln
Figure 3:
THE IMPACT OF THE 1997-98 CRISES: 1998 VS. 1996 SOVEREIGN RATINGS
Aaa
Aa2 Al A3
_ Baa2
Iin vestment grade 1998
u Bal speculative grade 1998 - -.
Thailand Korea a,Ba3 B2 Venezuela Indonesia Brazil Caal speculative Investment
Caa3 grade 1996 grade 1996
Caa3 Caal B2 Ba3 Ba1 Baa2 Ai Al Aa2 Aaa
196 SOVEREIGN RATINGS
Figure 4:
THE IMPACT OF THE 1997-98 CRISES: 1998 VS. 1996 AVERAGE BANK RATINGS
Aaa
Aa2
Al A3
o Baa2 innvestment grade 1998
2
Sal speculative grade 1998 *Malaysb
Ethalland
82
Bra1 Il z/< Indonesia * Korea
Caai
speculative investment
Caa3 grade 1996 grade 1996
Caa3 Cail 132 Ba3 Ba1 1aa2 Ai Ai Aa2 Aaa 1996 BANK RATINGS
Figure 5:
THE IMPACT OF THE 1997-98 CRISES: 1998 VS. 1996 AVERAGE NON-BANK RATINGS
Aaa AaZ Al A3 gn 0
Baa2 t investment grade 199Malaya
z Bal speculative grade 1998 Kosea
Thalland Z Ba3 / < ;/ ~~~~~~~~~~~~~~~tindia Sa3 52 Venezuela Caal speculativo investment
Indonesia* grade 1996 grade 1996
Caa3
-Caa3 Caal B2 Ba3 Ba1 Baa2 A3 Al AaZ Aaa
1968 NON-BANK iRATINGS
Figure 6A:
THE IMPACT OF THE RECOVERY: 1999 VS. 1998 SOVEREIGN RATINGS
Aaa A * Aa2 Al-A,1 .Chil A3 ' China Saa2 ~~~~~~~~~~~~~~~~Korea Z Baa2 .
Tinvestment grade 1999 Korea a ia
z Mexico 4
0 Bal speculative grade 1998 olombia
0 0 Ba3 B2 Caal speculative investment grade 1998 grade 1998 Caa3
Caa3 Caal B2 Ba3 Bal Baa2 A3 Al Aa2 Aaa 1998 SOVEREIGN RATINGS
Figure 6B:
THE IMPACT OF THE RECOVERY: 1999 VS. 1998 AVERAGE NON-BANK RATINGS
Aaa A Aa2 Al A3 Z Baa2 Tinvestment grade 1999
_ Bal speculative grade 1998
e2 Thailand 0, 82 Caa1l speculative investment grade 1998 grade 1998 Caa3 Indonesia
Caa3 Caal B2 Ba3 Sal Saa2 A3 Al Aa2 Aaa 1998 NON-SANK RATINGS
Figure 7A:
SIMULATED NEW BASLE BANK CARs AGAINST LOANS TO RATED BANKS IN SIX DOWNGRADED EMERGING ECONOMIES
14.0% 12.0% 12.0% 10.0% 8.0% 8.0% 8.0% 8.0'% 8.0% 8.0% 8.0% 8.0% 73 6.0% 4.0 |% 4.0% 2.% 2.0% 1.6%
0.0%.-K- (-30; 1996-94) MWalysia(-20: 1996-9B) Mexic(-1O 1994-95) BW.4il(.10 1997-98) Co01-bia(-.o: 199899) 1di.(.IO- 1997-9F)
j Pre-Crisis m Post-Crisis
Figure 7B:
SIMULATED NEW BASLE CARS AGAINST LOANS TO RATED BANKS IN FOUR DOWNGRADED HIGH INCOME OECD COUNTRIES
1.8% 1.6% 1.6% 1.6% 1.6% 1.6% 1.6% 1.6% 1.6% 1.6% 1.4% 1.2% 1.0% 0.8% 0.6% 0.4% 0.2% 0.0%
Finland (-5, 1991-92) Italy (-10. 1991-92) Japan (-5, 1998-99) Sweden (-5, 1992-93)
erroi, LPore-Clss is post-Conrisim s