CHAPTER 24
NOISE TRADING AND BEHAVIOURAL FINANCE
The objective of this chapter is to provide knowledge of the implications of noise trading and behavioural finance for market efficiency, particularly in regard to:
1. The role of rumours in financial markets. 2. Under-reaction to news.
3. Over-reaction to news. 4. Inaccurate perceptions of risk. 5. Moods and emotions.
6. The adaptive markets hypothesis.
---
One of the assumptions of the Efficient Market Hypothesis is that, in aggregate, market participants behave in a rational manner. There are lines of reasoning that suggest that irrational behaviour can have significant impacts on financial markets. The concepts of noise trading and behavioural finance suggest that individual market participants do not consistently behave rationally.
Noise Trading and Rumours
Fisher and Statman (2004) distinguish between information traders and noise traders. Information trading is driven by the fundamental values of stocks (and other securities) whereas noise trading is driven by sentiment (Shefrin and Statman 1994). In an efficient market there are only information traders and value alone determines prices. Noise traders can move prices away from fundamental value and render markets inefficient. According to Fisher and Statman stock markets are in a bubble when bullish sentiment moves prices above fundamental value and in a negative bubble when bearish sentiment pushes prices below fundamental value.
Roll (1988a) found that value-related news explained only 35% of the variation in monthly stock returns and Fair (2002) found that many large price changes occurred in the absence of value-related news. Noise traders appear to have a substantial impact on price movements. Bullish noise trading can drive prices higher as fundamental value falls, and bearish noise trading can push prices down even when fundamental value rises. When a market movement occurs in the absence of value-related news,
the market movement becomes the news. Investors may react to such price changes on the grounds that they reveal how other investors are thinking. In particular it may be assumed that other investors know something, or understand something, that justifies the market movement and an informational cascade ensues with investors copying each other. Fama and French (2004a) showed that unless noise traders (stupid or misinformed investors) exactly cancel each other out there would be a noise trader effect on prices. Unless there is a mistaken overpricing to offset every mistaken under-pricing, the mistakes affect prices.
A noise trader uses irrelevant, or inaccurate, information when making investment decisions. One type of unreliable information, on which noise traders may base their trades, is rumour. However rumours may even affect professional traders. If trading on rumour is regarded as noise trading, then even market professionals are sometimes noise traders. Even respected financial newspapers and magazines participate in the spreading of rumours, and websites are an abundant source of rumours.
For financial market traders to profit from new information, they must act on the news before other traders. There is pressure to respond quickly. There may not be time to check on the accuracy of a rumour before acting on it. As a result even competent professionals may engage in noise trading. Pressure to act quickly is likely to engender anxiety and stress, which renders people more susceptible to accepting rumours. It is not always possible to know whether a piece of information is good or bad. One of the behavioural finance heuristics is the dilution heuristic according to which use of poor information can dilute the use of good information, and hence noise trades can crowd out information trades.
Kimmel (2004) points out that rumours emerge in conditions of uncertainty, which are frequent in financial markets. Rumours are particularly prone to emerge when emotions, especially feelings of fear, are high. In a situation of change people may be unable to understand the changes. The resulting uncertainty generates fear and the need for information relevant to the future. Uncertainty about the future creates stress, and interacts with stress, to produce a need for information which can be used to guide actions.
Rumours are more likely to circulate if they are credible. Rumours received from trusted sources are more likely to be believed. In addition to the plausibility, and source, of a rumour its frequency of repetition affects its acceptability. The more often a rumour is heard, the more likely it is to be believed. Repetition fosters belief. Olsen (2008a) pointed out that information which is disputed is less likely to be accepted.
It appears that in financial markets the most prevalent rumours concern short-term events; it is the immediate future that is of greatest concern. Kimmel and Audrain (2002) found that the number of rumours was related to the importance of their content, to the accuracy of previous rumours, and to levels of anxiety. They also found that rumours, which subsequently turned out to be true, became more precise over time. In contrast, false rumours became increasingly distorted.
Rumours, true or false, have an impact on market prices. For example DiFonzo and Bordia (1997) showed that rumours affect investment decisions, even when the rumours come from sources that lack credibility. They found that price changes resulting from rumours tend to follow trends that exhibit persistence. There is evidence that people make decisions based on stories constructed around
information, rather than on the information itself (Mulligan and Hastie, 2005). If a rumour is consistent with such a story, or provides a story (an explanation of events), it may be more readily believed. People are prone to accept information from unreliable sources if such information is believable and consistent with their existing perceptions of events (Evans and Curtis-Holmes, 2005). Apart from their specific ‘information’ content rumours can have a further effect on markets by influencing market sentiment. Rumours can generate feelings of optimism or pessimism.
Some researchers have considered the role of the media in the provision of stock market information, and in particular whether the media provides good information or noise. Tetlock (2007) found that media optimism/pessimism could influence market prices but that the effects were subsequently eliminated, which was interpreted as suggesting that the information conveyed was noise. Noise was seen as having a merely temporary effect on prices. Media pessimism was followed by price falls, which were subsequently reversed. The falls were larger, and lasted longer, in the case of the stocks of smaller companies. This latter point was interpreted as indicating that small investors were most
strongly affected by the media. This view was based on the grounds that the stocks of smaller companies tend to be held by private individuals.
Liden (2006) investigated the value of stock recommendations from newspapers and magazines. It was found that, although the overall value of the information was about zero, there was a difference between buy and sell recommendations. Sell recommendations tended to be useful indicators; they contained good information. Buy recommendations were actually misleading in the sense that recommended stocks tended to fall in price.
Another source of noise appears to be advertising of the products of the company whose shares are being considered. Fehle, Tsyplakov and Zdorovtsov (2005) found that when a company advertises its products, it simultaneously advertises its shares. When a company advertises its products its stock price tends to rise. From the perspective of stock trading, the advertising could be seen as noise. It was observed that the increase in share purchases took the form of small purchases, which indicates that small investors are the ones influenced by the product advertising when making their investment decisions.
Barber and Odean (2008) point out that for individual investors the buying process is much more complicated than the selling process. When buying there are thousands of stocks from which to choose; when selling there is the small number of stocks held in the investor’s portfolio. It is impossible for an individual to analyse every possible stock when considering a purchase. Barber and Odean suggested that individuals consider only those stocks that have caught their attention, such as stocks in the news. Not every stock that catches an investor’s attention is bought, but stocks that do not attract attention are unlikely to be bought. The effect of attention applies only to purchase decisions, since sales tend to be restricted to stocks already held. An implication is that prices of stocks in the news are likely to rise relative to those of stocks not receiving publicity. The attention effect applies much more to individuals than to institutional investors because institutions have the resources to research a large number of potential purchases.
Rational investors might be expected to correct the errant price movements caused by noise traders. Unjustified falls would be countered by purchases on the part of rational investors, conversely
unwarranted rises would tend to cause rational investors to sell and thereby eliminate the inappropriate price movement. Trading that tends to maintain prices at stable, equilibrium, levels is referred to as negative feedback trading. The Efficient Market Hypothesis assumes that negative feedback trading dominates financial markets.
Shleifer and Summers (1990) suggested that rational investors face two forms of uncertainty that could result in them not correcting the effects of noise traders. First, their rational valuations may be wrong. This possibility could make them reluctant to pursue the more modest profit opportunities, so that small deviations from fair value may remain uncorrected. Second, rational investors face uncertainty as to how long the stock prices will stay away from their fundamental values. The effects of uncertainty on the trading behaviour of rational investors allow noise traders to move prices away from the values that would accurately reflect the available information.
Schleifer and Vishny (1997) also pointed out limits to the correction of mispricing including the particular difficulty of exploiting overpricing. To profit from overpricing an investor needs to short-sell; that is, borrow shares and then sell them. The resulting short position provides a profit from a fall in the share price since the shares could be bought at a price lower than the selling price when being returned to the lender. The extent of such trades is limited by the fact that many investors are not allowed to short-sell. The possibility that the return of the shares to the lender could be demanded at any time renders the time-horizon of the short sale uncertain, and thereby causes the short sale to be riskier and less desirable.
A constraint on the rationality of investment behaviour is the limit to the amount of information that investors can process. Bounded rationality is the limited rationality that arises when, in the face of a deluge of information, investors fail to analyse it all and as a result do not behave in a totally rational manner. In addition, behavioural finance suggests that there are systematic psychological biases that distort decision-making and prevent rational behaviour. The limitations on the price-correcting trades
of rational investors makes it less likely that they would correct mispricing arising from the psychological biases identified by behavioural finance.
Noise traders are sometimes referred to as uninformed traders. Jordan and Kaas (2002) found that, whilst both informed and uninformed investors are subject to behavioural finance biases, uninformed investors are more strongly affected by the biases. In other words, noise traders are particularly prone to psychological biases in their trading behaviour.
Behavioural Finance
Behavioural finance has emerged as a challenge to the efficient market hypothesis. In particular it challenges the assumptions about investor behaviour made by the efficient market hypothesis (and by other theories that reflect a similar way of thinking such as the Markowitz diversification model, the capital asset pricing model, the dividend discount model and the Black-Scholes option pricing model). The view of decision making processes, based on those assumptions, has been referred to as classical decision theory (Ricciardi 2008).
Classical decision theory treats investors as having complete information and as making rational decisions with a view to maximising their wealth (or utility). The investor of classical decision theory knows all possible alternatives and has the best possible knowledge of the consequences of those alternatives. On the basis of this knowledge the optimum solution is chosen. The optimum solution relates solely to the financial dimension and to the individual’s (or household’s) self interest (Ricciardi 2008). The investor engages in a comprehensive search for all information and a full analysis of every alternative decision. For this an investor needs, and is assumed to possess, infinite computational ability.
According to the proponents of behavioural finance (behavioural decision making) investors have limited knowledge of possible outcomes and their consequences, and choose a satisfactory (rather than optimum) outcome. Rather than indulging in an exhaustive search for alternatives investors may decide on an acceptable outcome and end the search for alternatives as soon as one is found that achieves the acceptable outcome. In other words, investors satisfice rather than optimise.
The idea of bounded rationality (Simon 1956) sees investors as using a restricted form of rational choice that is restricted by limitations of mental capacity, limitations of time available for decision-making, limitations of information and the influence of emotion. Full rationality requires a choice among all alternatives, whereas an investor would not usually be aware of all alternatives. It also requires full knowledge of the consequences of each alternative, but knowledge of consequences is always partial. In addition to the limitations indicated by the notion of bounded rationality Olsen (2001) has pointed out that investors’ preferences tend to be multi-dimensional, are subject to change and are often formed during the process of decision making. Bernstein (1997) added the view that emotion can destroy the self-control, which is required for rational decision-making.
Behavioural finance applies the findings of psychological research on decision-making to investment decisions. Apparent irrationalities in decision-making are seen as arising from two sources. First, there are errors in the processing of information. This partly arises from self-deception. Second, there are biases and errors in the decision-making based on the processed information. This is partly due to heuristic simplification. In other words people perceive situations inaccurately, and then make decisions that are inconsistent with perceptions. There are two layers of errors.
There is evidence from psychological studies that there are systematic biases in the way people think. Research has found a number of systematic biases that affect investors. These include Overconfidence, Illusion of Control, Hindsight Bias, Confirmation Bias, Cognitive Dissonance, Representativeness, Retrievability, Narrow Framing, Mental Accounting, Conservatism, Status Quo Bias, Anchoring, Ambiguity Aversion, Loss Aversion, Regret, Emotion, Group-Think, and Herding (see the chapter on the psychology of personal investment decisions). All of these biases interfere with the process of rational decision-making that is assumed by the Efficient Market Hypothesis.
However Ko and Huang (2007) have suggested that overconfidence could be beneficial, rather than detrimental, to market efficiency. There is a view that, since it is costly to acquire information in terms of time and money, it is rational to limit the amount of information acquired. This is referred to as rational inattention (Huang and Liu 2007). According to Ko and Huang overconfident investors would
devote more resources to the acquisition of information than more rational investors. Since
overconfident investors believe that they can use information profitably, they will seek relatively large amounts of information. An effect of this behaviour of overconfident investors is that more information is put into the market. In consequence stock prices reflect a larger amount of information and hence get closer to their fundamental, or true, values. In other words overconfident investors make markets more efficient.
Under-Reaction
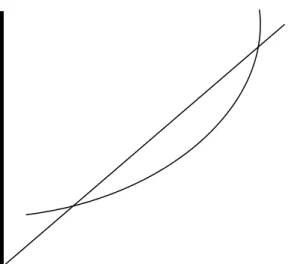
Figure 24.1 illustrates the share price movements when there is over-reaction or under-reaction. At time T there is an item of news to which the share price should move, from P1 to P2, as indicated by the
unbroken line. If the market over-reacts, the price rises to P3 before moving to P2. If there is
under-reaction, the initial price movement is insufficient. Initially the share price moves only to P4, the
remaining price movement occurring subsequently.
Share price P3 Over-reaction P2 Under-reaction P4 P1 T Time Figure 24.1
If there were a consistent tendency to under- or over-reaction to new information, investors could profit from the information. Under-reaction would imply that investors could profit from buying subsequent
to the news. Over-reaction would provide profits from selling after the news. The opportunity to make such profits is inconsistent with the Efficient Market Hypothesis.
The concept of Conservatism suggests that investors are slow to change their views following the receipt of new information. This is consistent with the research findings that, following unexpected earnings announcements, it can take several weeks for the resulting stock price movements to be completed. Investors take time to change their views about a stock, following news of unexpectedly high or low company profits.
The idea of cognitive dissonance relates to the desire to avoid dissonance. Dissonance occurs when new information contradicts existing beliefs. Conservatism may arise in consequence of slow acceptance of new information. The slow acceptance could be an attempt to reduce cognitive
dissonance. The extent of the conservatism would depend upon the strength of commitment to existing beliefs. The extent of the dissonance depends on the level of commitment to the beliefs. Commitment develops when the individual has a choice to make. The level of commitment to that choice (and the commitment to the beliefs associated with it) increases with the amount of money, time, and effort invested in that choice or set of beliefs. The level of commitment is stronger where the choice or belief deviates from the norm. Group-think is a name given to the tendency for members of a group to share beliefs and to mutually reinforce those beliefs (Hilton, 2001). If an individual takes a view that deviates from the group-think norm, the degree of commitment to that view will be high.
Zhang (2006) found that the extent of under-reaction was related to the amount of uncertainty relating to the new information. Adjustment to new information was slower when there was uncertainty concerning the accuracy of the new information. Uncertainty about new information would make it easier to maintain existing beliefs, and would hence slow the reaction to the new information.
A phenomenon similar to conservatism is anchoring. People often start from a particular value, the anchor, and then adjust their evaluation from this point. The anchor might, for example, be the
purchase price of a share or the highest price that it has reached. It has been suggested that most people adjust too conservatively and hence give too much weight to the anchor value when evaluating the
appropriate value for an investment. This can cause investors to underestimate possible deviations from their original estimates (Shefrin, 2000; Tversky and Kahneman, 1982, 1982c).
In an experiment Tversky and Kahneman (1974) asked people to answer questions such as “What is the percentage of African nations in the UN?” A wheel of fortune was spun in front of the subjects who were then asked whether their answer was above or below the number provided by the wheel. They were then asked to give their answers. The subjects were found to be heavily influenced by the wheel of fortune. For example the average estimate was 25 and 45 for groups that received 10 and 65 respectively from the wheel.
Professional analysts, such as stockbrokers, appear to be subject to Anchoring. It might be thought that if an analyst suggests an appropriate price for a share and the share price subsequently moves away from that level, an investor would see a trading opportunity. For example, a fall in the share price below the analyst’s forecast should indicate a buying opportunity. Unfortunately for the private investor, the effect of the share price move seems to be that the analyst moves the forecast in the same direction as the share price. Cornell (2000) demonstrated this effect in relation to Intel. Those results were consistent with studies by Womack (1996), and Brav and Lehavy (2001) whose findings showed that adjustments subsequent to analysts’ forecasts took the form of the forecasts being changed towards actual prices rather than actual share prices moving towards the forecasts. This throws doubt on the idea that investment analysts move share prices towards the levels consistent with relevant information, and hence throws doubt on the idea that markets are efficient.
The appropriate prices of shares are uncertain and past prices are likely to be anchors for current prices. Stock markets tend to under-react to information such as earnings reports (e.g. Liu, Strong and Xu 2001); and investors may expect a company’s earnings to be in line with an apparent historical trend (and under-react to a deviation from that apparent trend). This is consistent with past prices acting as anchors for future prices. Anchoring may also explain the expectation, held by many investors including technical analysts, of a share price trading within a range of values for a period of time. All of these effects of anchoring can hinder the process of incorporating new information into a share price, with the effect that it takes time for the price to reflect all relevant information.
The fear of regret is another explanation for under-reaction. If an investment decision proves to be incorrect there would be the pain of regret at having made a bad decision. One defence against the risk of regret is the avoidance of decisions. Fear of regret could slow the process of incorporating new information into share prices through transactions in the shares.
Ambiguity Aversion (alternatively known as Familiarity Bias) suggests that investors prefer to invest in companies that they feel that they understand. Over 90 per cent of the equity investments of investors in the US, UK and Japan is in companies in their own countries. This home bias exists despite the demonstrated benefits of international diversification. Likewise there are biases towards the investor’s local region and the firm that employs them. This preference for the familiar results in the holding of portfolios that are insufficiently diversified. In consequence investors bear more risk than is necessary. The bias also hinders the flow of money to some areas or sectors. In consequence asset prices are slow to adjust to new information. The unfamiliar remains under-priced and the familiar remains overpriced.
Over-Reaction
Overconfidence causes people to overestimate their abilities and to overestimate the accuracy of their forecasts. Overconfidence arises partly from self-attribution bias. This is a tendency on the part of investors to regard successes as arising from their expertise whilst failures are due to bad luck or the actions of others. This leads to excessive confidence in one’s own powers of forecasting.
Overconfidence appears to be greater when feedback on decisions is deferred or ambiguous (Fischhoff, Slovic and Lichtenstein 1977). Financial markets are characterised by delayed feedback, since
anticipated price adjustments can take a considerable amount of time. The feedback is also ambiguous (are outcomes to be judged in absolute terms, or relative to a benchmark - and what benchmark is appropriate?). Noise trading in financial markets can cause feedback to be inconclusive (might apparently successful forecasting merely be the accidental result of noise?).
Overconfidence is capable of explaining a number of types of apparently irrational behaviour. For example it can explain why some investors hold undiversified portfolios. If investors are highly confident about their stock selection abilities, they will not feel the need to reduce risk by means of
diversification. It could also explain why some investors trade very frequently, to the point where transaction costs cause their investment behaviour to be loss making (Barber and Odean 2000, 2001).
To the extent that some investors attribute their profits from rising markets to their own talents, rising markets could be self-perpetuating. Overconfident investors may be encouraged to invest further and thereby reinforce an upward movement in stock prices. Conversely a falling market reduces confidence and investing. This is consistent with the view that markets exhibit over-reaction.
In one study of Overconfidence Lichenstein and Fischoff (1977) gave people market reports on 12 stocks and asked them to forecast the direction in which their prices would move. Whereas only 47% of the predictions were correct, on average people were 65% confident that their forecasts would be correct.
Odean (1998a) has shown that one of the effects of Overconfidence is that turnover of investments tends to be high, that is people trade shares more as a result of overconfidence. Barber and Odean (2000) have shown that as turnover rises net profits tend to fall. Psychological research has found that men tend to be more overconfident than women. Barber and Odean (2001a) found that single men trade 67% more than single women. Correspondingly single men on average experienced investment returns 3.5% per year lower than single women.
Some other biases tend to reinforce Overconfidence. According to the Confirmation Bias, investors pay more attention to evidence that supports their opinions than to evidence that contradicts them. This can cause investors to persist with unsuccessful investment strategies. Another cognitive bias is the Illusion of Control. In some circumstances people behave as if they were able to exert control, or able to forecast events, where this is impossible or unlikely. The Illusion of Control is associated with the under-estimation of risk. Also related to the concept of Overconfidence is Optimism Bias. Optimism Bias is the tendency for people to regard themselves as better than average (Hilton, 2001).
The Hindsight Bias is the inability to correctly remember one’s prior expectations after observing new information. The hindsight bias prevents people learning from their own mistakes, since they are
unable to remember those mistakes. People are unable to recognise their own errors. There is self-denial about past errors. If someone has a self-image of being a clever investor, past errors in forecasting may be subject to distortions of memory aimed at maintaining the self-image. Memory is never a faithful recollection of the past; it is amended by the human mind.
Good decision-making in financial markets relies on learning from the past. Learning may entail the comparison of new information with previous expectations. This requires an accurate recall of previous expectations. The hindsight bias involves the contamination of recollections of expectations by new information. The recalled expectations of an outcome are biased towards information about the outcome. The person remembers forming an expectation that is close to what subsequently happened.
The hindsight bias can lead to overreaction by investors. People may form expectations by averaging outcomes with their previous expectations of those outcomes. For example, expectations of future returns could be formed by averaging realised investment returns with previously expected returns. Hindsight-biased investors, when forming such averages, incorrectly remember their prior
expectations. They amend their memories in the light of realised returns. New information about returns thus becomes over-weighted, and hence has excessive influence on the formation of expectations. Expectations change too much. The result is overreaction to the new information. Hindsight bias is not limited to naïve investors; Biais and Weber (2006) found that market professionals were prone to hindsight bias.
Representativeness helps to explain why many investors seem to extrapolate price movements. Many investors appear to believe that if prices have been rising in the past then they will continue to rise, and conversely with falling prices. The concept of representativeness suggests that this is because those investors see an investment with recent price increases as representative of longer-term successful investments, conversely with price falls. DeBondt and Thaler (1985) argued that because investors are subject to the representativeness bias, they could become too optimistic about past winners and too pessimistic about past losers. Trading that is influenced by the representativeness bias can move share prices away from the levels that accurately reflect all relevant information.
Everyone uses heuristics. Heuristics are rules-of-thumb that help people to make sense of the deluge of information with which they are bombarded. Social psychology has established that we tend to judge people by appearances. If someone, who is newly encountered, resembles a person one has known then it is assumed that the new acquaintance has a similar personality to the older acquaintance.
Representativeness refers to the tendency to evaluate something with reference to something else, which it resembles. A share price pattern that was followed by a price rise in the past may be seen as indicating a price rise in the future.
One aspect of representativeness is often referred to as the law of small numbers. It is a belief that random samples will resemble each other more closely than the principles of statistical sampling theory would predict. People tend to have an image of what a random sample should look like, and take the view that samples that differ from the image are not random. Consider the following two sequences of coin tossing:
THTHHT and
TTTHHH
Both sequences are equally likely but when asked which is more likely most people will say the first. The first series fits the image of a random sequence whereas the second does not.
This may help to explain the popularity of chartism; people do not always see random sequences as being random, and tend to attribute patterns to the sequences. People are biased towards believing that a causal factor is the reason for a sequence of events and find it difficult to accept that events can occur by chance; they are reluctant to accept that an apparent pattern can emerge purely by chance. Investors tend to over-interpret patterns that arise from coincidence. A pattern arising from coincidence may be interpreted as indicative, or representative, of a genuine pattern of events. A result could be
overreaction to a random sequence of events even when the number of events is small or the length of the sequence is short (Kahneman and Riepe, 1998).
Cooper, Dimitrov and Rau (2001) provided an interesting example of representativeness. They studied firms that changed their names to incorporate some mention of dot.com between June 1998 and July
1999, a period which coincided with the dot.com share price bubble. Some of the firms that made the change did not significantly operate in the internet business. It was found that those non-internet firms, on average, experienced a 140% increase in share price during the sixty days following the name change. The name changes conveyed no information about the operations of the firms. Some investors appear to have seen the letters ‘dot.com’ in a name as representative of potential strong performers.
Retrievability bias causes too much attention to be given to the most easily recalled information (it is alternatively known as the availability or memory bias). In consequence there is a tendency to give too much emphasis to the most recent information. Retrievability is consistent with the over-reaction hypothesis, one dimension of which is the over-emphasis on recent information and recent events when making investment decisions. According to the over-reaction hypothesis share prices are prone to rise too high and fall too low. Experiments by Kahneman and Tversky (1972, 1973) indicated that people not only give too much weight to recent experience when making forecasts but also make forecasts that are too extreme. Another aspect of the retrievability bias is the over-emphasis on one’s own experience. Some people appear to learn only from their own mistakes, rather than being able to learn from the experiences of others. The retrievability bias limits the amount of information used in investment decision-making, and hence limits the amount of information reflected in asset prices as a result of trading.
It has been observed that the shares of companies with low price-earnings ratios tend to outperform those of companies with high price-earnings ratios. This has been called the price-earnings ratio effect. DeBondt and Thaler (1990) argued that this price-earnings ratio effect could be explained in terms of extreme expectations of future earnings growth. The extreme forecasts of earnings growth lead to excessively high share prices and hence price-earnings ratios that are too high, and which subsequently fall when the error is realised. Thus the shares of firms with high price-earnings ratios tend to perform less well than the shares of firms with low price-earnings ratios, since some price decline is required in order to correct the exaggerated price-earnings ratio.
Francis, Chen, Philbrick and Willis (2004) cited evidence that professional investment analysts’ earnings forecasts tend to be over-optimistic with the degree of exaggeration increasing as the forecast
horizon becomes longer. Cornell (2001), when examining the case of Intel, concluded that many analysts’ recommendations were based on factors other than divergences between market price and fundamental value. Possible factors mentioned were rating the company, as well as the stock, and reacting to the recent price movement of the stock (the momentum effect of extrapolation). Francis, Chen, Philbrick and Willis cited evidence that professional investment analysts exhibited herding behaviour such that they were influenced by each other’s forecasts and hence produced similar forecasts. Any of these possible factors could exaggerate market swings in response to announcements of changes in company performance, and hence generate over-reaction.
Guedj and Bouchaud (2005) presented evidence confirming the tendency for financial analysts to be over-optimistic and prone to herding. Analysts tended to agree with each other five to ten times more than with actual outcomes. The quality of forecasting was no better than using current prices as forecasts of future prices. The researchers suggested that information was scarce and difficult to interpret with the consequence that it was questionable as to whether it was possible to establish a true (fundamental) value of a stock. Prices are determined by trading within broad ranges of possibilities. Considerable volatility can result. Over-reaction is not constrained by rational investors taking advantage of mis-pricing since no-one has a clear idea of what prices should be. Excessive price increases may not be moderated by sales and downward over-reaction may not be constrained by purchases. The efficient market hypothesis expects that investors trade independently of one another so that, even though none may have complete information, the result is a consensus that comes close to true value. If there is herding in the market, investors do not trade independently and prices can exhibit considerable bias.
It is interesting to reflect on some views expressed by Fisher Black (1986). He argued that traders could be divided into information traders, who are rational traders using relevant information, and noise traders. Noise is irrelevant or meaningless information. Noise trading puts noise into market prices, causing them to depart from their true values. The deviations caused by noise trading can be cumulative. As a stock price diverges further from its true value, the scope for profits from information trading becomes greater. Although information trading tends to pull prices towards their true values, it can be difficult to distinguish noise from relevant and accurate information. There can be uncertainty
about the reliability and relevance of information. A market may be efficient in that it fully reflects all information that is unambiguously reliable and relevant. However the scarcity of such solid
information could mean that the dispersion of possible fundamental values is very wide. Black argued that a market could be efficient even if a stock price differs from its fundamental value by a factor of as much as two.
Inaccurate Perceptions of Risk
Risk could be regarded as uncertainty that can be measured and which has significance for a person. The dimensions of risk might be seen as (Sitkin and Weingart 1995; Loewenstein, Hsee, Weber and Welch 2001):
1. The expected variance of the probability distribution of possible future outcomes. A high variance indicates high risk. More sophisticated expectations might encompass skewness and kurtosis.
2. The significance of the outcomes (including emotional significance). Low significance is associated with low perceived risk.
3. The perceived controllability of the outcomes. Perceived controllability reduces risk. 4. The person’s confidence in their estimates of the previous three dimensions. Low confidence
entails high risk. Low confidence is also reflected in a high expected variance of the probability distribution.
What one person sees as a major risk another person may perceive as a minor risk (Ricciardi 2008). People vary considerably in terms of all four of the dimensions. Sjöberg (2000) found variations in general risk sensitivity; some people show considerable concern about a wide range of potential hazards whereas others appear oblivious to all risks. Cultural theory (Douglas and Wildavsky 1982; Dake 1991) suggests that people vary in terms of the type of risk that concerns them most. This theory classifies people into four categories: individualists, egalitarians, hierarchists and fatalists. The individualists are the group most likely to be concerned with stock market risk whereas egalitarians tend to be primarily concerned with environmental risk, hierarchists with the risk of crime and fatalists are relatively indifferent to risk. Bouyer and Bagdassaian (2001) and Slovic (1993) found that people
with egalitarian or individualistic worldviews tended to perceive risks as greater than those with hierarchical or fatalistic worldviews.
People are constantly bombarded with information about situations and events around them. Perception is not an exact recording of information relating to an object, event or situation. Perception is an interpretation that is unique to an individual and may differ substantially from objective reality (Luthans 1998). It is the selection and organisation of information to provide an experience with meaning for a person. The individual searches for the best explanation of information based on that individual’s knowledge, experience, values, motivations and feelings. A perception may be based on the person’s past experience of a similar event, situation, activity or object (Ricciardi 2008). There is a tendency to make new information match what is already known and understood. The mind interprets information with the result that different people can perceive very different things on the basis of the same objective information.
Litterer developed a model of perception in which external information is subject to three internal processes (Litterer 1965; Kast and Rosenzweig 1970). The three internal processes of perception formation are selectivity, interpretation and closure. Selectivity is the means of dealing with
information overload. The individual selects only part of the information available from the objective environment. Olsen (2008a) made the point that selectivity may not even be a conscious process. The person might not be aware of some selectivity. Processes outside of awareness can direct attention to particular aspects of a situation. The person could then think about the situation without even being aware that there has been an information selection process, which has excluded some information. The person would make a decision on the basis of incomplete information without being aware that the information is incomplete.
Olsen pointed out that an implication of risk perception studies is that risk perceptions contain both cognitive and affective dimensions. Affective elements are the risk attributes that reflect the investor’s feelings of goodness or badness in relation to an investment; feelings that are not necessarily conscious. Positive affect (feelings of goodness) causes perceived risk to be lower. Affect has its greatest
influence of affect are incomplete information, unreliable information, the decision maker lacks confidence, and the decision time is short. One common outcome of the influence of affect is the perception that high return is associated with low risk; that is, positive affect causes both attributes of an investment to be perceived as favourable (conversely for negative affect).
The second process, interpretation, depends on a person’s past experience and the person’s system of values. The same objective information can be interpreted and perceived in different ways by different people. The third mechanism, closure, concerns the tendency of individuals to create a complete picture or story in relation to a situation. The individual may perceive more than the objective information provides. When external information is being processed additional information is attached in order to achieve completeness and significance. The interpretation and closure stages feed back to selectivity and affect the subsequent functioning of selectivity.
One consequence of these processes is that what an individual perceives may not actually exist, or may be a distortion of what exists. This is important since behaviour is based on the perception of reality; not on reality itself.
In chapter 27 on stock market bubbles and crashes evidence is cited to indicate that a person’s attitude to risk (risk aversion/risk tolerance) is not constant. A number of studies indicated that attitude to stock market risk depends upon the recent behaviour of the stock market (Clarke and Statman 1998; Shefrin 2000; MacKillop 2003; Grable, Lytton and O’Neill 2004; Yao, Hanna and Lindamood 2004). An alternative perspective on that evidence can be derived from research by Weber and Milliman (1997) who suggested that risk preference may be stable and that the effect of situational factors, such as stock market performance, may be caused by changes in perceptions of risk. They found that influences on investment choices simultaneously affected risk perceptions. It could be the case that attitude to
perceived risk is constant, and that what changes is the perception of risk. From the perspective of providing financial advice this implies that by correcting misperceptions about the risks of investments a financial adviser can have a positive influence on investment decisions.
Sociologists have suggested that financial perception has a social dimension. Muniesa (2000) stressed the impossibility of separating information and cognition. Turning numbers and observations into meaningful information entails financial cognition. Financial cognition requires perception and analysis, and may be a group process. Perception and cognition could be team processes since team effort may be required to turn raw data into meaningful information. Financial perception, including perception of risk, may be a group perception. Information is not independent of perception frames; in other words information is not independent of how it is classified, analysed and interpreted. Different groups (e.g. fund management teams, investment analyst teams) have different analytical frameworks for interpreting raw data and hence have different perceptions of information. An individual’s perception of the financial world is influenced by the social group within which that individual operates. For example it has been observed that traders rely on interaction with and feedback from other traders in their observation and interpretation of price data (Zaloom 2003; Beunza and Stark 2005). Scherer and Cho (2003) found that people with stronger social linkages had more similar perceptions of risk; individual perceptions of risk become more similar as group interaction increases.
Heuristic Biases
Narrow framing refers to the tendency of investors to focus too narrowly. One aspect is focus on the constituents of a portfolio rather than the portfolio as a whole. Another dimension of narrow framing is the focus on the short term even when the investment horizon is long term. It is not rational for an investor accumulating assets for retirement 25 years hence to be concerned about the week-by-week performance of the portfolio. Yet long-term investors do focus on short-term volatility. Studies have shown that when, in experimental situations, people have been presented with monthly distributions of returns they are less likely to invest than when they are shown annual distributions (with the annualised volatility being the same in both cases). The implication is that focus on short-term volatility deters investment. It appears that people do not appreciate the effects of time diversification. By time diversification is meant the tendency for good periods to offset bad periods with the effect that the dispersion of investment returns does not increase proportionately with the period of the investment. Investors who focus too much on short-term fluctuations overestimate stock market risk and allocate too little of their money to investment in shares.
This has been suggested as a possible explanation of what is called ‘The Equity Premium Puzzle’. The puzzle is why the excess of equity returns over returns on bonds and deposits is so high (when averaged over long periods of time). Although additional return is appropriate in order to compensate for the extra risk, it is generally thought that the additional return actually received is much more than is justified by the extra risk. However if investors focus too strongly on the short term they may overestimate equity risk and hence require an excessive premium on the expected rate of return in order to induce them to invest in shares. Focus on individual stocks, rather than the portfolio as a whole, would also cause investors to overestimate stock market risk since the risk of individual shares exceeds the risk of portfolios. In terms of explaining the equity premium puzzle, these factors may be
reinforced by loss aversion. The idea of loss aversion comes from prospect theory and suggests that people are much more sensitive to losses than to gains. Investors may not only overestimate the likelihood of losses, they also feel a disproportionate amount of pain as a result of losses (Benartzi and Thaler 1995).
Garmaise (2006) pointed out that most people have an evaluation period that is much shorter than their investment horizon. The evaluation period is the frequency of evaluating portfolio performance and the investment horizon is the period for which the investment is to be held. Benartzi and Thaler (1995) suggested that the equity risk premium indicated an evaluation period of about one year. Since the chance of loss over one year is much greater than the chance of loss over the investment horizon (e.g. twenty years) people overestimate the risk of loss, and prospect theory indicates that investors are very sensitive to losses. Benartzi and Thaler referred to the effect as ‘myopic loss aversion’. The tendency for the evaluation period to be much shorter than the investment horizon causes the perception of risk to be exaggerated. In consequence people are deterred from stock market investment. Garmaise, based on survey evidence in the US, suggested that the evaluation period averaged around two years. The survey indicated that a market fall tended to shorten the evaluation period, and hence increased the perception of risk. People with short evaluation periods were found to have relatively low-risk investment strategies. The evaluation period was shorter for older investors.
The idea of mental accounts has similarities with narrow framing. The principle of mental accounts sees people as separating aspects of their finances into separate accounts rather than seeing their
financial situation as an integrated whole. For example income and wealth may be segregated such that only current income is used for current spending, and wealth is treated as something to be preserved. In consequence changes in the level of wealth have little effect on spending.
The concept of mental accounts has been proposed as an explanation of the apparent preference, on the part of many investors, for stocks that pay high dividends (Statman 1997). Such investors may be prepared to use dividends to finance spending since dividends are seen as income, whereas they would not sell some of their shares to fund expenditure even when the real value of the shares has increased. Dividends are treated as available for spending but capital gains are not.
Mental accounting can cause investors to overestimate risk by failing to take the risk reduction effects of diversification into consideration. The chapter on portfolio diversification shows how combining assets into a portfolio reduces risk since poor performances from some investments may be offset by good performances from others. If an investor separates investments into different mental accounts, the potential risk reduction of such offsetting is ignored. In consequence total risk is overestimated.
Hindsight-biased investors may underestimate volatility. This is because they amend their recollected expectations into line with observed outcomes. A rational investor, upon observing a return that is substantially different from the previously expected return, would raise the expectation of volatility. A hindsight-biased investor would not be aware of the substantial discrepancy, and would therefore under-estimate volatility. Hindsight-biased investors form distorted expectations of future returns and risk, and as a result construct inefficient investment portfolios. Hindsight bias, by distorting
expectations of return and risk, can prevent share prices from reflecting relevant information.
The illusion of control is the tendency to believe that chance events are amenable to personal control (Langer, 1975). This may take the form of investors believing that they can forecast price movements, which are unpredictable. The illusion of control can cause an underestimation of risk. If events are seen as controllable, they will be seen as less risky (Gollwitzer and Kinney, 1989). De Bondt (1998) suggested that one manifestation of the illusion of control was the belief of many investors that they would be sufficiently astute to sell before a large fall in prices. This belief that they would be able to
avoid losses by selling in time causes such investors to underestimate the risks of their investments. The degree of illusion of control can be affected by the individual’s environment (Taylor and Armor, 1996). Competitive and stressful environments can produce illusion of control (Friedland, Keinan, and Regev, 1992). Fenton O’Creevy, Nicholson, Soane and Willman (2005) found that traders in financial markets were subject to the illusion of control. They also found that the illusion of control was associated with poorer performance.
The illusion of knowledge is the tendency for people to believe that additional information always increases the accuracy of their forecasts. It is the belief that more information increases the person’s knowledge and hence improves decisions (Peterson and Pitz, 1988). For example people often believe that knowledge of previous drawings of lottery numbers improves their ability to predict future lottery numbers. Some information is irrelevant, or may be beyond a person’s ability to interpret, but the person may still regard the information as improving their ability to forecast. Tumarkin and Whitelaw (2001) found that, despite providing no useful information, website message board postings increased trading volume in the respective shares. Despite the absence of useful information from the messages, as indicated by subsequent price movements, it appeared that some investors believed that it added to their knowledge and expertise (and traded as a result). The illusion of knowledge can cause investors to be overconfident and to underestimate the amount of risk from an investment. Investors, who
overestimate the accuracy of their forecasts, underestimate the risks taken.
The illusion of knowledge can be used by financial advisors as a means of encouraging clients to invest. King (2009) found that that client trust was enhanced if an advisor provided educational materials, market information, and information about financial products. There was increased client satisfaction, increased likelihood of the client recommending the advisor, and greater loyalty as measured by the time that the client remained with the advisor. Higher trust is associated with lower perceived risk.
Fenton-O’Creevy, Nicholson, Soane and Willman (2005) found that professional traders failed to appreciate the significance of sample size for risk. In the case of an illiquid stock there would be few trades, in other words a small sample size. In the case of liquid stocks there would be a high volume of
trading, and hence a large sample of trades. A particular percentage deviation from a previous price is more likely to be a chance event when trades are infrequent than when they are frequent. A 10% price change in an infrequently traded share is more likely to be the result of random variation than the same percentage change in the price of a heavily traded share.
According to the representativeness bias people are inclined to develop detailed generalisations about an event or situation based on a very few characteristics of the event or situation (Tversky and Kahneman 1971, Busenitz 1999). The mind assumes that events or situations (or objects or people) with some similar characteristics are identical, even though they may be different with respect to other characteristics (Eaton 2000). The representativeness heuristic proposes that people have an inclination to make judgments based on the similarity of items, or make forecasts on the basis of a small amount of information (Ricciardi 2008). In the process of forming opinions of events (or situations, or objects or people) on the basis of similarities to other events relevant information is ignored, and closure would add extraneous information in order to make the perception more complete.
Representativeness, like other heuristics, helps to render complex problems manageable. In so doing it may reduce the level of perceived risk. Busenitz found that the business people who took relatively high risks (entrepreneurs) were the ones with relatively high use of representativeness, and other heuristics such as overconfidence. This is consistent with the view that heuristics reduce the level of perceived risk. The tendency to assume that new situations are identical to previously experienced situations could introduce some inflexibility into thinking and hinder adaptation to change (in this way the representativeness bias can reinforce the conservatism bias).
According to the familiarity bias, people tend to prefer things that seem familiar to them.
Correspondingly investors prefer investments with which they feel familiar. Familiarity appears to reduce the perceived risk. Arguably the most familiar investments are those in the company for which the investor works. A study by John Hancock Financial Services (Driscoll, Malcolm, Sirull and Slotter 1995) found that a majority of employees believed that shares in their own company were less risky than a diversified portfolio. Benartzi (2001) reported the findings of a survey which indicated that only 16.4% of respondents believed that shares in their own company were more risky than the stock market
as a whole. Kilka and Weber (2000) found that Americans believed the US stock market would perform better than the German stock market whereas Germans believed that their stock market would be the stronger performer. Generally the evidence indicates that people view familiar stocks
favourably, expecting them to deliver both higher returns and a lower level of risk. The result is that portfolios are biased towards investments that seem familiar. Tourani-Rad and Kirkby (2005) confirmed the familiarity bias in New Zealand, in that they found that the portfolios of New Zealand investors contained a disproportionate amount of New Zealand stocks but they did not confirm that it was the result of higher optimism with regard to the future performance of New Zealand stocks.
In relation to institutional investments, such as mutual funds and pensions, trust in the provider could affect the perception of risk. An investor who mistrusts the institution that provides the investment product, or the person who sells it, may perceive a higher level of risk than someone who is more trusting. Cox (2007) identified a UK institutional investor which was similar to other institutional investors in all respects except in perceived trustworthiness. That institution was more trusted by investors. The study found that customers of that institution made investment choices that indicated relatively high risk tolerance. Its retail investors invested a higher proportion, in assets that would normally be seen as risky, than the retail investors of other institutions. This is consistent with the view that trust influences perceived risk. If the provider of an investment product is trusted by investors, those investors will see the investment as less risky. Variations in trust, whether justified or not, could cause variations in the perception of risk. Olsen (2008) suggested that investors use trust as a proxy for statistical measures of risk, particularly when investments are complex and unfamiliar. The
trustworthiness of the provider, or adviser, may be used as the measure of risk.
Finance professionals typically measure risk as the expected standard deviation of returns on an investment. The standard deviation of returns is a measure of volatility. It is assumed by conventional finance models, such as the Markowitz portfolio diversification model, that volatility and perceived risk are closely related. However research has found that there can be substantial differences between volatility and perceived risk. Choices appear to be better explained by perceived risk than by volatility (Jia, Dyer and Butler, 1999). Perceived risk, in contrast to volatility, incorporates affective (emotional) reactions to uncertainty (Loewenstein, Weber, Hsee and Welch, 2001). The distinction between
volatility and perceived risk was reinforced by Weber, Siebenmorgen and Weber (2005). They found that presentational factors that affected expected volatility had no effect on perceived risk, and that perceived risk had more effect on investment choice than expected volatility. The familiarity of asset names, which may be expected to elicit emotional responses, had strong effects on risk perception and investment choice. This is consistent with the other evidence relating to the familiarity bias. Byrne (2005) found that perceived risk was positively correlated with expected returns for all investments (except property), which is consistent with generally accepted principles, but that the positive relationship was present only amongst experts. Novices appeared to see no relationship between risk and return.
Vividness appears to be a factor in the incorporation of emotion into the perception of risk. Vividness refers to the emotional interest or excitement engendered by an event (Plous 1993). Stock market bubbles and crashes are examples of vivid events. The effects of vividness on attitudes and behaviour are not necessarily reasonable but are not permanent (Grable, Lytton, O’Neill, Joo and Klock, 2006).
Small differences in how risks are presented can have substantial effects on how they are perceived (Slovic, Fischhoff and Lichtenstein 1980). The differences in presentation could arise in two ways: from variations in the context of a decision and from changes in the wording of the problem
(Kahneman and Tversky 1979). Diacon and Hasseldine (2007) investigated framing effects and found that the presentation format of prior performance affected investment fund choice. They found that presenting past information in terms of fund values as opposed to percentage yields significantly affected investment choices. The alternatives were charts one of which showed the accumulated growth in the value of a fund over time relative to a base value, such as 100, and the other showed a series of vertical lines indicating the growth in each year. The charts of cumulative value growth evoked considerably more positive response than series of growth rates. The presentation of a series of vertical lines indicating annual growth rates produced perceptions of greater risk.
There are three key elements to prospect theory. (1) Perceived probabilities are subject to bias, (2) investors are more concerned about gains and losses than levels of wealth, and (3) investors feel losses more than gains (Kahneman and Tversky 1972, 1973, 1982).
In relation to perceived probabilities, the biases are tendencies to exaggerate small and large probabilities and under-weight medium ones. See figure 24.2.
Decision weighting
0 Objective probability
Figure 24.2
In figure 24.2, subjective (perceived) probabilities are referred to as decision weightings. When plotted against actual probabilities the decision weights are too high at low and high probabilities and too low at medium probabilities. The exaggeration of high probabilities suggests that highly likely (but not certain) events are treated as being certain. This is consistent with the idea of overconfidence. Investors can become overconfident about their forecasts to the extent that they forget that markets are uncertain.
Figure 24.3 is a value function. It depicts subjective values assigned to gains and losses relative to a reference point. The reference point is subjective and may, for example, be the purchase price of an investment. The reference point divides the region where someone feels that they are making gains from the region in which they feel that they are making losses.
Value Losses Gains Figure 24.3
It is to be noted that the slope of the function for losses is steeper than the slope for gains. This is because, on average, people find the pain of losses to be about 2.25 times as intense as the pleasure from gains. Given an evens chance of winning or losing, people on average require the prospect of a £225 win to balance the prospect of a £100 loss. This relatively large fear of loss, known as loss aversion, will tend to deter retail investors from stock market related investments. When combined with Narrow Framing and Mental Accounting, this asymmetric perception of risk increases the total perceived risk and thereby distorts decision-making. Risk premiums are too high, and hence asset prices are too low.
This is consistent with the ‘endowment effect’ (Thaler 1980). People often require much more to sell something than they were originally prepared to pay for it (Kahneman, Knetsch and Thaler 1990, 1991). This is seen as being associated with the pain of giving something up.
Another feature of figure 24.3 is the tendency for the slope of the value function to become less steep as gains or losses increase. This implies that as gains are made investors will become less inclined to take risks, since the addition to value of a higher gain is less than the reduction in value resulting from
a lowered gain. It also implies that as losses increase investors become more willing to accept risk. This is because the value of a loss reduction outweighs the value of a further loss. So, for example, in a losing situation an ‘evens’ bet looks attractive. An aspect of loss aversion is that people will avoid the risk of making losses (by avoiding risks) when in a gaining situation but will accept risk in order to attempt to recover from a loss. Prospect theory sees investors as being loss averse rather than risk averse.
This behaviour in a loss-making situation is consistent with the idea of an Escalation Bias (Shefrin, 2001). An Escalation Bias leads to ‘averaging down’ whereby as the price falls the investment is treated as being an increasingly good bargain. The thinking is that if a share was a good buy at £2, it is a fantastic bargain at £1 and more should be bought. It is psychologically difficult to consider the possibility that the initial purchase was at an excessively high price.
According to Prospect Theory, people in a position of gain become increasingly risk-averse and unwilling to accept gambles. When people are in a position of loss they become more inclined to accept risk. This may help to explain the disposition effect. The disposition effect is the inclination, when selling part of a portfolio, to sell assets that have risen in price relative to their purchase prices rather than assets that have fallen in price. The disposition effect can move share prices away from their fair values. Prices rise too slowly because of sales, and fall too slowly because of lack of sales. Prices thus fail to reflect all relevant information.
The disposition effect can be explained in terms of the avoidance of regret and the pursuit of pride. People want to feel good about themselves and hence take decisions that provide pride and avoid regret. Shefrin and Statman (1984) showed that these factors influence investment decisions. The sale of an investment that has risen in price produces the pleasant feeling that the investment decision was a good one. The sale of an investment that has fallen in price produces the unpleasant feeling that the original investment choice was a bad one. By realising successes through selling successful investments, and not realising failures, an investor can preserve the self-image of being a good investor. In consequence investors are more likely to sell investments showing gains than investments showing losses.
There is empirical research evidence in support of the disposition effect. For example Odean (1998) found that, on average, investors are approximately 50% more likely to sell a winner than a loser. Grinblatt and Keloharju (2001) found that if a share outperforms the market by 10%, the likelihood of sales increases by 26%, whereas an underperformance of 10% decreases the likelihood of sales by 14%. It is not just private individuals; professional investors such as institutional fund managers are also prone to the disposition effect (Frazzini 2006). Investors seem to prefer to sell winners rather than losers.
Narrow framing and mental accounting also help to explain the disposition effect. The disposition effect would not operate unless investors mentally separated components of portfolios.
There is evidence from mutual funds supportive of the prospect theory proposition that risk-taking increases following losses, and declines following gains. Elton, Gruber and Blake (2003) studied mutual fund managers who were paid incentive fees; in other words whose fees were related to the performance of the funds managed by them. They observed that mutual fund managers, when paid incentive fees, were more likely to increase risk after periods of poor performance and to decrease risk following periods of strong performance. Incentive fees mean that the fund manager has a personal financial interest in fund performance and the findings of Elton, Gruber and Blake may be dependent upon the presence of incentive fees. This dependence is suggested by a study from Ammann and Verhofen (2007) who found that the behaviour of mutual fund managers seemed to contradict prospect theory. They found that strong prior performance led to increased risk taking (for example increased beta and more small capitalisation stocks) whereas poor performance tended to lead to the adoption of passive strategies, which exhibit lower risk.
Investors Have Feelings
The size effect is the apparent tendency for the shares of small firms to outperform the shares of large firms. The book-to-market effect is the apparent tendency for the shares of companies with high book values (balance sheet values) relative to share prices to outperform the shares of companies with relatively low book values. DeBondt and Thaler (1987) argue that Regret Theory is consistent with
both the size and book-to-market effects. Psychologists have found that individuals who make decisions that turn out badly have more regret (blame themselves more) when that decision was relatively unconventional. Losses on shares in a major blue-chip firm cause less regret than losses on a small, little-known, firm. The former loss may be regarded as bad luck whereas the latter loss may be attributed to poor judgement. Higher book-to-market firms tend to have lower stock prices, perhaps because they are unfashionable or in difficulties. Investments in firms that are small, unfashionable or in difficulties are more unconventional. There is a high risk of feeling regret. Such investments are not the choices of the majority and require more courage and risk-taking on the part of investors. Investors are betting on the accuracy of their own judgement. More courage is required to make investments in the shares of small, unfashionable, or problematic firms and as a result the shares of such firms tend to be shunned by many investors. In consequence those shares tend to have current prices that are low relative to the objective characteristics of the firms. Such relative under-pricing provides potential for future out-performance in terms of the total returns on the shares.
In addition to cognitive biases, moods and emotions may have a role in investment decision-making. Hirshleifer and Shumway (2003) found that sunshine is strongly correlated with stock returns. Presumably sunshine causes investors to be happy and makes them feel more favourable towards investments. The relationship between mood (and emotions) and decision-making, has also been established by other researchers (Loewenstein, Weber, Hsee and Welch 2001; Slovic, Finucane, Peters and MacGregor 2002; Forgas 1995; Wright and Bower 1992; Kamstra, Kramer and Levi 2003). Even quantitative share pricing models involve an element of judgement that is affected by mood and emotion. For example dividend discount models, such as the Gordon Growth Model, involve estimates of future dividend growth rates. It may be that optimism arising from a good mood leads to a high estimate for the growth rate of dividends. That high estimate would result in the expected (fair) price of the share being relatively high. The rational investor of the Efficient Market Hypothesis is an
unemotional decision-maker. Emotions and moods may be irrelevant pieces of information that become reflected in share prices.
Users of pricing models are likely to be professionals. Shiller (1984) pointed out that most non-professional investors do not have knowledge of pricing models and investment analysis. They are