Services SETA Sector Skills Plan 2014/2015 1
Sector Skills Plan
2014-2015
Services SETA Sector Skills Plan 2014/2015
Official sign-off
It is hereby certified that this Sector Skills Plan:
was developed by the management of the Services SETA in consultation with the Department of Higher Education and Training
was informed by extensive literature reviews, data analysis and stakeholder engagement and research
accurately reflects the findings in terms of scarce and critical skills within documented limitations to inform strategy planning and performance priorities
Liesel Kӧstlich Signature: ______
Senior Manager: Research, Strategy and M&E Date: 29.01.2014
Johannes Mouton Signature: ___________
Chief Executive Officer Date: 29.01.2014
Themba Mhambi Signature: ______
Chairperson Date:29.01.2014
For more information, please contact: Services SETA PO Box 3344 Houghton 2041 South Africa Tel: +27 11 276 9600 Fax: +27 86 5277 026 Email: [email protected] ISBN: 1684 4122
Services SETA Sector Skills Plan 2014/2015
Forward
This Sector Skills Plan profiles the Services sector, analyses the current realities, identifies scarce and critical skills and discusses implications for planning. Steady growth within the tertiary economy and Services sector and, regulatory and technological change has resulted in structural shifts within the Services sector labour market and increased employer demands for qualified and skilled people. At the same time unemployment, particularly amongst the youth, remains high.
The Services SETA industry classification differs from international and national practice creating a reliance on primary data collection to identify scarce and critical skills and quantify demand. Data on Services sector employers requires more in-depth analysis and verification. Improvements in research methodology aimed at strengthening confidence and representivity of findings remains a challenge. A significant number of current occupational qualifications and learning interventions are being underutilised. Furthermore, addressing identified scarce and critical skills requires that these are readily available and employable. Impact on scarce and critical skills will only be realised when learners successfully complete relevant qualifications and are absorbed into the labour market or gain relevant experience and are retained. Developing new qualifications and strengthening provider capacity is costly and time consuming. These investments need to be informed by credible research.
Some progress has been achieved in strengthening organisational research capacity and applying academic research practices. Redefining scarce and critical, and aligning qualifications, occupations and skills will improve research questions and design. Ensuring responsive and expedited planning and implementation will become increasingly necessary.
Performance evaluations are designed to measure impact overtime. Such research seeks to verify barriers to completion across learning interventions and identify solutions for improvement. Other implications for planning and implementation include aligning and sequencing all elements in the skills development cycle including qualifications development, provider capacitation, career guidance counselling, partnerships, investment and contracting, and learner enrolment and successful completion. Transformational imperatives remain a priority in targeting beneficiaries.
JOHANNES MOUTON
Services SETA Sector Skills Plan 2014/2015 i
Contents
List of Tables ... iii
List of Figures ... iv
ACRONYMS ... v
SYNOPSIS ... 1
SECTION 1: RESEARCH METHODOLOGY ... 4
1.1 Background ... 4
1.2 Research design ... 4
1.3 Qualitative Study: Focus groups ... 5
1.4 Quantitative Study: Surveys ... 6
1.5 Peer review ... 7
1.6 Validation exercise ... 7
1.7 Secondary data analysis ... 8
1.8 Secondary Data Analysis ... 8
Section 2: SECTOR PROFILE ... 10
2.1 Purpose ... 10
2.1.1 Definition of the Services Sector ... 10
2.1.2 Economics of the Services Sector and its importance to the national economy ... 18
2.2.2 Workplace Skills Plan (WSP) ... 22
2.3 Findings ... 24
2.3.1 Geography ... 24
2.3.2 Employee Workforce Profile ... 26
2.3.3 Sub sector trends ... 28
Section 3: PESTEL ANALYSIS ... 34
3.1 Purpose ... 34
3.2 Political Analysis ... 34
3.3 Economic Analysis ... 35
3.3.1 Economic Performance and Outlook ... 35
3.3.2 Employment Trends ... 37
3.3.3 The Services SETA Sector Labour Market ... 39
3.3.4 The informal services sector ... 42
3.3.5 Industrial and Special Economic Zones ... 42
3.4 Social Analysis ... 43
Services SETA Sector Skills Plan 2014/2015 ii
3.6 Environmental Analysis ... 45
3.7 Legislative Analysis ... 46
3.8 General challenges in the Services Sector ... 51
3.9 Findings ... 53
Section 4: SCARCE AND CRITICAL SKILLS IDENTIFICATION ... 54
4.1 Purpose ... 54
4.1.1 Definitions of scarce and critical skills ... 54
4.2 Factors influencing demand ... 54
4.3 Scarce Skills Demand ... 56
4.4 Trends Analysis for Scarce Skills ... 64
4.5 Critical skills ... 65
4.6 Limitations in relation to this section ... 70
Section 5: IMPLICATIONS FOR PLANNING ... 72
5.1 Sectoral Skills Development Supply ... 72
5.1.1 HET enrolments and graduates ... 72
5.1.2 Services SETA Supply ... 73
Section 6: RECOMMENDATIONS FOR IMPROVEMENT ... 82
6.1 Changes and Improvements in Methodology ... 82
6.2 Peer Review ... 84
6.3 Challenges ... 84
6.4 Recommendations ... 84
Services SETA Sector Skills Plan 2014/2015 iii
List
of
Tables
Table 1: Stats SA and International SIC codes aligned to SETAs ... 10
Table 2: Sub Sector by size, levy paying and non-levy paying ... 12
Table 3: Scope of Coverage (Sub sector) ... 13
Table 4: Number of employers per sub sector ... 15
Table 5: Sub-sector descriptions ... 16
Table 6: Linkages with other sectors ... 17
Table 7: Employers by province and sub sector ... 26
Table 9: Annual percentage change in employment by industry 2006 – 2011 ... 40
Table 10: Employment by occupation 2006 – 2011 ... 40
Table 12: SIPs Categories ... 50
Table 13: Factors influencing labour supply and demand per sub-sector ... 55
Table 14: Scarce skills list ... 57
Table 15: Occupations removed after validation exercise ... 61
Table 16: Critical Skills list ... 65
Table 17: Cross-cutting critical skills ... 70
Table 18: Services SETA interventions by NQF levels ... 73
Table 19: 2013/2014 learner targets ... 74
Table 20: Research changes for SSP 2010 - 2013 ... 83
Services SETA Sector Skills Plan 2014/2015 iv
List
of
Figures
Figure 1: Basic 'Triangulation' Research Model ... 4
Figure 2: Finance, Real Estate and Business Services Sector GDP ... 19
Figure 4: Sector contribution to GDP growth rate 2011 – 2013 ... 20
Figure 5: Growth in SD Levy income over 6 years ... 21
Figure 6: LPE vs. NLPE ... 21
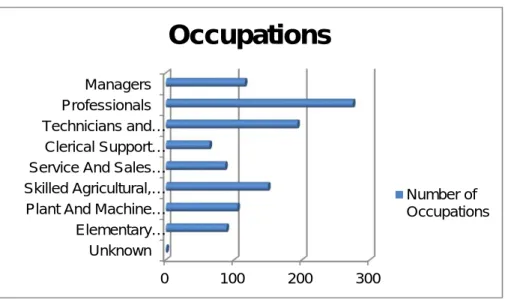
Figure 10: Employment statistics based on WSPs ... 23
Figure 11: Gross Domestic product per region 2012 ... 24
Figure 12: Employers by province and sub sector ... 24
Figure 13: Employee race ... 27
Figure 14: Employee gender split ... 27
Figure 17: Gross Domestic Product by Sectors ... 36
Figure 18: Employment in the Business Services ... 37
Figure 19: Companies by business size ... 38
Figure 20: Real Estate Services employment levels ... 38
Figure 21: Real Estate Services earning levels ... 38
Figure 22: Industries in demand ... 41
Figure 23: Industries in high supply ... 42
Figure 24: Services qualification enrolment 2010 – 2012 ... 72
Figure 25: Services qualification graduates 2010 – 2012 ... 73
Figure 26: Skills Development Cycle ... 74
Services SETA Sector Skills Plan 2014/2015 v
ACRONYMS
AET Adult Education and Training
AgriSETA Agricultural Sector Education Training Authority AIDS Acquired immune deficiency syndrome
APP Annual Performance Plan ATR Annual Training Report
BANKSETA Banking and microfinance sector Education and TrainingAuthority BBBEE Broad based black economic empowerment
BEE Black Economic Empowerment BPO Business Process Outsourcing
CATHSSETA Culture, Art, Tourism, Hospitality and Sport Education and Training Authority CCA Customs Controlled Areas
CCMA Commission for Conciliation, Mediation and Arbitration CEE Commission for Employment Equity
CEO Chief Executive Officer
CETA Construction Education and Training Authority
CHIETA Chemical Industries Education and Training Authority DEA Department of Environmental Affairs
DHET Department of Higher Education and Training DTI Department of Trade and Industry
EEA Employment Equity Act
ETDP SETA Education Training and Development Practices Sector Education and Training EWSETA Energy Water Sector Education and Training Authority
FASSET Finance and Accounting Services Sector Education and Training Authority FET Further Education and Training
FAIS Financial Advisory and Intermediary Services FICA Financial Intelligence Centre Act
FoodBev SETA Food and Beverages Manufacturing Sector Education and Training Authority FSB Financial Services Board
GATS General Agreement on Trade and Services GDP Gross Domestic Product
HEMIS Higher Education Information Management System HIV Human Immunodeficiency Virus
HDI Historically Disadvantaged Individuals
HR Human Resource
HRDS Human Resource Development Strategy
HRDSSA Human Resource Development Strategy of South Africa HSRC Human Sciences Research Council
HWSETA Health and Welfare Sector Educational Training Authority ICT Information Communication Technology
IPAP II Industrial Policy Action Plan II IPO Initial Public Offering
IDZ Industrial Economic Zone
INSETA Insurance Sector education and Training authority IT Information Technology
LGSETA Local Government Sector Education & Training Authority LPE Levy Paying Employer
Services SETA Sector Skills Plan 2014/2015 vi
MERSETA Manufacturing, Engineering and Related Services Sector Education and Training Authority MICT SETA Media, Information and Communication Technologies Sector Education and Training
Authority
MOU Memorandum of Understanding MQA Mining Qualifications Authority NGP New Growth Path
NIPF National Industrial Policy Framework NLPE Non-Levy Paying Employer
NQF National Qualifications Framework NSA National Skills Authority
NSDS National skills Development Strategy NCV National Certificate Vocational
OFO Organising Framework for Occupations
PESTEL Political, Environmental, Social, Technological, Economical and Legislation QCTO Quality Council for Trade and Occupations
RPL Recognition of Prior Learning
SANAC South African National AIDS Council
SASSETA Safety and Security Sector Education and Training Authority SAQA South African Qualifications Authority
SARS South African Revenue Services SDL Skills Development Levy SDLA Skills Development Levies Act SEDA Small Enterprise Development Agency SETA Sector Education and Training Authority SEZ Special Economic Zones
SKA Square Kilometre Array
SIC code Standard Industrial Classification code SIPs Strategic Integrated Projects
SME Small micro enterprises
SMME Small, Medium and Micro Enterprises SQAM Standards, Quality Assurance and Metrology SSP Sector Skills Plan
Stats SA Statistics South Africa
TETA Transport Education and Training Authority WSP Workplace Skills Plan
Services SETA Sector Skills Plan 2014/2015 1
SYNOPSIS
The Services SETA derives its legislative mandate from the Skills Development Act, 1998 (Act 97 of 1998). In accordance with Section 10 (a) of the Act, each SETA must develop a Sector Skills Plan (SSP) within the framework of the National Skills Development Strategy (NSDS). The Services SETA has prepared the SSP 2014/2015 update in accordance with the requirements of the Department of Higher Education and Training (DHET) and the policy context for skills planning which includes the NSDS III, the Human Resource Development Strategy 2010 – 2030, the National Skills Accord, the Youth Employment Accord, the Strategic Integrated Projects, the Green paper for Post-School Education and Training, the Quality Council for Trades and Occupation (QCTO) policies and various regulations such as the SETA Grant Regulations (released 3 December 2012, Gazette 25940).
This Sector Skills Plan (SSP) 2014/15 aims to give an overview of the economy and employers specific to the Services Sector. This enables the Services SETA to gain insight into the present environment and plan for the future. This is done by researching the scarce and critical skills needed in the Services Sector, outlining the current qualifications needed and those that need to be developed to ensure that gaps are identified and needs met to enable economic growth and expansion of the sector. The SSP is presented in six sections outlining definitions, research, findings, and implementation and planning. It aims to guide the reader through the process of defining scarce and critical skills and how plans will be implemented to meet sector demands.
Section one provides an overview of the research methodologies used to update the SSP. Information has been drawn from a number of sources which includes primary research, WSPs, the Services SETA employer’s database, Stats SA, the South African Reserve Bank and Career Junction. The research design employed was based on mixed method studies to collect information. A validation exercise with associations and peer review with the services cluster at DHET was also conducted. The mixed method study allowed the Services SETA to triangulate findings, validate research evidence and to update and improve on the sub sector sections.
The second section provides a definition of the Services Sector in terms of its scope and size and the economy in which it operates as well as the contribution to GDP of various sub-sectors. A description of the sub-sectors is provided and the linkages these services have with other sectors. The Services SETA employer database and Workplace Skills Plans were analysed for this section. Key findings are 27.9% of employers are levy paying and 72.1% is non-levy paying with 89% falling in the small business category. Largest sub sectors are Business Services, Real Estate Services and Hair Care. This section concludes with an overview of all 16 sub-sectors, identifying trends and providing a brief impression of the environment.
Section three examines the external factors and change drivers affecting the Services SETA sub-sectors by using a Political, Environmental, Social, Technological, Environmental and Legislative (PESTEL) Analysis. Policy drivers for the Services sector are discussed in terms of provision and impact for planning.
Fundamental changes impacting the sector are:
The National Skills Development Strategy (NSDS) III which promotes partnerships between employers, public education institutions (FET colleges, universities, universities of technology), private training providers and SETAs. NSDS III ensures increased access to training and skills development opportunities and measured against, key developmental and transformation imperatives of race, class, gender, geographic considerations, age, disability and the HIV and AIDS pandemic. It attempts to address the challenges of skills shortages and mismatches in the country and improve productivity in the economy.
Services SETA Sector Skills Plan 2014/2015 2
The SETA Grant Regulations Regarding Monies Received by a SETA and Related Matters which was published on 3 December 2012. The main purpose of the regulation is to improve the focus, management and effectiveness of grant spending. The most significant change is the reduction in the mandatory grant percentage from 50% to 20%, and the requirement to plan PIVOTAL training and report on implementation. One of the unintended consequences impact on skills development is a reduction in training and/or WSP submissions due to lack of incentives for employers to support skills development in their companies.
Broad-based black economic empowerment (BEE) has had a significant impact on the way business is done in South Africa. The amendments aimed to address issues like fronting, “tick box” compliance and exorbitant amounts of money that small enterprises have to pay for consultants to prove they were BEE compliant. The amendment to the BEE Codes of Good Practice was published on 11 October 2013. The increase of the threshold for qualification as an Exempt Micro-Enterprises is beneficial for the SME’s within the sector. The amendments will have a significant impact on businesses as the amended Codes have moved away from being broad-based to narrow-based ownership-centric black economic empowerment.
A few policies that have affected and are influencing business in the services sub sectors are:
The Consumer Protection Act which has an influence on all businesses as businesses will have to take greater care when interacting with customers to ensure that transactions are fair, reasonable and honest. This mainly affects sub sectors in sales and marketing.
The National Environmental Management Act (NEMA) has influenced the cleaning industry. Within South Africa, there is a trend of increasingly available “green” products and an increase in the amount of companies offering “green services”. In the cleaning services, environmental conservation laws have required cleaning companies to use eco-friendly chemicals which are costly. Recycling of waste has also been legislated for as standards have been set by the Department of Water and Environmental Affairs for the collection and handling of waste.
The Financial Advisory and Intermediary Services ACT, 37 of 2002 impacts on the postal services. The Acts were designed to protect consumers of financial products and services, regulate the selling and advice-giving activities and ensure consumers are provided with adequate information about the financial product they use and about the people and institutions who sell these financial products.
A major challenge for the Labour Recruitment services has been the amendments to the Employment Service Bill. Staffing providers for the Contact centre industry are also affected by amendment to the labour legislation. The effect of the bill will be added administrative burden on employers for compliance of business making smaller businesses difficult to sustain.
Stricter lending criteria’s as a consequence of the National Credit Act has impacted on the Real Estate Services in that mortgage loans are classified as credit agreements. The National Credit Act is aimed at regulating the consumer credit market by improving access to credit for those previously excluded, protecting consumers from becoming over-indebted and preventing dubious lending practices.
The following general observations can be made from the PESTEL Analysis:
Personal services such as hair care and beauty treatments are highly unregulated from a health and safety perspective, both in terms of products used in the market as well as general application of treatments. As such more effort can be channelled towards standardising best practice in these industries.
Services SETA Sector Skills Plan 2014/2015 3
Formalisation is a major issue affecting the cleaning, funeral, hair dressing and beauty treatment sub-sectors. This has impact on the scope of occupations, work standards and ethics within these sub-sectors.
Health and safety issues related to customer wellbeing as well as the environmental impact of business operations, is a dominating theme across most of the Services SETA sub-sectors.
SME’s as job creators will require technical assistance from the services sector to enable their growth and sustainability.
Real estate, labour, recruitment and contact centres have strong enforcement and regulatory regimes. Scarce and critical skills are identified in section four through various research methods and data analysis as described in section one. The outcomes of research are tabulated by sub-sector and outline the skill needs, occupation, intervention and NQF level. Occupations are illustrated as a low, medium and high priority. The demand for skills have been influenced by technology, changes in the world of work and environmental issues. Notably the demand for project manager is on the increase. Business across the sector has acknowledged research as a tool to gain competitive edge and social media training is in demand to market businesses. The top five scarce skills identified are Cleaning Supervisor, Mortuary Attendant, Cleaning Machine Technicians, Earthmoving plant operator and Afro-Hairdresser. The top critical skills have been identified as Databases Analytics, Computer Literacy including internet skills, plant hire operations, professional conduct and Business skills which including planning and business writing. Scarce skills can be addressed through bursaries, learnerships, apprenticeships or internships. The key change that the Department of Higher Education and Training and the SETA’s are trying to achieve is a stronger role for the workplace, and workplace experiential learning, in programmes addressing scarce skills occupations.
The supply and demand for skills in each sub-sector should be considered in order to tailor Services SETA interventions to impact these sub-sectors. It follows then that section five considers implications for planning in terms of the qualifications and skills required within the skills development cycle. Roleplayers will agree on the priorities for programmes aligned to both full qualifications (in respect of scarce skills) and clusters of unit standards or modules (in respect of critical skills). The seven priority programmes identified are persons with disability, small enterprises, cooperatives and non-profit organisations, FET and HET institutions, rural development, strategic integrated projects and youth and NEET. Data sources for this section were from the HEMIS, Services SETA service level agreement and qualification development.
The section looks at training and development of the current workforce, through the development and implementation of qualifications by the Services SETA, and support to Further and Higher Education and Training Institutions, mainly through a focus on the development of partnerships to address priorities identified in the SSP. The Services SETA has recognised two types of partnerships for implementation and planning. The first type of partnership under programme four of the Services SETA Annual Performance Plan (APP), is to facilitate the allocation and contracting of discretionary grants for the enrollment of funded learners to increase the flow of new entrants into the labour market. Roleplayers are public and private training providers, community-based organisations, cooperatives and NGOs. The second type of partnership under programme five of the Services SETA APP is to facilitate relationship responsiveness with key roleplayers for the purposes of mutual information sharing with stakeholders who include government, business organisations, trade unions, constituency bodies, public bodies, employers, trade and professional bodies. Relevant contractual partnerships resulting in commitments representing beneficiaries’ constituencies will be pursued where appropriate. This section ends with links to the Strategic Plan and Annual Performance Plan.
In conclusion the SSP reflects on recommendations for improvement in the research methodology in section six. A research agenda is included giving insight into future projects and the way forward in improving and enhancing the Sector Skills Plan. Peer reviews with the services cluster proved to be useful in terms of information sharing and best practices. This section also explores recommendations for quality information to inform Services SETA’s strategies in future years.
Services SETA Sector Skills Plan 2014/2015 4
SECTION 1: RESEARCH METHODOLOGY 1.1Background
In accordance with the legislative mandate from the Skills Development Act, 1998 (Act 97 of 1998), each SETA must develop a Sector Skills Plan (SSP) within the framework of the National Skills Development Strategy. NSDS III places emphasis on establishing a credible institutional mechanism for skills planning. Seta’s close contact with industry places them in a good position to document and communicate recent and emerging trends in the economic sectors. SSPs provide an overview of the sector in terms of its profile, trends in employment and other factors affecting the sector, to enable the SETA to plan for training interventions. Another important purpose of a SSP is to identify scarce and critical skill demands. For this, sound research methodologies are required to cover the scope of the Services SETA 16 sub sectors.
1.2Researchdesign
The research design employed was based on mixed method studies in order to triangulate findings. The purpose of triangulation is to increase the credibility and validity of the results. The idea is that the Services SETA can be more confident with results if different methods lead to the same result. This method is a powerful technique that facilitates validation of data through cross verification from two or more sources. As it refers to the application and combination of several research methodologies in the study of the same phenomenon, the Services SETA used both quantitative (validation) and qualitative (inquiry) studies with similar questions in each of the research instruments. Figure 1 illustrates the basic triangulation research method.
Figure 1: Basic 'Triangulation' Research Model
The SSP is based on the following research methods:
This mixed method study was used to update and improve on the sector dynamics, PESTEL influences and scarce and critical skills list to enable the Services SETA to better respond to the demands of employers. The two modes of research used are quantitative and qualitative research methods. Both methods helped answer
Services SETA Sector Skills Plan 2014/2015 5
questions and confirm knowledge, to address SSP issues. Other methods employed were a review of existing data and information sources which including Stats SA, the Services SETA employer data base, the South African Reserve Bank Annual Economic report and workplace skills plans and annual training reports. Consultation meetings were also held with Services SETA Managers and the Accounting Authority Risk and Strategy subcommittee and a peer review process with the Services cluster as grouped by DHET.The next sections describe the research methodology, sampling, data collection and data analysis for the methods used.
1.3
QualitativeStudy:
F
ocusgroupsPurpose
The purpose of the focus groups was to obtain rich sets of input for the SSP to gain insight into employer’s businesses. The research questions were scarce and critical skills, PESTEL factors affecting their business, past trends, future trends and priority areas for the sub sector.
Method
Regional visits were designed to include one urban area and one rural area in each province in order to get a national view of needs. Focus group discussions were used to gather data using a semi-structured discussion guide with open-ended questions to solicit more information from participants. Participants were clustered into types of Services SETA chambers.
Sampling
A purposive sampling strategy was used to represent all sub sectors in the SETA, cooperatives, NGOs and FET and HET colleges throughout the country. The total number of delegates that attended is 2 013 with 17 sessions. Below is a list of the 17 sessions and 47 focus groups the region.
FOCUS GROUPS
Urban regions Participants Focus groups
Free State - Bloemfontein 96 4
Western Cape - Cape Town 257 3
KZN – Durban 102 4
Eastern Cape - East London 120 4
Gauteng – Midrand 256 4
Limpopo – Polokwane 140 3
Mpumalanga – Nelspruit 130 4
Eastern Cape - Port Elizabeth 177 3
Northern Cape - Kimberly 84 1
Gauteng – Parktown 76 3
Rural regions
Free State - Welkom 46 3
Western Cape - George 42 3
KZN - Port Shepstone 116 4
KZN - Ladysmith 155 2
Limpopo - Tzaneen 79 1
Mpumalanga - Secunda 48 1
Northern Cape - Upington 89
Total 2 013 47
Data collection
Focus groups were held from February to April 2013. Each focus group was allocated a scriber and a facilitator and notes were forwarded for analysis. Each focus group had a facilitator to direct conversation.
Services SETA Sector Skills Plan 2014/2015 6
The data was prepared for analysis by checking the raw data for any errors and omissions that may compromise quality standards and data integrity. The data was analysed systematically using the identified themes by sub sectors.
1.4
Quantitative
Study:Surveys PurposeThe main purpose was to obtain the magnitude of the needs of scarce and critical skills required for the sub sector in order to compile projections for the scarce and critical skill list.
Method
During the regional visits, a one page questionnaire was distributed to the audience in order to supplement information from the focus groups and to gain data from all participants for projections of scarce and critical skills.
Sampling
A convenience sampling technique was selected due to the availability of respondents attending the focus groups.
Data collection
Hand out (self-completion) surveys was administered at the 47 focus group sessions. The advantage of this method is that it capitalised on having respondents available and Services SETA staff was able to personally convey the purpose and importance of the survey to respondents and were able to answer questions from participants. The survey was structured with one open-ended question. In total 649 surveys were collected. Participants were as follows:
Sub sectors Participants
Beauty treatment 14 Business services 185 Cleaning 79 co-op 15 Collective services 4 Contact centre 1 event management 2 Fashion 2 FET 5 Funeral services 28 Government department 4 Hair Care 14 HET 3 Hiring Services 30 Household services 1
Labour Recruitment Services 51
Marketing and Communications 20
NGO, CBO 42
Other 38
Postal Services 2
Project Management 10
Real Estate services 38
Training providers 61
Services SETA Sector Skills Plan 2014/2015 7
Data analysis
The data was prepared for analysis by checking the raw data for any errors and omissions that may compromise quality standards and data integrity. In some instances sub sectors were not specified in the questionnaires. Data analysis entailed organising specific facts about the sub sectors, categorising the data to help cluster them into meaningful groups and interpretation of the data were scrutinised for underlying themes and other patterns informed the 2014/2015 SSP. Data was captured on the Questback research system for analysis and raw data was extracted to Microsoft excels for open ended questions. Data from closed ended questions were extracted from Questback in power point format.
1.5Peerreview
SETAs were clustered into economic sectors for a peer review process for the evaluation of SSPs in 2013. The objective was reciprocal learning in the areas of data collection, context of planning and SSPs translation into SETA strategic plans. W & R SETA was the lead SETA for the services cluster which included the SSETA, Transport SETA and Culture, Art, Tourism, Hospitality and Sport SETA. The Services Cluster peer review meeting convened in September 2013, followed by the Services Cluster Peer review Report which was submitted to the DHET on 2October 2013. The cluster identified best practices and challenges with recommendations for expanding their work.
1.6
ValidationexerciseA validation exercise was conducted with Services SETA Associations to validate the research findings on scarce skills. The research methods employed was customised online questionnaires for each sub sector with closed ended questions based on the criteria for validation. These online questionnaires were available for self-completion from 9 – 17 October 2013. This exercise was based on the recommendations of the Services Cluster peer review. The methodology was based on the best practice from W & R SETA and TETA where all occupations considered for the Scarce Skills List were evaluated by stakeholders according to six criteria. The criterion used is:
•
Entry to the occupation requires a long lead time of formal education and training – 3 years.•
Skills which people acquire are being deployed for the uses intended.•
Shortage of skills causes a significant cost to the company.•
Hard to fill vacancies - more than 3 months to find suitable candidate•
There is research and documented evidence to identify an occupation as a scarce skill•
The nature of the job is critical to the core business functionFor an occupation to be eligible for inclusion on the Scarce Skills List, at least 3 out of the 6 criteria should be met. This selection process was undertaken by sub sector associations who possess the knowledge and understanding of skills development and who rated occupations based on the criteria above.
Participating associations were from the following sub sectors:
Sub sectors Participants
Labour Recruitment 20 Beauty Treatment 1 Business services 1 Cleaning 3 Collective services 1 Contact Centre 7 Events Management 3 Funeral Services 1
Services SETA Sector Skills Plan 2014/2015 8
Hair Care 2
Hiring Services 4
Interior Designing 1
Marketing and communication 32
Postal services 0
Project Management 0
Real Estate 4
Total 80
Results were analysed systematically through the online research tool Questback.
Furthermore, the scarce and critical skills lists in section four were developed to reflect the magnitude of the needs of the SSETA’s 155 464 employers. Projections were based on the unallocated employers in all sub-sectors.
The calculations were done as follows:
Instrument = (Unallocated members)/ (Sub Sector Grand Total)×100 (Size of company per sub sector) Projected Magnitude = Instrument × magnitude for 2014/15 (Scares/Critical)
1.7Secondarydataanalysis
Two sources of data were used to collect information for the purpose of discussing Services SETA employers’ profile. WSPs inform SETAs of the employers' skills development needs and enable the SETA to render support. Information is used primarily for demographic and geographic profile.
The other source used to derive the information in Table 2 (page 5) was informed by the Services SETA levy paying and non-levy paying employers database. This database is compiled by the South African Revenue Service (SARS) based on levies collected monthly against skills development levy (SDL) numbers. The July 2013 upload was used for the SSP update and was analysed in Microsoft Excel. Closed companies were excluded from the analysis. “Unclassified” companies related to those employers whose levy paying status had not been verified and “unallocated” refers to companies who had not been allocated a sub-sector.
1.8
SecondaryDataAnalysisData was supplement by Stats SA Quarterly household survey and Quarterly Labour force survey, the South African Reserve Bank Annual Economic Report and the CareerJunction index report.
Stats SA
Quarterly household survey
This report presents the results of the General Household Survey (GHS) conducted annually by Statistics South Africa from 2002. The survey collects information on a variety of subjects including education, health, the labour market, dwellings, access to services and facilities, transport, and quality of life. The survey was introduced to address a need identified by the Government of South Africa to determine the level of development in the country and to measure, on a regular basis, the performance of programmes and projects that were implemented to address these needs.
Services SETA Sector Skills Plan 2014/2015 9
Stats SA Quarterly Labour Force Survey is specifically designed to measure the dynamics of the South African labour market, producing indicators such as employment, unemployment and inactivity. It measures a variety of issues related to the labour market, including the official unemployment rate. The sample size for the Quarterly Labour Force Survey is roughly 30 000 dwellings per quarter. The sample is designed to be representative at provincial level and within provinces at metro/non-metro level. Within the metros, the sample is further distributed by geography type.
South African Reserve Bank Economic Report
The Annual Economic Report provides the broader economic context of primary, secondary and tertiary sectors and the focus was in the review of economic events is on the calendar year 2012 and the first half of 2013. Attention is also given to institutional, legislative and regulatory changes introduced during the period under review that have a bearing on the economy and its functioning.
Career Junction Index
Although online recruitment information should not be used exclusively to determine where jobs exist and in what quantities, it does give some idea of job demand. But when compared to Stats SA quarterly employment statistics report which is based on a survey of 20,208 tax-paying private and public enterprises, Career Junction uses a sample of 2.4 million which includes their portfolio of registered job seekers and the thousands of jobs published on Career Junction every month. The Career Junction Index reported major demands for employment for the services sector in Recruitment.
Document Review
Services SETA Sector Skills Plan 2014/2015 10
Section 2:
SECTOR PROFILE
2.1Purpose
It is important to define and understand the labour market in which the Services SETA operates and the scope and nature of its economic activities therein. The Sector Profile facilitates the analysis of data covering a wide spectrum of standard industry classification (SIC) codes. It includes the definition of the Services Sector, the scope of coverage into manageable sub-sectors, the size and shape of the sector, linkages with other sectors, economics of the Services Sector and its importance to the national economy, Workplace Skills Plan data, as well as employer and sector profiles and trends in the sector.
2.1.1DefinitionoftheServicesSector
The Services Sector, in the South African skills development context, refers to a cluster of 70 SIC codes which have been determined by the Minister of Higher Education and Training, and fall within the scope of the Services SETA. This should not be differentiated with the tertiary sector of the economy, as outlined in section 2.1.2. The ministerial determination of the Sector SIC codes has delineated a sector unique to South Africa’s skills development landscape.
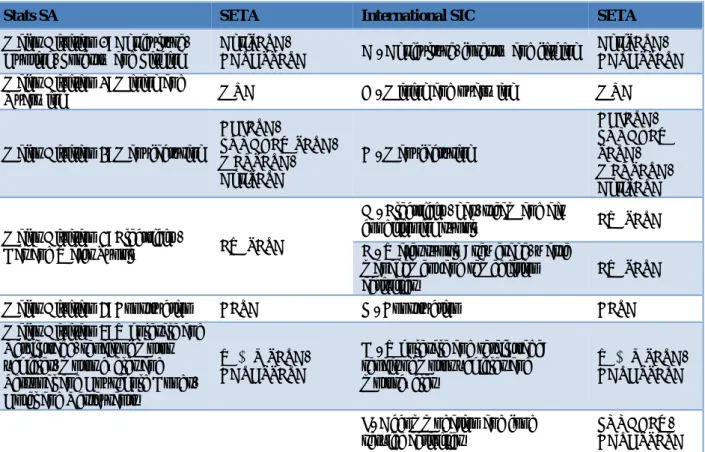
There are various approaches to categorising industries and occupations used internationally in order to describe the “Services Sector”. The definitions from the General Agreement on Trade and Services (GATS) and the World Trade Organisation (WTO) refer more, in the South African context, to the tertiary sector of the economy concerned with the provision of services. South Africa has adopted these conventions for use primarily by Stats SA who are the legislated custodians of market, population, economic and government data in the country. The Services SETA SIC codes can be found across three Stats SA major divisions and six International SIC code sections as seen in table 1.
Table 1: Stats SA and International SIC codes aligned to SETAs
Stats SA SETA International SIC SETA
Major Division 1: Agriculture,
Hunting, Forestry and Fishing AgriSETA, CATHSSETA A - Agriculture, forestry and fishing AgriSETA, CATHSSETA Major Division 2: Mining and
Quarrying MQA B - Mining and quarrying MQA
Major Division 3: Manufacturing
CHIETA, FOODBEV SETA, MERSETA, AgriSETA C - Manufacturing CHIETA, FOODBEV SETA, MERSETA, AgriSETA Major Division 4: Electricity,
Gas and Water Supply EW SETA
D - Electricity, gas, steam and air
conditioning supply EW SETA
E - Water supply; sewerage, waste management and remediation
activities EW SETA
Major Division 5: Construction CETA F - Construction CETA
Major Division 6: Wholesale and Retail trade, repair of motor vehicles, motor cycles and Personal and Household Goods, Hotel and Restaurants
W & R SETA, CATHSSETA
G - Wholesale and retail trade; repair of motor vehicles and motorcycles
W & R SETA, CATHSSETA
Services SETA Sector Skills Plan 2014/2015 11
Major Division 7: Transport,
Storage and Communication SSETAMICT SETA , TETA,
H - Transportation and storage TETA, SSETA J - Information and communication MICT SETA
Major Division 8: Financial Intermediation, Insurance, Real Estate and Business Services
BankSETA, FASSET, SSETA, INSETA
K - Financial and insurance activities
BankSETA, FASSET, INSETA L - Real estate activities SSETA M - Professional, scientific and
technical activities SSETAFASSET ,
Major Division 9: Community, Social and Personal Services
SSETA, ETDP SETA, HWSETA, LG SETA, SASSETA
O - Public administration and defence; compulsory social security
SASSETA
P - Education ETDP SETA
Q - Human health and social work
activities HWSETA
R - Arts, entertainment and
recreation CATHSSETA
Major Division 0: Private Households, Exterritorial organisations, Representatives of Foreign Governments and other Activities not Adequately defined
SSETA, SASSETA
T - Activities of households as employers; undifferentiated goods- and services-producing activities of households for own use
SSETA
N - Administrative and support
service activities SSETA
S - Other service activities SSETA
The classification reflected in Table 2 is unique to the South African Services SETA environment and as such does not generate much comparative data nationally and internationally. Readily available research and market data is not organised according to this clustering. For this reason it is not possible to define the Sector without giving context and conducting primary research. In order to facilitate the analysis of data covering 70 SIC codes and to provide optimal support to companies and organisations, the Services SETA established six Chambers which cover 16 sub-sectors. It is the intention of the Services SETA to organise its services and consultations within the Chambers, and to plan sector and skills development interventions relevant to these sub-sectors.
Services SETA Sector Skills Plan 2014/2015 12
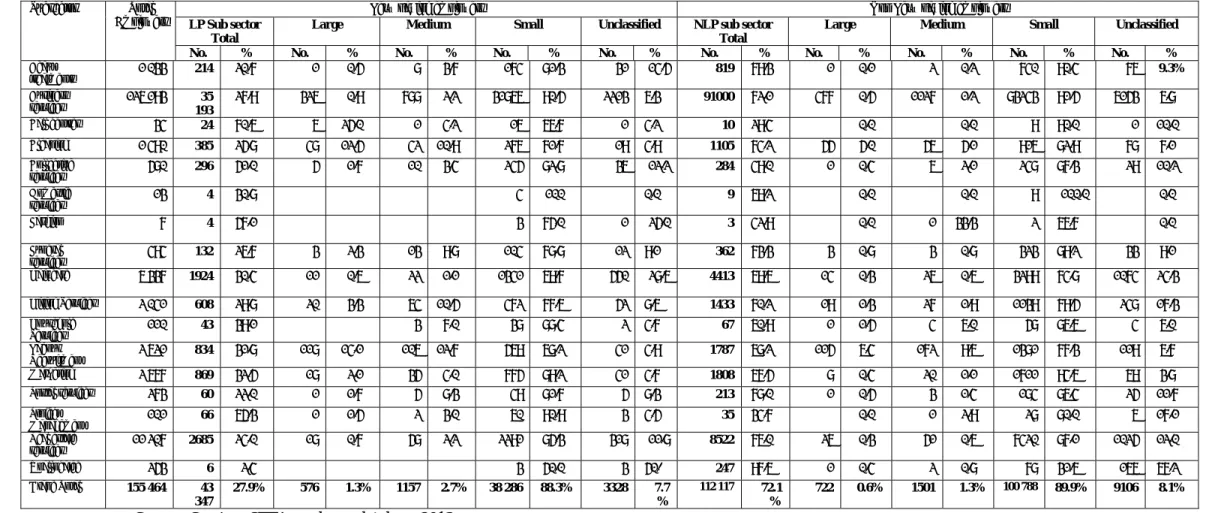
Table 2: Sub Sector by size, levy paying and non-levy paying
Source: Services SETA employer database 2013
Subsector Total
Employers
Levy paying employers Non Levy paying employers
LP Sub sector Total
Large Medium Small Unclassified NLP sub sector
Total
Large Medium Small Unclassified
No. % No. % No. % No. % No. % No. % No. % No. % No. % No. %
Beauty treatments 1 033 214 20.7% 1 0.5% 8 3.7% 174 81.3% 31 14.5% 819 79.3% 1 0.1% 2 0.2% 740 90.4% 76 9.3% Business services 126 193 193 35 27.9% 326 0.9% 788 2.2% 31866 90.5% 2213 6.3% 91000 72.1% 477 0.5% 1127 1.2% 83243 91.5% 6153 6.8% Call centres 34 24 70.6% 6 25.0% 1 4.2% 16 66.7% 1 4.2% 10 29.4% 0.0% 0.0% 9 90.0% 1 10.0% Cleaning 1 490 385 25.8% 48 12.5% 42 10.9% 276 71.7% 19 4.9% 1105 74.2% 55 5.0% 56 5.1% 916 82.9% 78 7.1% Collective services 580 296 51.0% 5 1.7% 10 3.4% 245 82.8% 36 12.2% 284 49.0% 1 0.4% 6 2.1% 248 87.3% 29 10.2% Domestic services 13 4 30.8% 4 100% 0.0% 9 69.2% 0.0% 0.0% 9 100.0% 0.0% Fashion 7 4 57.1% 3 75.0% 1 25.0 % 3 42.9% 0.0% 1 33.3% 2 66.7% 0.0% Funeral services 494 132 26.7% 3 2.3% 13 9.8% 104 78.8% 12 9.1% 362 73.3% 3 0.8% 3 0.8% 323 89.2% 33 9.1% Hair care 6 337 1924 30.4% 11 0.6% 22 1.1% 1341 69.7% 550 28.6 % 4413 69.6% 14 0.3% 26 0.6% 3299 74.8% 1074 24.3% Hiring Services 2 041 608 29.8% 20 3.3% 64 10.5% 472 77.6% 52 8.6% 1433 70.2% 19 1.3% 27 1.9% 1139 79.5% 248 17.3% Household Services 110 43 39.1% 3 7.0% 38 88.4% 2 4.7% 67 60.9% 1 1.5% 4 6.0% 58 86.6% 4 6.0% Labour Recruitment 2 621 834 31.8% 118 14.1% 106 12.7% 569 68.2% 41 4.9% 1787 68.2% 115 6.4% 172 9.6% 1381 77.3% 119 6.7% Marketing 2 677 869 32.5% 18 2.1% 35 4.0% 775 89.2% 41 4.7% 1808 67.5% 8 0.4% 20 1.1% 1711 94.6% 69 3.8% Postal services 273 60 22.0% 1 1.7% 5 8.3% 49 81.7% 5 8.3% 213 78.0% 1 0.5% 3 1.4% 184 86.4% 25 11.7% Project Management 101 66 65.3% 1 1.5% 2 3.0% 60 90.9% 3 4.5% 35 34.7% 0.0% 1 2.9% 28 80.0% 6 17.1% Real estate services 11 207 2685 24.0% 18 0.7% 58 2.2% 2291 85.3% 318 11.8% 8522 76.0% 26 0.3% 51 0.6% 7420 87.1% 1025 12.0% Unallocated 253 6 2.4% 3 50.0% 3 50.% 247 97.6% 1 0.4% 2 0.8% 78 31.6% 166 67.2% Grand Total 155 464 43 347 27.9% 576 1.3% 1157 2.7% 38 286 88.3% 3328 7.7 % 112 117 72.1 % 722 0.6% 1501 1.3% 100 788 89.9% 9106 8.1%
Services SETA Sector Skills Plan 2014/2015 13
Table 2 provides a breakdown of levy paying (27.9%) and non-levy paying (72.1%) employers by sub sector and size of business (small, medium and large). Levies are guided by the Skills Development Levies Act (SDLA). The SDLA requires all employers to pay a skill development levy (SDL) each month towards the National Skills fund. The SDLA applies to all employers except those in the public service; religious or charitable organisations; public entities funded by more than 80% by government; and employers whose total pay to workers is less than R500 000 annually and those that do not have to register according to the Income Tax Act. The levy income of the Services SETA is a portion of the 1% of payroll paid by registered employers to SARS. This defines levy paying employers (LPE). Employers exempt from paying the SDL and that fall within the scope of Services sector can register with Services SETA as a non-levy paying employers (NLPE) in order to qualify to participate in specific Services SETA benefits.
According to Services SETA database uploaded from DHET and SARS in July 2013, the service sector consists of 155 464 employers distributed across the 16 sectors. The dynamics of each sub-sector are different. Some sub-sub-sectors may have fewer employers but represent high employment rates and high turnover. Other employers may be influenced by barriers to entry which include; level of skill required for business establishment, core business, regulatory environment, capital outlay, access to markets, and technology. The largest sub sectors in the Services SETA are Business Services, Real Estate and Related Services and Hair Care. The sector comprises of 89% small companies.
The sub-sectors are determined by clusters of SIC codes and represent Services SETA employers offering services that are interrelated or have a common business activity. The clustering of sub-sectors enables the Services SETA to plan and organise skills development interventions for its employers. Table three provides a breakdown of the scope of coverage of the services sector.
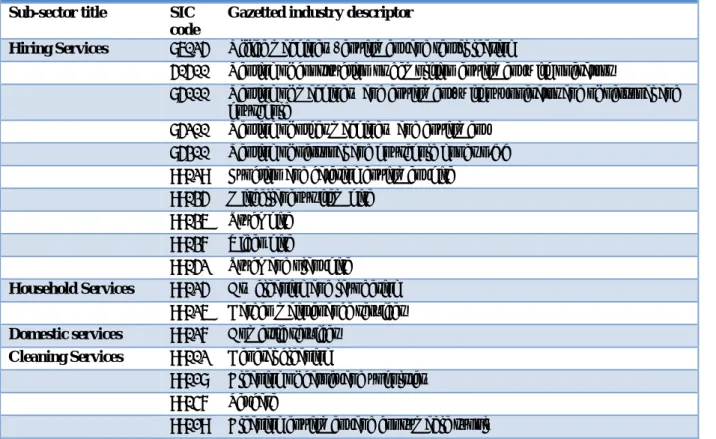
Table 3: Scope of Coverage (Sub sector)
Services SETA sector chambers and sub-sectors
Chamber 1: cleaning and hiring services Sub-sector title SIC
code
Gazetted industry descriptor
Hiring Services 86025 Office machinery, equipment and rental leasing
50500 Renting of construction or demolition equipment with operators
85000 Renting of machinery and equipment, without operator and of personal and household
85200 Renting of other machinery and equipment 85300 Renting of personal and household goods n.e.c 99029 Function and catering equipment hire
99035 Miscellaneous item hire 99036 Truck hire
99037 Video hire
99052 Truck and plant hire Household Services 99025 Dry cleaning and laundering
99026 Garden maintenance services Domestic services 99027 Domestic services
Cleaning Services 99002 General cleaning
99018 Cleaning of carpet and upholstery 99047 Pet care
Services SETA Sector Skills Plan 2014/2015 14
Chamber 2: Communications and management services Marketing and
communication
9001 Marketing services
9002 Marketing communications (Inc. Public relations) 9008 Direct Marketing
88130 Market research and public opinion polling 99038 Brand marketers
Contact centres 99055 Contact centre management of people Postal services 75110 National postal activities
75111 Banking via post office 75121 Mail handling
Chamber 3: Labour and collective services Labour recruitment
Services
88918 Permanent employment agencies 88910 Labour recruitment and provision of staff
88916 Private employment agencies and temporary employment services 99045 Personnel services agencies
88917 Temporary employment services Collective services 95120 Activities of professional organisations
95155 Professional bodies
95991 Bargaining councils and dispute resolution 95992 Associations, federations and umbrella bodies Chamber 4: Management and business services
Business services 61421 Import and export of various metals 88000 Other business activities
88141 General consulting services 88900 Business activities n.e.c. 96490 Other recreational activities 99000 Other service activities
99014 Quality management and related services 99016 Ngo management and services
99015 Non-financial business management and management consulting 99090 Other service activities n.e.c
Project management 99039 Generic project management
99056 Event and conference management excluding the operation of convention centres
Chamber 5: Personal care services
Hair care 99022 Ladies hair dressing
99023 Men’s and ladies hairdressing Beauty treatment 99024 Beauty treatment
99041 Nail technology including nail technologist, nail technicians and distributors and agencies of nail products
99042 Non-allied registered perfumery including aromatic oils and related products, perfumery consultants, sales people and agencies of nail products 99043 Health and skin care incl. health and skin care therapists, stress therapists
Services SETA Sector Skills Plan 2014/2015 15
including slimming machines 99044 Make-up artistry
99050 Distributors of slimming products including slimming machines 99051 Distributors of makeup products and related merchandise Funeral services 34260 Cutting, shaping and finishing of stone
99030 Funeral and related activities 99033 Coffin making by funeral enterprises Fashion 99046 Modelling agencies
99054 Fashion design not related to clothing Chamber 6: Real estate and related services
Real estate services 50411 Decorators/interior designers and decorators 84000 Real estate activities
84100 Real estate activities with own or leased properties 84200 Real estate duties on a fee or contract basis 84201 Real estate valuation services
84202 Property management services 84203 Estate agencies
99053 Valuers, including auctioneers
Table 4 depicts the number of employers per sub-sector over a three year period. Business services are the largest sub-sector with 126 193 (81%) employers. These are typically professional services organisations that are characterised by very low barriers to entry. Three sub-sectors, namely Contact Centres, Domestic Services and Fashion, have less than 100 employers each.
Table 4: Number of employers per sub sector
Sub-sector Number of Employers (2011) Number of Employers (2012) Number of Employers (2013)
Marketing and communication 2 582 2 647 2 677
Contact centres 29 33 34 Hiring Services 1 859 2 020 2 041 Household Services 92 106 110 Domestic services 11 12 13 Cleaning 1 446 1 481 1 490 Postal services 267 273 273
Labour recruitment Services 2 530 2 589 2 621
Collective services 550 574 580 Business services 120 109 124 311 126 193 Project management 39 98 101 Hair care 6 301 6 321 6 337 Beauty treatment 997 1 017 1 033 Funeral services 480 493 494
Services SETA Sector Skills Plan 2014/2015 16
Fashion 6 6 7
Real estate services 10 895 11 082 11 207
Unallocated 339 253 253
Total 148 532 153 316 155 464
Source: Services SETA employer database (2011, 2012, 2013)
Table 5 provides typical employers located within the sub-sectors. It endeavours to give a definition of the sub-sector through unpacking its typical membership base.
Table 5: Sub-sector descriptions
Services SETA employers and their services
Hiring Services Truck and construction plant hire; building and construction equipment; earthmoving, excavating and crane hire; hire function, office supplies and equipment; small tool hire; video hire; clothing, garment, costumes and other equipment hire.
Household
Services Garden maintenance - maintain the general health or condition, and the presentation of a garden; lawn mowing, lawn repair and renovation; pruning, spraying pesticides, fertilising or soil care, replacing old or sick plants, maintaining indoor plants, tree surgery
Dry cleaning and laundering - family and commercial laundries; garment pressing; and agents and other laundry facilities.
Domestic
Services The employment of hired workers by private households for the performance house cleaning, child care, cooking, gardening and personal services. The performance of similar tasks for hire in public institutions and business, including hotels and bordering houses
Cleaning The provision of cleaning services to individuals, households, and businesses (contract cleaning): general cleaning services; cleaning of carpets and upholstery; industrial cleaning and pet care.
Marketing Includes marketing and public relations. Identifying client needs; planning and executing services to meet clients’ objectives; promote a company’s image or products amongst the public, researching, promoting, selling and distributing products or services; branding – developing public awareness of a company and its brand; four key roles - products and services; promotion; distribution and pricing.
Contact centres A centralised office used for Business Process Outsourcing. The purpose is for receiving and transmitting large volume of requests by telephone; administering incoming calls for product support or information enquiries from consumers; outgoing calls for telemarketing, clientele, product services, and debt collection.
Postal Services Activities related to the this service are national postal activities; banking via the Post Office; mail handling and courier services; connecting with the world by distributing information, goods, financial and government services.
Labour Recruitment Services
Companies offering employment services; permanent and temporary employment agencies; labour recruitment and provision of staff; labour broking – the provision of persons with skills needed by employers for a defined period of time; companies offering outsourced human resources services
Collective Services
Bargaining councils; collective bargaining on terms and conditions of employment; the negotiation of collective agreements; conciliation, mediation and arbitration services.
Business Services
Management consultants; business advisors; management and outsourcing of payroll services; administration services; quality management; Black Economic Empowerment (BEE) verification agencies; organisations and independent consultants providing services in a particular area such as quality management, general management, payroll, the environment, technology, human resources, marketing, communication, engineering etc.
Project
Management Methodical approach to planning and guiding project processes from start to finish; five stages: initiation, planning, executing, controlling, and closing. Project managers oversee teams working on individual projects in a variety of fields, including construction, engineering and business. An effective project manager needs a diverse skill set.
Services SETA Sector Skills Plan 2014/2015 17
cutting, colouring and styling hair. Cosmetologists may be trained to give manicures, pedicures and scalp and facial treatments, provider make-up analysis and clean and style wigs and hairpieces. Beauty
Treatment Beauty treatment, nail technology, product distribution and marketing and sales.
Funeral Services Burial and cremation of human or animal corpses. Related services include burial services, the rental of equipped space in funeral parlours, undertaking services, the rental or sale of graves and the upkeep and maintenance of graves.
Fashion Fashion and modelling requirements are not dictated by the fashion trade but by the clientele. The main modelling categories are editorial, fashion and commercial.
Real Estate Services
Residential, commercial, and industrial property management for buying and selling; interior design; construction businesses requiring real estate services specialists; professional valuation services; auctioneers; developers adding to or replacing buildings; leasing of property; property management: managing a property for its owner(s), which includes facilities management; real estate marketing; real estate investing; any business performing a task regulated in terms of the Estate Agency Affairs Act 112 of 1976 and the Property Valuers Profession Act of 2000.
Roleplayers in other Sectors
The Services SETA is linked to other sectors of the economy such as the Transport Sector, in terms of postal courier and distribution; the Mining and transport Sector for plant and operator hiring; and the Chemical and Manufacturing Sectors for products used in hair care. For this reason the Services SETA must work closely with these and other related sectors for the identification and delivery of industry-specific programmes. Table 6 demonstrates the Services SETA linkages with other sectors of the economy.
Table 6: Linkages with other sectors
Sub-sector Linkages to Other Sectors
Hiring Services The Mining Sector typically hires plant and other equipment. Due to the seasonality and project nature, the Construction Sector hires plant and machinery from the Hiring services sub-sector to complete their assignments.
Tourism and Transport Sectors interface with the sub-sector through hiring of vehicles
Cleaning The Cleaning sub-sector provides its services to the Property Sector and hospitals while cleaning supplies are sourced from the Chemical and Manufacturing Sector
Household Services Typical customers is the Tourism, Hospitality and Environmental Sector Domestic Services Typical customers is the Tourism and Hospitality Sector
Contact Centres Most organisations across all sectors have internal contact centres and those that do not, generally outsource the function to this sub-sector
Marketing and
Communication Marketing Services are required by all sectors of the economy, typically by organisations that do not have an internal marketing function or those that prefer to augment their internal skills through external expertise
Postal Services The Postal Service relies increasingly on the Transport Sector (courier, distribution) to deliver mail and parcels timeously. The provision of banking services through the Post Office links this sub-sector to the Banking Sector (Financial and commercial services). It is also linked to ICT, Marketing and Communication.
Services SETA Sector Skills Plan 2014/2015 18
Labour Recruitment
Services Labour Recruitment is a service that is offered to all sectors of the economy either for permanent, temporary or seasonal employment services. This includes headhunting and specialist recruitment of staff.
Collective Services Bargaining Councils, Associations, Federations and Umbrella Bodies all represent collective formations across all sectors of the economy
Business Services Business Services, business consulting, management, payroll, administration and secretarial services are required by all organisations across all sectors.
Project Management Project management is a wide field and is a function required by all sectors of the economy to deliver projects of various forms or sizes
Funeral Services The Funeral sub-sector value chain typically includes the Manufacturing Sector, Transport Sector and the Insurance Sector
Hair Care This sub-sector relies heavily on the Chemical and Manufacturing Sectors for hair care products. Other sectors are the Health and Welfare, Wholesale and
Retail and manufacturing sector
Beauty Treatment This sub-sector relies on the Chemical and Manufacturing Sectors for beauty treatment products. Other sectors are Health and Welfare, Wholesale and
Retail, Tourism and the manufacturing sector
Fashion The Fashion sub-sector interfaces with the Clothing and Textiles Sector, Wholesale and Retail Sector, motion picture industry and Tourism Sector. Real Estate Services The Real Estate Services value chain includes the Agriculture, Banking,
Construction, Development Finance, Energy, Environment and Waste, Forestry and Paper, Insurance, Public Sector Entity, Retail, Tourism and Leisure, Utilities sectors
2.1.2EconomicsoftheServicesSectoranditsimportancetothenationaleconomy
Economic sectors refer to the division of a country’s population by the area in which they are employed. Economies are broken down into three sectors, although some recognise an extra two namely the quartery and quinary sectors for intellectual activities and high level decision makers respectively. For the purposes of this SSP the three more common sectors will be defined.
Primary Sector
The primary sector of the economy deals with the retrieval of mineral resources or raw materialsand would include agriculture, mining and other natural resources.
Secondary Sector
The secondary sector involves the transformation of raw materials retrieved from primary sector industries in the making of goods or products and materials. This sector includes manufacturing, engineering and construction
Tertiary Sector
The tertiary sector is also known as the services sector. Services are supplied to businesses and consumers and can be defined as activities where people offer their knowledge and time to improve productivity, performance, potential, and sustainability. This is the sector in which Services SETA operates and the businesses herein provide the focus for the work done by the Services SETA.
Services SETA Sector Skills Plan 2014/2015 19
The Services sector forms an integral part of the South African economy. South Africa has historically been characterised as a primary sector economy with the highest GDP contribution coming from mining and agricultural activities. This has changed with growth in the provision of tertiary services. The challenge with data is that the Stats SA and the DHET do not use similar classification of services SIC codes. However, the information generated from the Stats SA is useful given its mandate as statutory data source.
According to the Gross Domestic Product (GDP) from Stats SA for the 1st Quarter 2013 the main contributors to the increase in economic activity were the mining and quarrying industry and finance, real estate and business services (each contributing 0,7 of a percentage point). In terms of the economic data available for this major division, GDP for the sector increased from around R249 billion in 2002 to over R400 billion in 2012. This represents a weighted average annual growth rate of 5.53%. The Business Services Cluster industries accounted for 22.4% of South Africa’s GDP, positioning it as an important contributor to the South African economy with its contribution of R415 billion in 2012.
Figure 2: Finance, Real Estate and Business Services Sector GDP
Source: Stats SA Gross Domestic Product, 1st Quarter 2012 – 2nd Quarter 2013
In the second quarter of 2013, growth in Finance, Real Estate and Business Services was reportedly due to increased activities in equity, bond and other financial markets in auxiliary activities, and increased by 2,6% from quarter two of 2012.
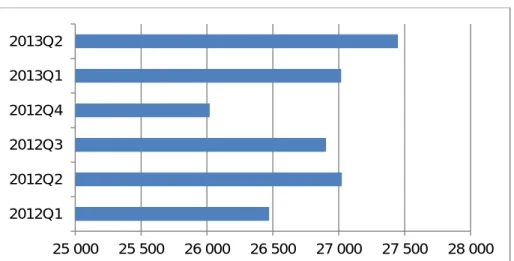
Figure 3: Personal Care Services GDP
25 000 25 500 26 000 26 500 27 000 27 500 28 000 2012Q1 2012Q2 2012Q3 2012Q4 2013Q1 2013Q2
Services SETA Sector Skills Plan 2014/2015 20
Source: Stats SA Gross Domestic Product, 1st Quarter 2013
The Personal Services major division at Stats SA covers the following Services SETA activities; activities of membership organisation N.E.C, washing and (dry)-cleaning, hairdressing and other beauty treatment, funeral and related activities and other services N.E.C. We see a steady growth in this sector from the first quarter of 2012 to the second quarter of 2013.
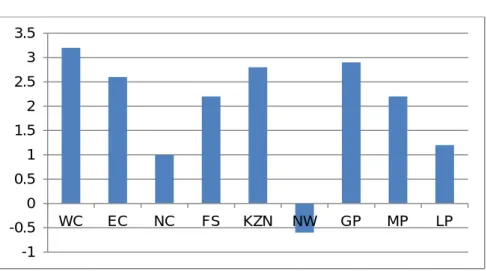
Figure 4: Sector contribution to GDP growth rate 2011 – 2013
Source: Stats SA Gross Domestic Product, 2nd Quarter 2013
Figure 4 represents the percentage change in GDP for the Finance, Real Estate and Business Services Sector and the Personal Services Sector, against the percentage change in GDP for the economy as a whole. Finance, Real Estate and Business Services were the largest industries at 18%. Personal service from the second quarter was measured at 11.3%. Growth in GDP for the sector outperformed the economy in several quarters between 2011 and 2013. It is necessary for the Services SETA to conduct economic research in the future to disaggregate and understand the contribution made by each of the Services SETA’s 16 sub-sectors in the economy.
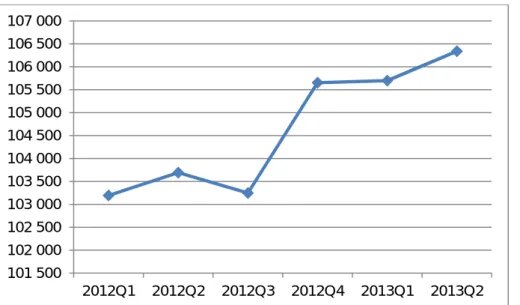
Levy Income 101 500 102 000 102 500 103 000 103 500 104 000 104 500 105 000 105 500 106 000 106 500 107 000 2012Q1 2012Q2 2012Q3 2012Q4 2013Q1 2013Q2
Services SETA Sector Skills Plan 2014/2015 21
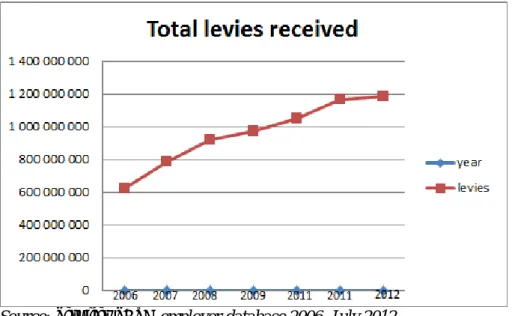
Levy income data indicates that the Services SETA experienced a steady growth in levy income between 2006 and 2012. Levy income serves as a good indication of the general increase in payroll from year to year across the various sub-sectors. Levy income is a reasonable proxy to gauge the level of earnings within the sector, and in this case also shows an increase in total employee earnings over the period under review.
Figure 5: Growth in SD Levy income over 6 years
Source: Services SETA employer database 2006- July 2012
The levy income for the 2012/13 financial year was R1 032 million, which is an increase of 6.19% compared to prior year. The increase in the levy income indicates growth in the services sector and annual salary inflationary increase, which led to higher Skills Development Levy (SDL) contributions by employers and hence a higher levy income for SETAs.
Figure 6: LPE vs. NLPE
Source: Services SETA employer database, July, 2013
The characterisation of the sector by small and micro sized enterprises (SMEs) implies that turnover is likely to be low and jobs not labour intensive. In terms of the levy payment figures available, 72.1%
Services SETA Sector Skills Plan 2014/2015 22
of the employers do not pay levies. Of the 27.9% of employers that are paying levies 44% pay less than R 5 000 and the remainder (56%) pay more than R5 000.
There are some sub-sectors which have shown a steady growth in the number of employers not paying levies and some sub-sectors fluctuated. The services sector has grown over the period 2005 to 2013 along with the SMEs across the sub-sectors. This is mirrored in the number of employers that are not paying levies, which has increased from 90 942 in 2005 to 112 117 in 2013.
In terms of LPEs, there was a decrease of 14 234 businesses within some sub-sectors between 2009 and 2013 due to the changes in the grant regulations exempting SME’s from paying levies. While there has been an overall decrease, some sub-sectors such as business services, hiring services and household services demonstrated consistent annual growth between 2006 and 2013. The increase in the Hiring and Cleaning Services can be attributed to wage increases, expansion of companies and easy entry into these sub-sectors. Companies, based on their core business activities, choose the SETA where they pay their skills levies to, based on their SIC code. Companies do not change their SETAs unless there is a fundamental change in their core business.
2.2WorkplaceSkillsPlan(WSP)
The Services SETA received 3 051 WSPs, out of 155 464 employers in the sector, in 2012 which was an increase of 222 from the previous year. The majority (75%) of these came from the Business Services sub-sector.
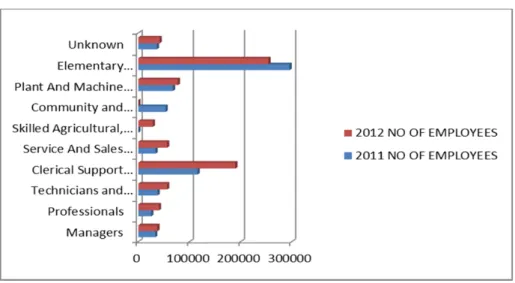
Figure 7: Number of Employees by Occupational Group based on WSPs
Source: Services SETA WSP 2011/12
Analysis of the WSPs for 2012 demonstrated that there were 781 837 employees employed by 3 051 employers. The highest number of employees was elementary workers who constituted 33%, clerical support workers 24% and machine operators and drivers 10% of the workforce respectively. Most notably there has been a decrease of 411 184 (9%) in elementary occupations.
These employees are spread across 1 080 occupations on the Organising Framework for Occupations (OFO). The OFO is a skills-based, coded classification system which built on the South African Standard Classification of Occupations (SASCO). It is used by the Department of Labour, SETAs and DHET for reporting on skills. Its purpose is to capture all jobs in the form of oc
![1,1′ (Butane 1,4 diyl)bis(1H benzimidazol 3 ium) bis[bis(pyridine 2,6 dicarboxylato κ3O,N,O′)ferrate(III)] methanol disolvate](data:image/gif;base64,R0lGODlhAQABAIAAAP///wAAACH5BAEAAAAALAAAAAABAAEAAAICRAEAOw==)