POWER
Nosayba El-Sayed is a PhDstudent in the Department of Computer Science at the University of Toronto, working under the supervision of Professor Bianca Schroeder. Her research focuses on improving the reliability and energy-efficiency of large-scale systems. Nosayba received her BS and MS in computer engineering from the University of Kuwait. [email protected]
Ioan Stefanovici is a PhD student in the Computer Systems and Networks Group at the University of Toronto under the supervision of Professor Bianca Schroeder. His research deals primarily with improving the reliability and performance of large-scale computer systems. He also has industry experience working at Microsoft, Google, and IBM Research. [email protected]
George Amvrosiadis is a PhD student in computer science at the University of Toronto. His research interests include storage reliability and idleness char-acterization, detection, and utilization. He completed his BS at the University of Ioannina in Greece, with a thesis on namespace man-agement of federated file systems.
Andy A. Hwang is a PhD student at the University of Toronto under the super-vision of Professor Bianca Schroeder. He received his BAS from the University of Waterloo and MS from the University of Toronto. Andy works on enhancing the reliability and performance of computer systems, both as a whole and for specific components such as DRAM. [email protected]
Bianca Schroeder is an assistant professor in the Department of Computer Science at the University of Toronto. Before coming to Toronto, Bianca completed her PhD and a two-year post-doc at Carnegie Mellon University. Her research focuses on computer systems, in particular the reliability of large-scale systems and the empirical analysis of computer systems. [email protected]
Datacenters have developed into major energy hogs, and more than a third of this energy is spent on cooling . While estimates suggest that increasing datacenter temperature by just one degree could reduce energy consumption by 2–5%, the effects of increased temperature on server components are not well understood . In this article, we present results from a large-scale field study, which demonstrate that there is ample potential for increasing datacenter temperatures without sacri-ficing system reliability or performance .
Datacenters currently account for nearly 3% of the world’s electricity consump-tion, and the annual cost for a single cooling system can be as high as $8 million . Not surprisingly, a large body of research has been devoted to reducing cooling cost . Interestingly, one key aspect in the thermal management of a datacenter is still not well understood: controlling the setpoint temperature at which to run a datacenter’s cooling system . While Google and Facebook have begun increasing temperatures in some of their datacenters, most organizations are typically more conservative, operating their datacenters in the 20°C to 22°C range, some as cold as 13°C degrees [2, 6] . Setting datacenter temperatures is more of a black art than a science, and many operators rely on anecdotal evidence or manufacturers’ (conser-vative) suggestions, as there are no field studies detailing the effects of tempera-ture on hardware components . In this article, we present results from our recent work [4] on the impact of temperature on component reliability and performance based on large-scale field data from multiple organizations and on experiments we conduct in a lab using a heat chamber . We also discuss several other concerns related to increased datacenter temperatures .
Temperature Management in Datacenters
Cranking Up the Thermostat Without Feeling the Heat
N O S A Y B A E L - S A Y E D , I O A N S T E F A N O V I C I , G E O R G E A M V R O S I A D I S , A N D Y A . H W A N G , A N D B I A N C A S C H R O E D E R
Temperature and Reliability
Our study of the effect of temperature on system reliability focuses on two specific hardware components, hard disk drives and DRAM, as these are among the most frequently replaced components in today’s datacenters . We also study the impact of temperature on the overall reliability of a node .
Errors in DRAM
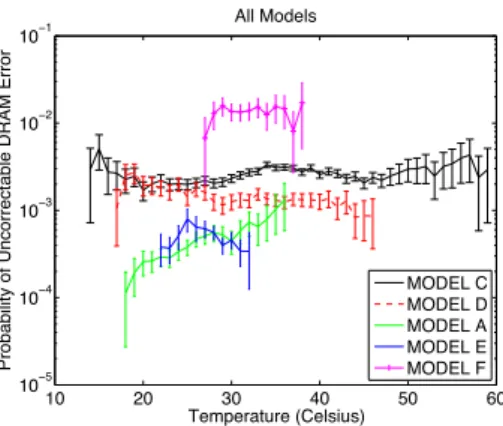
We study the effect of temperature on two different DRAM error modes: correct-able errors (CEs), where bits on a DRAM chip are flipped but can be corrected with error correcting codes (ECC), and uncorrectable errors (UEs), where the number of erroneous bits is too large for the ECC to correct, causing an application or machine crash . In many environments, UEs affect component lifetimes, as a single UE is often considered serious enough to replace the component .
Our largest data source comes from datacenters at Google, covering five different hardware platforms, and includes per DIMM counts of the occurrence of uncor-rectable errors, as well as periodic temperature measurements based on sensors on the motherboard . Figure 1 shows the monthly probability of an uncorrectable DRAM error per DIMM as a function of the average monthly temperature . Interestingly, we find that error rates are mostly flat with temperature, with the exception of one model (model A) . We find that when further breaking down the data for model A and looking at the trends for individual datacenters, error rates are flat with temperature except for one outlier datacenter that exhibited a slightly increasing trend .
We performed a similar analysis on data collected at Los Alamos National Lab (LANL) on node outages that were due to DRAM problems and on data collected at the SciNet Consortium (from the largest supercomputing cluster in Canada) on DIMM replacements . Again, we found no correlation between higher temperatures and increased DRAM failure rates .
We had also looked at the impact of temperature on correctable errors in an earlier study [7] based on Google data and, again, found no evidence of a correlation between temperature and correctable errors in DRAM .
Observation: We do not observe evidence for increasing rates of uncorrectable
DRAM errors, correctable DRAM errors, DRAM DIMM replacements, or node outages caused by DRAM problems as a function of temperature (within the range of temperatures our data comprises) .
Latent Sector Errors in Hard Disks
We concentrate our study of hard disk reliability on two common disk failure modes: latent sector errors (LSEs), where individual sectors on a disk become inaccessible, and complete disk failures . Both failure modes occur at a significant rate in the field, posing threats to data safety .
Our data on latent sector errors was collected from January 2007 to May 2009 from seven different datacenters at Google, covering three disk models and a total of 70,000 disks . For each disk, we have monthly reports of the average internal disk temperature (collected from SMART) and the temperature variance .
10 20 30 40 50 60 10−5 10−4 10−3 10−2 10−1 Temperature (Celsius)
Probability of Uncorrectable DRAM Error
All Models MODEL C MODEL D MODEL A MODEL E MODEL F
Figure 1: Probability of uncorrectable DRAM errors at Google as a function of temperature
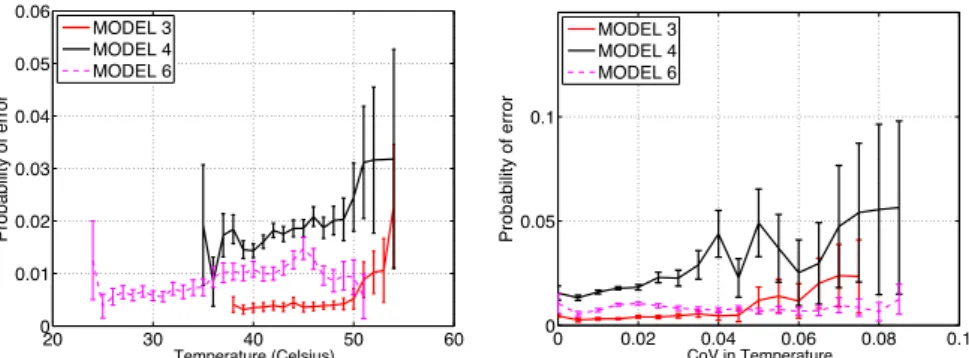
Figure 2 (left) shows the monthly probability of a disk developing an LSE as a function of temperature for each of the three disk models . We observe a trend of increasing LSE rates as temperature rises; however, an interesting observation is that the magnitude of increase is much smaller than expected based on com-mon models (e .g ., the Arrhenius model), which predict exponential growth of hardware failures with temperature . Using curve-fitting techniques, we found that a linear fit was comparable and in many cases even better than an exponen-tial fit to our data .
Observation: The prevalence of latent sector errors increases much more slowly
with temperature than reliability models suggest . Half of our model/datacenter pairs show no evidence of an increase, while for the others the increase is linear rather than exponential .
We also study the effect of variability in temperature on LSEs . Figure 2 (right) shows the monthly probability of LSEs as a function of coefficient of variation (CoV: the coefficient of variation is defined as the standard deviation divided by the mean) in temperature . When further breaking down the data by datacenter, we observe the following:
Observation: When further breaking down the data by datacenter, we find that the
variability in temperature tends to have a more pronounced and consistent effect on LSE rates than mere average temperature .
Hard Disk Replacements
We consider a hard disk failure as any kind of disk problem that is serious enough to replace the disk in question . We have obtained data on disk replacements and disk temperatures collected from January 2007 to May 2009 at 19 different data-centers at Google, covering five different disk models and 200,000 disks .
When analyzing the monthly probability that a disk will fail as a function of disk temperature, we observe that only three out of the five disk models show any increase in failure rates as temperature increases . Moreover, for these three mod-els, visual inspection as well as results from statistical curve-fitting indicate that the increase in failure rates tends to be linear rather than exponential .
Observation: Only some disk models experience increased failure rates with
tem-perature, and for those models the increase is weaker than what existing reliability models predict . 0 0.02 0.04 0.06 0.08 0.1 0 0.05 0.1 Probability of error CoV in Temperature MODEL 3 MODEL 4 MODEL 6 20 30 40 50 60 0 0.01 0.02 0.03 0.04 0.05 0.06 Probability of error Temperature (Celsius) MODEL 3 MODEL 4 MODEL 6
Figure 2: The monthly probability of LSEs by temperature (left) and by coefficient of variation (right)
Other Datacenter-Specific Factors
There are many datacenter-specific factors beyond temperature that might affect reliability (workload, humidity, handling procedures, etc .) . We make an interest-ing observation when separatinterest-ing the data on LSEs by datacenter: LSE rates for the same disk model can vary widely, by a factor of two, for disks in different data-centers . We considered differences in age or usage as possible reasons, but found that neither has a significant correlation with temperature .
Observation: There are other datacenter-specific factors that have a stronger effect
on disk reliability than temperature . These could, for example, include humidity, vibration, or handling procedures .
Node Outages
Rather than focusing on a particular hardware component, we also considered overall system reliability as a function of temperature . We study a data set cover-ing all node outages in 13 clusters (a total of 4384 nodes) at LANL recorded between 2001 and 2005, and event logs containing periodic temperature measure-ments provided by sensors on the motherboard .
The two graphs in Figure 3 show the monthly probability of a node outage for LANL system 20 as a function of the average temperature and the coefficient of variation (CoV) in temperature, respectively . The left graph compares the node outage probability of the coldest 50% of the nodes (left bar) with the node outage probability of the hottest 50% of the nodes (right bar) . The right graph compares the node outage probability for the top 50% of nodes with the highest CoV and the bottom 50% of nodes with lowest CoV .
Observation: We observe no evidence that hotter nodes have a higher rate of node
outages or node downtime (node downtime graph omitted for space) .
Observation: We find that high variability in temperature seems to have a stronger
effect on node reliability than average temperature .
We have expanded our analysis to node outages at 12 other clusters at LANL and hardware replacements at a cluster at SciNet and make similar observations . Full results are included in [4] .
Other Concerns with Increased Temperatures
While it is widely known that higher temperatures might negatively affect the reliability and lifetime of hardware devices, less attention is paid to other concerns with increased temperatures . The first is the fact that high temperatures can also
0 0.01 0.02 0.03 0.04 0.05
HW node outage − LANL system 20
Temperature (Celsius) Probability 22−30 30−41.1 0 0.02 0.04 0.06
HW node outage − LANL system 20
CoV in Temperature
Probability
0−0.0074 0.0074−0.04
negatively affect the performance of systems . Many server components employ a variety of mechanisms that will activate at high temperatures to protect them-selves against temperature-induced errors and failures . These mechanisms can introduce overheads, potentially affecting server performance . Other concerns include the effect of higher temperatures on a server’s power consumption and potential hot spots in a datacenter . We discuss each of these below .
Performance of Hard Disk Drives
We begin with a study of the effect of temperature on hard disk drives . It has been suggested that in order to protect themselves against a possibly increasing rate of LSEs, some hard disk models enable read-after-write (RAW) when a certain temperature threshold is reached . Under RAW, every write command sent to the disk is followed by a verify operation, which will read back the sector that has just been written and verify its contents . Unfortunately, features such as RAW are often considered trade secrets and their associated parameters (or even existence) are not well documented . In fact, even within a company manufacturing hardware these features are regarded as confidential and not shared outside product groups . As a result, we decided to investigate experimentally how the performance of different components changes with increasing temperatures using a testbed based on a heat chamber . We equip a Dell PowerEdge R710 server, a model that is commonly used in datacenter server racks, with a variety of hard disk drives, including SAS as well as SATA drives, covering all major manufacturers . We run a wide range of workloads, including synthetic benchmarks and a set of macro-benchmarks, while using the heat chamber to vary the ambient temperature within a range of 10°C to 55°C .
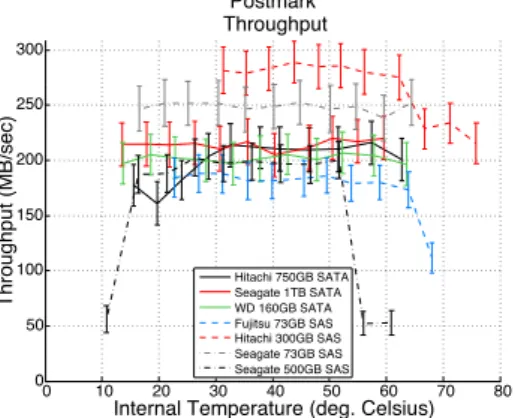
Figure 4 shows the throughput (in MBps) for one sample workload, the Postmark file system benchmark, as a function of the drive internal temperature as reported by the drive’s SMART statistics; the observations below, however, summarize our findings across all workloads (see paper [4] for all results) .
Observation: All SAS drives and one out of the three SATA drives experience some
drop in throughput for high temperatures . The drops are typically in the 5–20% range, sometimes as high as 40–80% for certain models running disk-intensive workloads .
Observation: Because for a particular drive model the throughput drop happens
consistently at the same temperature (between 50°C and 60°C disk-internal tem-perature, depending on the drive model), and none of the drives report any errors, we speculate that the drop in throughput is due to protective mechanisms enabled by the drive .
Observation: We also observe throughput drops for read-only workloads,
suggest-ing the presence of other non-publicized protection mechanisms besides RAW .
Observation: When translating the drive-specific internal temperatures into
ambi-ent temperatures (inside the heat chamber), we observe a drop in throughput for temperatures ranging from 40°C to 55°C, depending on the drive model . Although datacenters will rarely run at an average inlet temperature above 40°C, most data-centers have hot spots, which might routinely reach such temperatures .
0 10 20 30 40 50 60 70 80 0 50 100 150 200 250 300 Postmark Throughput
Internal Temperature (deg. Celsius)
Throughput (MB/sec) Hitachi 750GB SATASeagate 1TB SATA
WD 160GB SATA Fujitsu 73GB SAS Hitachi 300GB SAS Seagate 73GB SAS Seagate 500GB SAS
Figure 4: Throughput of an I/O-intensive workload (Postmark) as a function of disk internal temperature.
Performance of Other Server Components
Most enterprise-class servers include features to protect the CPU and memory subsystems from damage or excessive error rates due to high temperatures . These include scaling of the CPU frequency, reducing the speed of the memory bus (e .g ., from 1066 MHz to 800 MHz), and employing protection mechanisms for DRAM (e .g ., SEC-DED ECC, Chipkill ECC, memory mirroring) . During experiments where we placed the server in a heat chamber, we did not observe that our server model enabled any of these features automatically . When manually enabling vary-ing protective features, we find that they can introduce reductions in throughput by as much as 50% for microbenchmarks that stress the memory system, and 3–4% for macrobenchmarks modeling real-world applications .
Server Power Consumption
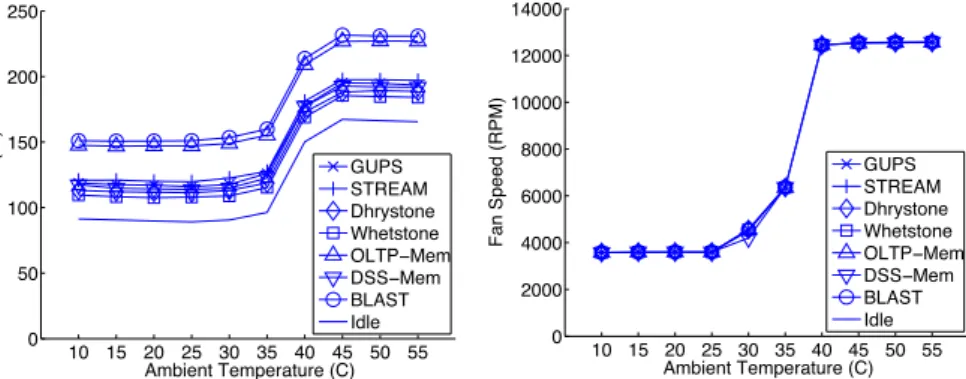
Increasing the air intake temperature of IT equipment can have an impact on the equipment’s power dissipation . Leakage power of a processor increases with higher temperatures . Additionally, most IT manufacturers start to increase the speed of internal cooling fans once inlet air temperatures reach a certain thresh-old, to offset the increased ambient air temperature . Together, these can make up a significant fraction of a server’s total power consumption . To study the effect of increasing ambient temperatures on a server’s power consumption, we attached a power meter to our server (results shown in Figure 5 [left]) and monitored fan speeds (see Figure 5 [right]) while placing the server in our heat chamber and running a variety of different workloads .
Observation: The server’s total power consumption increases dramatically (by
more than 50%) in ambient temperatures over 40°C .
Observation: Based on our measurements of server fan speeds during the
experi-ments and after consulting manufacturer’s specifications for the server’s fans, we can attribute the majority of the server’s additional power consumption to the increased fan speeds, rather than leakage power .
Observation: Interestingly, we find that the server fan speeds seemed to increase
solely as a function of ambient temperature, irrespective of the server’s internal temperature, suggesting the need for smarter fan controllers .
10 15 20 25 30 35 40 45 50 55 0 50 100 150 200 250 Ambient Temperature (C) Power (W) GUPS STREAM Dhrystone Whetstone OLTP−Mem DSS−Mem BLAST Idle 10 15 20 25 30 35 40 45 50 55 0 2000 4000 6000 8000 10000 12000 14000 Ambient Temperature (C) Fan Speed (RPM) GUPS STREAM Dhrystone Whetstone OLTP−Mem DSS−Mem BLAST Idle
Figure 5: The effect of ambient temperature on power consumption (left) and server fan speeds (right)
Reduced Safety Margins
One final concern with increasing datacenter temperatures are hot spots: portions of a datacenter that are significantly hotter than the average room temperature . The concern is that as the average temperature in a datacenter increases, the hot spots will approach critical temperature thresholds at which servers are configured to shut down in order to avoid equipment damage . This reduces the amount of time available to shut down a server cleanly, in case of an event such as AC or fan failure . We used data from seven datacenters at Google and a 256-node cluster at LANL to study variations in temperature between different servers in the same datacenter .
Observation: Interestingly, the trends for temperature imbalances are very similar
across datacenters and organizations . The node/disk in the 95th percentile is typically around 5°C hotter than the median node/disk, and the 99th percentile is around 8–10°C hotter than the median node/disk .
Lessons Learned
Based on our study of data spanning more than a dozen datacenters at three dif-ferent organizations, and covering a broad range of reliability issues, we find that the effect of high datacenter temperatures on system reliability is smaller than often assumed . For some of the reliability issues we study, namely DRAM fail-ures and node outages, we do not find any evidence for a correlation with higher temperatures (within the range of temperatures in our data sets) . For those error conditions that show a correlation (latent sector errors in disks and disk failures), the correlation is much weaker than expected . These observations imply that there is ample room for increasing datacenter temperatures without sacrificing system reliability .
Rather than average temperature, the variability in temperature might be the more important factor . Even failure conditions, such as node outages, that do not show a correlation with temperature, do show a clear correlation with the variability in temperature . Efforts in controlling such factors might be more important than low average temperature in keeping hardware failure rates low .
We find evidence that other datacenter-specific factors (such as humidity, vibra-tion, handling procedures) are likely to have a stronger, or at least an equally strong, effect as temperature . Although we do not have sufficient data for a detailed study of these factors, anecdotal evidence from discussions with datacenter operators suggests, for example, that poor handling procedures for equipment are major fac-tors in the field . Our observations demonstrate the need for more work in this area . Do our results mean that common models (e .g ., the Arrhenius model) that predict exponential growth in failure rates with temperature are wrong? We think no . Instead, it is likely that in practice (and for realistic temperatures) the effects of other factors dominate failure rates . The Arrhenius model solely tries to capture the effect of heat on hardware components without taking into account other pos-sible factors that impact hardware reliability in the field . Our results indicate that, when all real-world factors are considered, the effect of temperature on hardware reliability is actually weaker than commonly thought .
The error mode that was most strongly correlated with high temperatures is latent sector errors (LSEs) in hard disk drives . In experiments with our testbed based on a heat chamber, we observe that not all hard disks employ mechanisms, such
For those that do (mostly enterprise-class drives), we find that they tend to kick in only at very high temperatures and are associated with significant performance penalties . Operators concerned about LSEs might want to implement independent protection mechanisms under high temperatures, such as “scrubbing” their data at increased rates .
We find that higher temperatures can raise a server’s power consumption by more than 50%, and attribute the additional dissipation to increased fan speeds through our experiments . In many cases, this could likely be avoided by employing more sophisticated fan controller algorithms . This suggests that smarter fan controllers are needed to run datacenters hotter .
We find that in a typical datacenter, the top 5% of nodes are 5°C hotter than the median temperature, whereas the top 1% of nodes are 8–10°C hotter than the median . This is important to keep in mind when raising datacenter temperatures, as it will bring these hot spots even closer to critical thresholds when thermal shutdown becomes necessary . Operating at higher temperatures will therefore require mechanisms (including, for example, a detailed temperature monitoring infrastructure) to detect and react quickly to unforeseen events, such as AC or fan failures .
References
[1] C . Belady, A . Rawson, J . Pfleuger, and T . Cader, “The Green Grid Datacenter Power Efficiency Metrics: PUE & DCiE,” technical report, Green Grid, 2008 . [2] J . Brandon, “Going Green in the Datacenter: Practical Steps for Your SME to Become More Environmentally Friendly,” Processor, vol . 29, Sept . 2007 . [3] California Energy Commission, “Summertime Energy-Saving Tips for Businesses”: consumerenergycenter .org/tips/business_summer .html .
[4] N . El-Sayed, I .A . Stefanovici, G . Amvrosiadis, A .A . Hwang, and B . Schroeder, “Temperature Management in Datacenters: Why Some (Might) Like It Hot,” in Proceedings of the Fourteenth International Joint Conference on Measurement and
Modeling of Computer Systems (SIGMETRICS ‘12), ACM, 2012, pp . 163–174 .
[5] Lawrence Berkeley National Labs, Benchmarking—Datacenters: http:// hightech .lbl .gov/benchmarking-dc .html, December 2007 .
[6] Rich Miller, “Google: Raise Your Datacenter Temperature”: http://www .datacenterknowledge .com/archives/2008/10/14/google-raise-your-data-center -temperature/, 2008 .
[7] B . Schroeder, E . Pinheiro, and W .-D . Weber, “DRAM Errors in the Wild: A Large-Scale Field Study,” in Proceedings of the Eleventh International Joint
Confer-ence on Measurement and Modeling of Computer Systems (SIGMETRICS ’09),