Detection of multiple pathways in the spinal cord using q-ball imaging
J. Cohen-Adad,
a,c,⁎
M. Descoteaux,
b,eS. Rossignol,
cR.D. Hoge,
dR. Deriche,
band H. Benali
a aINSERM U678, Université Pierre et Marie Curie (Paris VI), CHU Pitié-Salpêtrière, Paris, FrancebOdyssée Project Team, INRIA/ENPC/ENS, INRIA Sophia Antipolis, France cGRSNC, Faculty of Medicine, Université de Montréal, Montreal, QC, Canada d
Unité de Neuroimagerie Fonctionnelle, CRIUGM, Université de Montréal, Canada e
CEA Neurospin, NMR Lab, Gif-sur-Yvette, France
Received 15 February 2008; revised 3 April 2008; accepted 14 April 2008 Available online 30 April 2008
Magnetic resonance diffusion tensor imaging (DTI) has been ex-tensively applied to the spinal cord for depicting its architecture and for assessing its integrity following spinal lesions. However, DTI is limited in representing complex white matter architecture, notably in the presence of crossing fibres. Recently, q-ball imaging (QBI) has been proposed as a new method for recovering complex white matter architecture. We applied this technique to bothex vivo andin vivo spinal cords of cats using a 3T scanner. For the purpose of comparison, gradients have been applied in 55 and 100 encoding directions and
b-values varied from 800 to 3000 s/mm2. As a result, QBI was able to retrieve crossing fibre information, where the DTI approach was constrained in a unique diffusion direction. To our knowledge, this is the first study demonstrating the benefits of QBI for detecting the presence of longitudinal, commissural and dorso-ventral fibres in the spinal cord. It is a first step towardsin vivocharacterization of the healthy and injured human spinal cord using high angular resolution diffusion imaging and QBI.
© 2008 Elsevier Inc. All rights reserved.
Keywords: Diffusion tensor imaging; High angular resolution diffusion imaging; Q-ball; Spinal cord; White matter
Introduction
Diffusion tensor imaging (DTI) is a method derived from magnetic resonance imaging (MRI) used for mapping white matter structure (Basser et al., 1994). It has been recently applied to the spinal cord and has demonstrated its benefits for assessing white matter integrity following injury (Agosta et al., 2007; Budde et al., 2007; Cohen-Adad et al., 2008; DeBoy et al., 2007; Deo et al., 2006; Ducreux et al., 2007; Fujiyoshi et al., 2007; Kim et al., 2007;
Lammertse et al., 2007; Nevo et al., 2001; Ohgiya et al., 2007; Plank et al., 2007; Ries et al., 2000; Schwartz et al., 2005; Shen et al., 2007; Thurnher and Bammer, 2006; Valsasina et al., 2005; Vargas et al., 2008). Also, it has been shown that DTI can retrieve major longitudinal pathways, i.e., axon bundles oriented in the rostro-caudal direction (Bilgen et al., 2005; Ciccarelli et al., 2007; Cohen-Adad et al., 2008; Ellingson et al., 2007; Fenyes and Narayana, 1999; Gullapalli et al., 2006; Maier, 2007; Wheeler-Kingshott et al., 2002). However, other types of fibres not oriented longitudinally are also present in some parts of the cord. These are for instance commissural fibres coursing in the medio-lateral di-rection, and dorso-ventral fibres that may originate from dorsal root afferents or terminal fibres of descending tracts. Since the diffusion tensor can only account for a single principal diffusion direction, these pathways might not be visible using DTI (Hagmann et al., 2006). Furthermore, after lesions or in the presence of tumours or cysts tracts can be displaced so that they are no longer following a longitudinal direction.
To overcome this issue, model-free approaches have been proposed to measure the microscopic diffusion without constrain-ing its representation. These methods are known as q-space imaging (Callaghan et al., 1988) or diffusion spectrum imaging (Wedeen et al., 2005) and have already demonstrated benefits for imaging the brain (Schmahmann et al., 2007) and the spinal cord (Assaf et al., 2000). However, long acquisition time is required for adequate sampling of q-space to retrieve the three-dimensional diffusion profile. To reduce acquisition times, a similar method has been proposed where sampling of q-space is restricted to a single sphere in many directions. This method is known as high angular resolution diffusion imaging (HARDI). A popular HARDI recon-struction method is q-ball imaging (QBI), which allows the retrieval of crossing fibres information with shorter acquisition time (Campbell et al., 2005; Tuch, 2004).
In the present study, we applied this technique in bothin vivoand ex vivo feline spinal cord. We show that QBI can recover longi-tudinal pathways as DTI does, but can also recover medio-lateral and ⁎Corresponding author. UNF, CRIUGM, 4565 Queen-Mary, Montreal,
QC, Canada H3W 1W5. Fax: +1 514 340 3530.
E-mail address:[email protected](J. Cohen-Adad). Available online on ScienceDirect (www.sciencedirect.com). 1053-8119/$ - see front matter © 2008 Elsevier Inc. All rights reserved. doi:10.1016/j.neuroimage.2008.04.243
dorso-ventral directions which are consistent with the known architecture of the spinal cord.
Material and methods
Ex vivo acquisition
The experiments were conducted in accordance with the Ethics Committee of the University of Montreal. One cat was sacrificed with an overdose of barbiturate (Somnotol). A laminectomy was performed at the lumbar level followed by the dissection of the dura matter. Dorsal and ventral roots were sectioned. The cord corresponding to lumbar segments 3 to 7 was extracted and put in saline solution (0.9%). Thirty minutes after extraction, the cord was placed into a gelatine solution (6%). It was imaged five hours later. We chose not to fix the cord because this chemical process induces a significant decrease of transverse relaxation time in the white matter (Carvlin et al., 1989; Pfefferbaum et al., 2004). Based on previous tests performed on fixed samples, we have concluded that constraints on our diffusion sequence parameters prevented us from reaching a echo time (TE) small enough to obtain sufficient signal in the white matter.
Datasets were acquired on a Siemens Trio system (3T) using an 8-channel spine array coil allowing parallel imaging. RF transmission was performed using the body coil integrated into the magnet bore. Anatomical scans were conducted using proton-density (PD)
weight-ing as these provide good contrast between white and grey matter. Parameters were: Turbo Spin-Echo sequence (turbo factor of 13), matrix = 320 × 320, voxel size = 0.25 × 0.25 × 3 mm3, TR = 3500 ms, TE = 11 ms, flip angle = 120 °. PD scans were used to generate regions of interest (ROIs—see section on Data processing).
Diffusion-weighted (DW) scans were acquired with a single-shot spin echo EPI pulse sequence. Parallel acquisition using GRAPPA (GeneRalized Autocalibrating Partially Parallel Acquisition) was used with an acceleration factor of 4 to limit the extent of susceptibility artifacts induced by the gelatine-air interface and by ferromagnetic micro-particles contained in the gelatine. To limit the effect of eddy-current distortions, the sequence included a twice refocusing pulse (Reese et al., 2003). Parameters were: matrix = 120 × 120, voxel size = 1 × 1 × 3 mm3, TR = 4000 ms, TE = 96 ms, flip angle = 90°, three repetitions, b-value = 0 and 1500 s/mm2, 100 directions using a polyhedron scheme (Madi et al., 2005). To evaluate the impact of different b-values, three additional datasets were acquired using a circularly polarised transmit–receive wrist coil to get higher signal-to-noise ratio (SNR). No parallel imaging was used for these scans. Parameters were: matrix = 128 × 128, voxel size = 0.65 × 0.65 × 3 mm3, TR = 4700 ms, TE = 152 ms, flip angle = 90 °, three repetitions, b-value = 1000, 2000 and 3000 s/mm2, 100 directions.
In vivo acquisition
One healthy cat was used for the in vivo study. It was anaesthetized in the scanner (isoflurane 2% through an endo-tracheal tube) and breathed freely. The cat was positioned feet-first-supine over an 8-channel phased-array coil, as done in ( Cohen-Adad et al., 2008). The centre was aligned on the fourth lumbar vertebral (L4) level. The cat was well propped up in the coil using bags to avoid any motion during the acquisition.
Anatomical PD-weighted scans were conducted with the follow-ing parameters: Turbo Spin-Echo sequence (turbo factor of 7), axial orientation, matrix = 512 × 512, voxel size = 0.35 × 0.35 × 3 mm3, 20 slices, TR = 2000 ms, TE = 14 ms, flip angle = 150°.
DW data were acquired using the same single-shot spin echo EPI sequence as for ex vivo acquisitions. Parameters were: matrix = 128 × 128, voxel size = 1.1 × 1.1 × 1.1 mm3, 15 slices, TR = 9500 ms, TE = 109 ms, flip angle = 90 °,b-value = 0 and 800 s/mm2. We per-formed two acquisitions to compare QBI at various sampling schemes. In the first acquisition, DW gradients have been applied in 28 directions (6b0repetitions, 4 repetitions, 22 min scan). In the second acquisition, DW gradients have been applied in 55 directions (3b0repetitions, 4 repetitions, 38 min scan). Although cardiac-gated Fig. 1. Axial slice (L5 spinal level) of theex vivoPD scan showing both
ROIs in the grey (a) and in the white matter (b). These ROIs are used for FA and GFA quantifications.
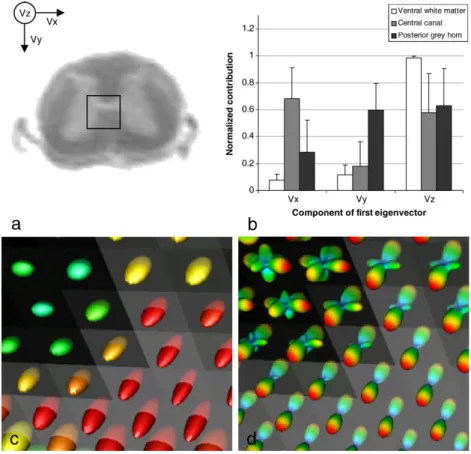
Fig. 2. a: Results of QBI in the spinal cord. ODFs were overlaid on an axial GFA map (top is dorsal, left is left). Zoomed panels show ODFs in the ventral white matter (b), in the central canal (c) and in the right grey matter posterior horn (d). ODF colour code goes from red to blue for maximal to minimal values on the sphere, respectively. Also, the radius of the ODF is proportional to its value on the sphere.
acquisition has been suggested for reducing ghosting artifacts (Summers et al., 2006), the relatively high cardiac frequency in cats (~ 2 Hz) compared to that in humans (~ 1 Hz), the irregularity of cardiac frequency due to the anaesthetic state, and the high TR and number of slices made it difficult to apply this technique within a reasonable scan time for anaesthetised animals.
Q-ball estimation
QBI, originally proposed in (Tuch, 2004), reconstructs the diffusion orientation distribution function (ODF) directly from the raw high angular resolution diffusion imaging (HARDI) measure-ments on a single sphere using the Funk–Radon transform (FRT). This FRT can be solved analytically, efficiently and robustly with the
spherical harmonic (SH) basis (Anderson, 2005; Descoteaux et al., 2007a; Hess et al., 2006). The key idea is to express the HARDI signal as a SH series of orderLand to solve the FRT using the Funk–Hecke theorem. The final ODF reconstruction,Ψ, in direction (θ,φ) is
Cðh;uÞ ¼XL k¼0
Xk m¼k
2kPkð Þ0cmkYkmðh;uÞ ð1Þ where Ykm denote SH of order k and degree m, ckm are the SH coefficients describing the input HARDI signal andPkis a Legendre polynomial of order k. Note that it is also possible to impose a Laplace–Beltrami regularization criterion while estimating the SH coefficientsckm, as done in (Descoteaux et al., 2006). Here, we used a regularization parameter of 0.006 and estimation orderL= 4 to get
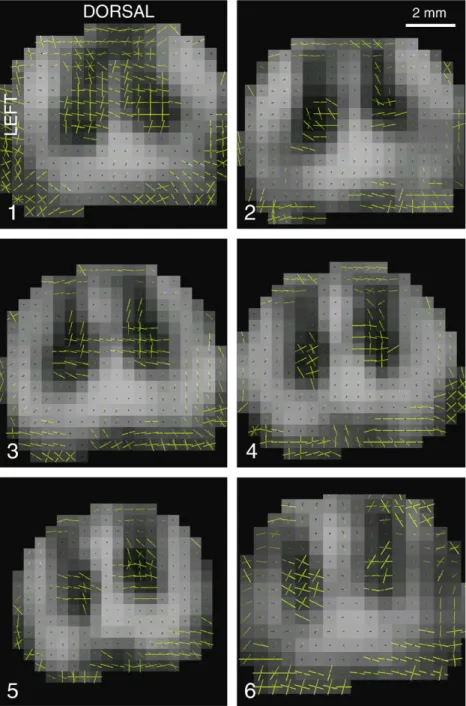
Fig. 3. Comparison of extracted maxima along the cord. Each axial slice is 3 mm thick, covering a rostro-caudal region 18 mm long, centred at L5. Slices are numbered from 1 to 6 (1 is the most rostral).
robust fibre detection (Descoteaux et al., 2006). From the reconstructed ODF, we computed the generalized fractional aniso-tropy (GFA) (Tuch, 2004), which is a HARDI anisotropy measure similar to the popular DTI fractional anisotropy (FA) (Pierpaoli and Basser, 1996). As an extension of the FA, the GFA is defined as the standard deviation divided by the root mean square of the ODF. Hence, it is also a measurement of the anisotropy but it is generalized throughout more than three eigenvalues. Thus we have
GFA¼ ffiffiffiffiffiffiffiffiffiffiffiffiffiffiffiffiffiffiffiffiffiffiffiffiffiffiffiffiffiffiffiffiffiffiffiffiffiffiffiffiffiffiffiffiffi nPni¼1ðCð Þ hui CiÞ2 n1 ð ÞPni¼1Cð Þui 2 s ¼ ffiffiffiffiffiffiffiffiffiffiffiffiffiffiffiffiffiffiffiffiffiffiffiffiffiffiffiffiffiffiffiffiffiffiffiffiffiffiffiffiffiffiffiffiffiffi 1 c 0 0 2 PL k¼0Pkm¼k cmk 2 v u u t ð2Þ Where hCi ¼ 1 n Xn i¼1Cð Þui ð3Þ
is the mean of the ODF. The diffusion ODF (dODF) is a blurred version of the“true”fibre ODF (fODF). Because of this blurring effect, the extracted maxima of the dODF are often used for fibre analysis. An alternative is to use spherical deconvolution methods that provide a direct estimate of the fODF. Several algorithms have recently appeared in the literature to estimate this fODF (Jian and Vemuri, 2007; Tournier et al., 2007). These techniques have better angular resolution than QBI and produce sharper fODF profiles than the q-ball dODF (Descoteaux et al., 2007b; Tournier et al., 2004). Thus, small fibre compartments with small volume fractions are sometimes visible with the fODF and not with the dODF. In the present study, the fODF was estimated using the method proposed in (Descoteaux, 2008; Descoteaux et al., 2007b). Please note that in this paper,“ODF”will always refer to the fibre ODF for clarity purpose.
Data processing
Images were first averaged to their diffusion directions and were two times interpolated. Series acquired without parallel imaging were corrected for susceptibility-induced distortions using the method described in (Ardekani and Sinha, 2005). Diffusion tensors (DTs) and ODFs were estimated with the Odyssée Toolbox publicly available with BrainVISA (http://brainvisa.info/), using methods proposed in (Descoteaux et al., 2007a, 2007b). Based on anatomical scans, a manual segmentation was performed to delineate white matter from grey matter over 10 axial slices for ex vivoandin vivoseries, as shown inFig. 1. For each series, two masks were then created. FA and GFA were computed respectively from DTs and ODFs, and were averaged within each created mask.
Results
Detection of multiple pathways
After processing the data and extracting ODF maxima, a major diffusion direction was almost exclusively detected in the white matter along the rostro-caudal axis. This result was expected since major ascending and descending fibres follow this orientation. As an example,Fig. 2b illustrates the diffusion properties in the ventral white matter. More interestingly, other directions were observed within the spinal cord grey matter, as described hereafter. A
medio-lateral direction was obtained in a region including the central canal and might correspond to commissural fibres (Fig. 2c). These axons, linking both sides of the spinal cord grey matter, notably originate from grey matter interneurons and cross to the opposite side through the anterior commissure. Note that this lateral direction has already been identified in previous studies through the use of the diffusion tensor (Mamata et al., 2006; Schwartz et al., 2005). A third direction dorso-ventrally oriented was observed and might correspond to fibres coursing from the dorsal to the ventral horn (Fig. 2d). These axons arise from the projection of dorsal roots (sensory afferents) at several spinal levels. Some of them project on motoneurons located in the ventral horn directly or through various synaptic pathways. There could also be terminal fibres of descending tracts that reach different spinal laminae within the grey matter.
To appreciate the evolution of reconstructed ODF across slices, extracted maxima are provided in Fig. 3. For each slice, we delineated white and grey matter and counted the number of detected peaks. We expected mostly one peak in the white matter region, and 2 to 3 peaks in the grey matter region, given the presence of collateral and dorso-ventral fibres. Results are provided in Fig. 4. As expected, a large majority of voxels in the white matter were subject to a unique diffusion direction, in a very consistent fashion across slices. In the grey matter however, we expected the number of peaks to vary across slices since sensory afferents project at specific rostro-caudal levels only. However, it was hard to relate the anatomical spinal level with the actual peak count for two reasons. First, projections of sensory afferents are spread throughout a certain rostro-caudal extent, thus making it
Fig. 4. Peaks count in the white (a) and grey matter (b) of extracted maxima in every slice showed in Fig. 3. Counting was based on a manual segmentation of the white and grey matter.
hard to assess the consistency of level-dependent dorso-ventral diffusion direction. Second, slice thickness was 3 mm, which certainly induced a non negligible partial volume effect of the detected diffusion directions.
Comparison between DTI and QBI
To evaluate the benefits of QBI over DTI, we compared both approaches by selecting a region including the three major directions that were observed previously,i.e., longitudinal, lateral and dorso-ventral. As expected, tensors yielded a very anisotropic profile in the white matter, pointing in the longitudinal direction (Fig. 5c bottom-right). Quantifications of the first eigenvector's components confirmed that observation (Vz inFig. 5b). Similarly, ODFs presented one unique direction (Fig. 5d bottom-right).
However, in the grey matter central canal the disk shape of tensors suggests two first eigenvalues of the same order (yellow ellipsoids inFig. 5c top-right). Quantification of the tensors' first eigenvector components indeed showed an increase of water diffusion in the lateral direction (Vx inFig. 5b). Using QBI, one can clearly distinguish these two major diffusion directions (Fig. 5d top-right).
When looking at a region more lateral than the central canal, tensors tend to become spherical, which indicates an apparent loss of FA with no clear principal diffusion direction. This region of the grey matter is known to be the site of intermingled fibres coursing in various directions. However, longitudinal and lateral pathways
are still present. It resulted in first eigenvectors having components in the three directions (Fig. 5b). This intravoxel heterogeneity was better described by ODFs which pointed in the longitudinal, lateral and antero-posterior directions (Fig. 5d top-left).
In vivo spinal cord
In vivodatasets were of high enough quality to delineate white and grey matter–in the case of PD images–and to apply the fibre ODF reconstruction method – in the case of EPI-based DW images. SNR was estimated as the mean signal in the cord divided by the standard deviation of the background noise (corrected for Rayleigh distribution). For PD images, SNR was 93.13ex vivoand 71.28in vivo. For EPI (b= 0) images, SNR was 116.15ex vivoand 83.01in vivo.
As inex vivodata, detection of multiple directions was possible from thein vivocat.Fig. 6shows q-ball ODFs estimated from the acquisition made at 55 directions. The coronal view clearly shows a principal direction along the rostro-caudal axis in the spinal cord white matter, and a lateral direction in the grey matter (Fig. 6b). When looking at axial views, ODF shapes look very similar to those observed in the ex vivo acquisition (Figs. 6c–f), although diffusion profiles are less sharp due to the lowerb-value. Medio-lateral as well as antero-posterior directions were observed, corresponding to commissural and sensory afferents, respectively. Note that we chose to illustrate regions centred at L5 since this is where the spinal cord is the largest (~ 10 mm lateral, ~ 7 mm
Fig. 5. Comparison between DTI and QBI. a: Axial anatomical MRI with a selected region including the white matter, the central canal and partially the dorsal and ventral horn. b: Components of diffusion tensors first eigenvector in three different regions of the cord. Overlay of DTs (c) and ODFs (d) for the selected region of interest over a GFA axial slice. DT colour code goes from red to green for maximum anisotropy to minimum anisotropy, respectively. QBI shows benefits over DTI for retrieving regions that are prone to crossing fibres.
antero-posterior), thus yielding a relatively clear delineation between white and grey matter at that spatial resolution.
For comparison purposes, we also provide FA and GFA quantifications for both ex vivo and in vivo datasets (Table 1). Although cats and acquisition parameters were different (b-value, number of gradient encoding directions, TR/TE, bandwidth, etc.), FA values in the white matter were significantly higher in thein vivo than that in theex vivosample (Pb0.005), which is consistent to
what was already reported in the rat spinal cord (Madi et al., 2005). More interestingly, if we use the empiric relationship linkingin vivo andex vivoFA, as observed by Madiet al.and defined as FAin vivo¼1:214FAex vivo ð4Þ thein vivoestimated values were in very close agreement to the actualin vivomeasurements for both the FA and GFA.
Fig. 6. Results of QBI from anin vivocat. a: Coronal view of the anatomical image showing lumbar levels L1 to L7. b: Coronal view of the GFA map centred at L5, with an overlay of ODFs. The central and vertical light-grey line corresponds to the white matter. Within that region ODFs show one principal diffusion direction oriented along the rostro-caudal axis. Both lateral vertical dark-grey paths correspond to the grey matter. Within that region ODFs show an additional diffusion direction oriented medio-laterally. c: Axial view of the GFA map centred at L5, with an overlay of ODFs. d: Zoomed panel from picture c showing the left grey matter. e: Axial view of the GFA map derived from theex vivoacquisition, with an overlay of ODFs. The axial slice is centred at L5 with the same orientation as previously (top-left is dorsal-left). f: Zoomed panel from theex vivoslice showing the left grey matter. Note that the scale is slightly different due to the in plane resolution which was 1.1 mm2in vivo, and 1 mm2ex vivo(both were two times interpolated).
Impact of b-value
The choice ofb-value is related to the attenuation of moving protons in each of the diffusion weighting directions. Small b -values produce high signal but low angular resolution. On the contrary, largeb-values provide better angular resolution but MRI signal recorded from moving protons is more attenuated, yielding lower signal. Theb-value should then be carefully set given the q-space sampling. In theex vivostudy, we did three acquisitions at 100 directions using b-values of 1000, 2000 and 3000 s/mm2. Results showed that with such a high sampling rate, lowb-values yield maxima in the dorso-ventral direction, which might be incorrect when observing the central canal region (Fig. 7b). Indeed, no fibres are known to course in the antero-posterior direction at that precise location. On the contrary, higher b-values tend to decrease the number of maxima in the area of commissural fibres (Fig. 7d). Note that inconsistent maxima could be due to noisy ODF reconstruction.
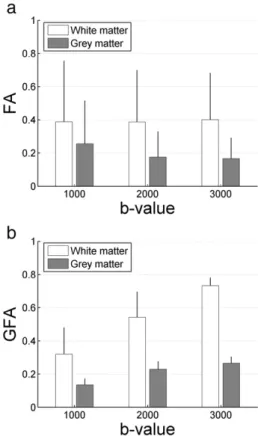
Quantifications of anisotropy at various b-values yielded interesting results (seeFig. 8). In the white matter, which is a highly anisotropic region having mostly a unique diffusion direction, FA did not significantly vary acrossb-values in the white matter. Only the standard deviation decreased whenb-value increased, indicating a better specificity of the measured anisotropy. However, GFA increased withb-value which confirmed previous observations,i.e., higher b-values tend to decrease the number of maxima, thus increasing the specificity as well. Similarly, quantifications in grey matter showed an increase of GFA withb-value. These results raise the question of how to report GFA measurement, since the latter strongly varies with the choice ofb-value, as investigated for the FA (Melhem et al., 2000).
Impact of diffusion direction sampling
To appreciate the impact of diffusion direction sampling on QBI, in vivodata were acquired at 28 and 55 directions using a polyhedron sampling scheme (Madi et al., 2005). Knowing that increasing the number of direction impacts the SNR, we compared both data at equivalent scan time, as done in (Jones, 2004; Landman et al., 2007; Ni et al., 2006). We used 4 repetitions for data acquired at 28 directions and 2 repetitions for data acquired at 55 directions. ODFs were estimated at orderL= 4 using the same regularization criterion (see section Q-ball estimation). ODFs for both datasets are shown in Fig. 9. On the coronal view, both sampling schemes yielded principal Table 1
Comparison of anisotropy measurements betweenex vivoandin vivodata (first two lines)
White matter Grey matter
FA GFA FA GFA
Ex vivo 0.33 ± 0.20 0.61 ± 0.35 0.14 ± 0.09 0.05 ± 0.08 In vivo 0.42 ± 0.14 0.75 ± 0.49 0.10 ± 0.04 0.07 ± 0.07 In vivo⁎ 0.40 ± 0.24 0.74 ± 0.42 0.17 ± 0.11 0.06 ± 0.10 Values are given as mean ± standard deviation within a tissue-dependent mask. The mask was centred at L5 for both datasets, and contained 24 axial slices corresponding to about 2 cm in the rostro-caudal direction. The third line of the array corresponds to the in vivo value estimated from the empirical relationship observed in (Madi et al., 2005).
Fig. 7. Impact ofb-value on ODF estimation. a: Axial anatomical MRI with a selected region centred on the central canal (top is dorsal). Comparison of ODF maxima forb-values of 1000 (b), 2000 (c) and 3000 s/mm2(d). Maxima are overlaid on a GFA map estimated from data at 3000 s/mm2. Maxima were extracted using a finite difference on the ODF mesh, considering values superior to 0.5.
Fig. 8. Fractional anisotropy (a) and generalized fractional anisotropy (b) quantification in the white and grey matter at variousb-values (given in s/ mm2). Bars and error-bars indicate the mean and standard deviation, respectively. Masks used for quantifying those metrics in the white and the grey matter were the same acrossb-values, enabling consistent comparison.
diffusion directions along the rostro-caudal axis in the white matter. However, medio-lateral directions were better depicted at 55 directions (Figs. 9c–d). Looking at axial views, the detection of medio-lateral as well as dorso-ventral directions was again better at 55 directions (Figs. 9g–j).
Discussion
Benefits of QBI for the spinal cord
As demonstrated in this study, QBI can retrieve crossing fibre information in the spinal cord, whereas the DTI approach is constrained by its single diffusion direction. Although the second eigenvector might be used to account for crossing fibres in the brain (Wiegell et al., 2000) and in the spinal cord (Mamata et al., 2006), there is a restriction imposed by the tensor itself. When the primary direction is defined by the principal eigenvector, the second eigenvector is limited in degrees of freedom since its direction is necessarily on the plane orthogonal to the longitudinal fibres. In the presence of non orthogonal fibres, the usual way of decomposing the tensor becomes less efficient (Alexander et al., 2001). Moreover, when a voxel contains more than one diffusion direction, one cannot rely on the first eigenvector's orientation anymore since the latter results from a linear combination of major diffusion directions. Knowing that spinal cord architecture is not only oriented rostro-caudal and that today's MRI acquisition provides a spatial resolution on the order of the millimetre, HARDI reconstruction schemes such as QBI aim at representing this subtle intravoxel heterogeneity.
Validation
A few words should however be said about the validation of this technique. There have been attempts to validate QBI in non-biological phantom preparations (Perrin et al., 2005). However, in biological tissue the validation step is complex as it involves tract tracing (Lin et al., 2003; Schmahmann et al., 2007). The focus of the present study was to propose a methodology to acquireex vivo andin vivoHARDI data in the spinal cord, and to estimate ODFs with robust algorithms. We showed that some extracted maxima were very consistent with the known anatomy of the spinal cord. In future study, the validation aspect will be investigated more deeply. Impact of voxel shape
In vivo acquisitions were performed using isotropic voxel of 1.1 mm3. As mentioned in (Cohen-Adad et al., 2008), this was done to limit any bias in the determination of major diffusion directions. However,ex vivoacquisitions were performed using a ratio between in plane resolution and slice thickness of 1:3 and 1:4.6. This heterogeneity had certainly induced a relative increase of the diffusion-weighted SNR in the Z direction, which was aligned with the longitudinal direction of the cord. Such a choice of voxel shape resulted from a compromise between the axial resolution and the SNR which had to be high enough to yield consistent ODF reconstruction. Since the present study aimed at depicting the axial heterogeneity in terms of diffusion directions, we chose to image at
Fig. 9. Impact of diffusion direction sampling. ODFs were computed fromin vivodata acquired at 55 (left column) and 28 (right column) directions. Both columns show GFA maps computed from the 55 directions dataset (the purpose here is to compare ODFs and not GFA measurements). a,b: Coronal slice centred at L5, half cutting the spinal cord. c,d: zoomed window centred on the central canal. e,f: axial slice (top is dorsal). g,h: zoomed window centred on the grey matter left ventral horn. i,j: zoomed window centred on the dorsal right region, where afferent dorsal roots project into the spinal cord grey matter.
very high in plane resolution (up to 650 × 650μm2) thus imposing an anisotropic voxel shape. We are conscious that the ODF reconstruc-tion was biased in terms of absolute direcreconstruc-tionality (i.e., longitudinal versus transverse diffusion profile), however in plane components of the ODF were still informative for detecting collaterals and dorso-ventral pathways. Moreover, ODF profiles derived fromex vivoand in vivodatasets looked very similar and showed consistent collaterals in all cases,i.e., ratio between in plane resolution and slice thickness of 1:1, 1:3 and 1:4.6. In the future, we however recommend the use of an isotropic voxel shape when the aim is to explore the anatomical structure of the white matter without bias.
Strategy for optimal b-value and q-space sampling
Looking at the comparison of three differentb-values, results showed more extracted maxima for lowerb-values. However, some maxima were not consistent with the known architecture of the spinal cord's axonal pathways. Although partial volume effect might explain the presence of false positives, another argument should be con-sidered. As supported by (Ronen et al., 2005), the results presented here suggest that lowb-values increase the sensitivity for retrieving diffusion directions but reduce their specificity.
Regarding the optimal number of directions to apply for q-space sampling, results obtained in thein vivostudy suggest a real benefit of data acquired in 55 directions versus 28 directions. In DTI, there is an ongoing debate whether increasing the number of directions over a certain threshold yields significant benefits for modelling diffusion (Hosey et al., 2005; Jones, 2004; Lee et al., 2006; Ni et al., 2006). In the case of model-free approaches, HARDI data are of clear interest, since a much higher number of degrees of freedom is permitted for estimating the ODF (Perrin et al., 2005; Poupon et al., 2007). However the trade-off is the acquisition duration. Further studies are required for optimizing these sensitive parameters.
Local HARDI reconstruction
The study of local HARDI reconstruction methods is currently an active field of research (Alexander, 2005; Descoteaux, 2008). We have shown the benefits of QBI and the usefulness of the diffusion ODF (dODF) and fibre ODF (fODF) reconstruction. It is important to note that there are other techniques using spherical deconvolution and multiple fibre models that also aim at reconstructing the fODF (Descoteaux, 2008; Jian and Vemuri, 2007). More complicated methods are available that aim at reducing the numerical instabilities and errors that are known to occur in the spherical deconvolution process. Each of these techniques have different underlying assump-tions but seem to produce very similar fODF profiles (Descoteaux, 2008). More involved comparisons are needed to decide what reconstruction is more appropriate for what application.
Perspectives
The present study has been performed in cats. Although subject positioning, coil arrangement and also motion patterns might be somehow different, HARDI acquisition are theoretically feasible in the spinal cord of other mammals, including humans. Moreover, the proof of concept showing that the QBI method is able to depict non-longitudinal fibres naturally applies to other mammals. Also note that the use of a higher magnetic field could improve greatly the sensitivity of detecting collateral fibres, as demonstrated in the human brain (Mukherjee et al., 2008).
From a neurophysiological perspective, the next step is to evaluate the method in cats with spinal cord injury, using the added value of tractography. It will aim at understanding white matter reorganization after lesion and possibly after various treatments or training methods have been applied to regain locomotion ( Ros-signol, 2006). Indeed, there may be regeneration of damaged axons or collateral sprouting of axons in spared descending/ascending pathways or primary afferents (Kerschensteiner, 2007). These new growths can project through different spinal paths as they are forming new circuits and adopt unpredicted trajectories as they by-pass the scar tissue (Bareyre et al., 2004; Fouad and Pearson, 2004). Such subtle reorganisation, involving a limited number of axons, might be invisible to the principal eigenvectors usually represented in DTI. The present study thus provides an incentive to use both HARDI and QBI to represent the diffusion process in the healthy and injured spinal cord.
Acknowledgments
We thank H. Leblond, G. Barrière and J. Provencher for the cat preparation, J. Doyon for providing support from the UNF, C. Hurst for assistance with MRI acquisitions, and C. Gauthier for her revision of the manuscript. We also thank the reviewers for their precious comments. This work was supported by the Canada Research Chair on the Spinal Cord provided by the Canadian Institute of Health Research (CIHR) to S. Rossignol and by the Multisdisciplinary Team on Locomotor Rehabilitation (Regenera-tive Medicine and Nanomedicine, CIHR) and by the INRIA ARC Diffusion MRI research program. J. Cohen-Adad has a fellowship from the Fondation pour la Recherche Médicale (FRM, France) and from the Groupe de Recherche sur le Système Nerveux Central (GRSNC, Université de Montréal).
References
Agosta, F., Absinta, M., Sormani, M.P., Ghezzi, A., Bertolotto, A., Montanari, E., Comi, G., Filippi, M., 2007. In vivo assessment of cervical cord damage in MS patients: a longitudinal diffusion tensor MRI study. Brain 130, 2211–2219.
Alexander, D.C., 2005. Multiple-fiber reconstruction algorithms for diffusion MRI. Ann. N. Y. Acad. Sci. 1064, 113–133.
Alexander, A.L., Hasan, K.M., Lazar, M., Tsuruda, J.S., Parker, D.L., 2001. Analysis of partial volume effects in diffusion-tensor MRI. Magn. Reson. Med. 45, 770–780.
Anderson, A.W., 2005. Measurement of fiber orientation distributions using high angular resolution diffusion imaging. Magn. Reson. Med. 54, 1194–1206.
Ardekani, S., Sinha, U., 2005. Geometric distortion correction of high-resolution 3 T diffusion tensor brain images. Magn. Reson. Med. 54, 1163–1171.
Assaf, Y., Mayk, A., Cohen, Y., 2000. Displacement imaging of spinal cord using q-space diffusion-weighted MRI. Magn. Reson. Med. 44, 713–722. Bareyre, F.M., Kerschensteiner, M., Raineteau, O., Mettenleiter, T.C., Wein-mann, O., Schwab, M.E., 2004. The injured spinal cord spontaneously forms a new intraspinal circuit in adult rats. Nat. Neurosci. 7, 269–277. Basser, P.J., Mattiello, J., LeBihan, D., 1994. Estimation of the effective
self-diffusion tensor from the NMR spin echo. J. Magn. Reson. 103, 247–254. Bilgen, M., Al-Hafez, B., Berman, N.E., Festoff, B.W., 2005. Magnetic resonance imaging of mouse spinal cord. Magn. Reson. Med. 54, 1226–1231.
Budde, M.D., Kim, J.H., Liang, H.F., Schmidt, R.E., Russell, J.H., Cross, A.H., Song, S.K., 2007. Toward accurate diagnosis of white matter pathology using diffusion tensor imaging. Magn. Reson. Med. 57, 688–695.
Callaghan, P.T., Eccles, C.D., Xia, Y., 1988. NMR microscopy of dynamic displacements: k-space and q-space imaging. J. Phys. E. Sci. Instrum. 21, 820–822.
Campbell, J.S., Siddiqi, K., Rymar, V.V., Sadikot, A.F., Pike, G.B., 2005. Flow-based fiber tracking with diffusion tensor and q-ball data: validation and comparison to principal diffusion direction techniques. Neuroimage 27, 725–736.
Carvlin, M.J., Asato, R., Hackney, D.B., Kassab, E., Joseph, P.M., 1989. High-resolution MR of the spinal cord in humans and rats. AJNR Am. J. Neuroradiol. 10, 13–17.
Ciccarelli, O., Wheeler-Kingshott, C.A., McLean, M.A., Cercignani, M., Wimpey, K., Miller, D.H., Thompson, A.J., 2007. Spinal cord spectro-scopy and diffusion-based tractography to assess acute disability in multiple sclerosis. Brain 130, 2220–2231.
Cohen-Adad, J., Benali, H., Hoge, R.D., Rossignol, S., 2008. In vivo DTI of the healthy and injured cat spinal cord at high spatial and angular resolution. Neuroimage 40, 685–697.
DeBoy, C.A., Zhang, J., Dike, S., Shats, I., Jones, M., Reich, D.S., Mori, S., Nguyen, T., Rothstein, B., Miller, R.H., Griffin, J.T., Kerr, D.A., Calabresi, P.A., 2007. High resolution diffusion tensor imaging of axonal damage in focal inflammatory and demyelinating lesions in rat spinal cord. Brain 130, 2199–2210.
Deo, A.A., Grill, R.J., Hasan, K.M., Narayana, P.A., 2006. In vivo serial diffusion tensor imaging of experimental spinal cord injury. J. Neurosci. Res. 83, 801–810.
Descoteaux, M., 2008. High Angular Resolution Diffusion MRI: from Local Estimation to Segmentation and Tractography. PhD Thesis, University Nice-Sophia Antipolis.
Descoteaux, M., Angelino, E., Fitzgibbons, S., Deriche, R., 2006. Apparent diffusion coefficients from high angular resolution diffusion imaging: estimation and applications. Magn. Reson. Med. 56, 395–410. Descoteaux, M., Angelino, E., Fitzgibbons, S., Deriche, R., 2007a.
Regularized, fast, and robust analytical q-ball imaging. Magn. Reson. Med. 58, 497–510.
Descoteaux, M., Deriche, R., Anwander, A., 2007b. Deterministic and Probabilistic Q-Ball Tractography: from Diffusion to Sharp Fiber Distributions. INRIA. Research Report 6273.
Ducreux, D., Fillard, P., Facon, D., Ozanne, A., Lepeintre, J.F., Renoux, J., Tadie, M., Lasjaunias, P., 2007. Diffusion tensor magnetic resonance imaging and fiber tracking in spinal cord lesions: current and future indications. Neuroimaging. Clin. N. Am. 17, 137–147.
Ellingson, B.M., Ulmer, J.L., Schmit, B.D., 2007. Optimal diffusion tensor indices for imaging the human spinal cord. Biomed. Sci. Instrum. 43, 128–133.
Fenyes, D.A., Narayana, P.A., 1999. In vivo diffusion characteristics of rat spinal cord. Magn. Reson. Imaging 17, 717–722.
Fouad, K., Pearson, K., 2004. Restoring walking after spinal cord injury. Prog. Neurobiol. 73, 107–126.
Fujiyoshi, K., Yamada, M., Nakamura, M., Yamane, J., Katoh, H., Kitamura, K., Kawai, K., Okada, S., Momoshima, S., Toyama, Y., Okano, H., 2007. In vivo tracing of neural tracts in the intact and injured spinal cord of marmosets by diffusion tensor tractography. J. Neurosci. 27, 11991–11998. Gullapalli, J., Krejza, J., Schwartz, E.D., 2006. In vivo DTI evaluation of white
matter tracts in rat spinal cord. J. Magn. Reson. Imaging 24, 231–234. Hagmann, P., Jonasson, L., Maeder, P., Thiran, J.P., Wedeen, V.J., Meuli, R.,
2006. Understanding diffusion MR imaging techniques: from scalar diffusion-weighted imaging to diffusion tensor imaging and beyond. Radiographics 26 (Suppl 1), S205–S223.
Hess, C.P., Mukherjee, P., Han, E.T., Xu, D., Vigneron, D.B., 2006. Q-ball reconstruction of multimodal fiber orientations using the spherical harmonic basis. Magn. Reson. Med. 56, 104–117.
Hosey, T., Williams, G., Ansorge, R., 2005. Inference of multiple fiber orientations in high angular resolution diffusion imaging. Magn. Reson. Med. 54, 1480–1489.
Jian, B., Vemuri, B.C., 2007. A unified computational framework for deconvolution to reconstruct multiple fibers from diffusion weighted MRI. IEEE Trans. Med. Imaging. 26, 1464–1471.
Jones, D.K., 2004. The effect of gradient sampling schemes on measures derived from diffusion tensor MRI: a Monte Carlo study. Magn. Reson. Med. 51, 807–815.
Kerschensteiner, M., 2007. Strategies for axonal repair in central nervous system diseases. J. Neurol. 254 (Suppl 1), I29–I32.
Kim, J.H., Loy, D.N., Liang, H.F., Trinkaus, K., Schmidt, R.E., Song, S.K., 2007. Noninvasive diffusion tensor imaging of evolving white matter pathology in a mouse model of acute spinal cord injury. Magn. Reson. Med. 58, 253–260.
Lammertse, D., Dungan, D., Dreisbach, J., Falci, S., Flanders, A., Marino, R., Schwartz, E., 2007. Neuroimaging in traumatic spinal cord injury: an evidence-based review for clinical practice and research. J. Spinal Cord Med. 30, 205–214.
Landman, B.A., Farrell, J.A., Jones, C.K., Smith, S.A., Prince, J.L., Mori, S., 2007. Effects of diffusion weighting schemes on the reproducibility of DTI-derived fractional anisotropy, mean diffusivity, and principal eigenvector measurements at 1.5T. Neuroimage 36, 1123–1138. Lee, J.W., Kim, J.H., Kang, H.S., Lee, J.S., Choi, J.Y., Yeom, J.S., Kim, H.J.,
Chung, H.W., 2006. Optimization of acquisition parameters of diffusion-tensor magnetic resonance imaging in the spinal cord. Invest. Radiol. 41, 553–559.
Lin, C.P., Wedeen, V.J., Chen, J.H., Yao, C., Tseng, W.Y., 2003. Validation of diffusion spectrum magnetic resonance imaging with manganese-enhanced rat optic tracts and ex vivo phantoms. Neuroimage 19, 482–495. Madi, S., Hasan, K.M., Narayana, P.A., 2005. Diffusion tensor imaging of in vivo and excised rat spinal cord at 7 T with an icosahedral encoding scheme. Magn. Reson. Med. 53, 118–125.
Maier, S.E., 2007. Examination of spinal cord tissue architecture with magnetic resonance diffusion tensor imaging. Neurotherapeutics 4, 453–459.
Mamata, H., De Girolami, U., Hoge, W.S., Jolesz, F.A., Maier, S.E., 2006. Collateral nerve fibers in human spinal cord: visualization with magnetic resonance diffusion tensor imaging. Neuroimage 31, 24–30.
Melhem, E.R., Itoh, R., Jones, L., Barker, P.B., 2000. Diffusion tensor MR imaging of the brain: effect of diffusion weighting on trace and anisotropy measurements. AJNR Am. J. Neuroradiol. 21, 1813–1820. Mukherjee, P., Hess, C.P., Xu, D., Han, E.T., Kelley, D.A., Vigneron, D.B.,
2008. Development and initial evaluation of 7-T q-ball imaging of the human brain. Magn. Reson. Imaging 26, 171–180.
Nevo, U., Hauben, E., Yoles, E., Agranov, E., Akselrod, S., Schwartz, M., Neeman, M., 2001. Diffusion anisotropy MRI for quantitative assess-ment of recovery in injured rat spinal cord. Magn. Reson. Med. 45, 1–9. Ni, H., Kavcic, V., Zhu, T., Ekholm, S., Zhong, J., 2006. Effects of number of diffusion gradient directions on derived diffusion tensor imaging indices in human brain. AJNR Am. J. Neuroradiol. 27, 1776–1781. Ohgiya, Y., Oka, M., Hiwatashi, A., Liu, X., Kakimoto, N., Westesson, P.L.,
Ekholm, S.E., 2007. Diffusion tensor MR imaging of the cervical spinal cord in patients with multiple sclerosis. Eur. Radiol. 17, 2499–2504. Perrin, M., Poupon, C., Rieul, B., Leroux, P., Constantinesco, A., Mangin, J.F.,
Lebihan, D., 2005. Validation of q-ball imaging with a diffusion fibre-crossing phantom on a clinical scanner. Philos. Trans. R. Soc. Lond. B. Biol. Sci. 360, 881–891.
Pfefferbaum, A., Sullivan, E.V., Adalsteinsson, E., Garrick, T., Harper, C., 2004. Postmortem MR imaging of formalin-fixed human brain. Neuroimage 21, 1585–1595.
Pierpaoli, C., Basser, P.J., 1996. Toward a quantitative assessment of diffusion anisotropy. Magn. Reson. Med. 36, 893–906.
Plank, C., Koller, A., Mueller-Mang, C., Bammer, R., Thurnher, M.M., 2007. Diffusion-weighted MR imaging (DWI) in the evaluation of epidural spinal lesions. Neuroradiology 49, 977–985.
Poupon, C., Poupon, F., Roche, A., Cointepas, Y., Dubois, J., Mangin, J.F., 2007. Real-time MR diffusion tensor and Q-ball imaging using Kalman filtering. Med Image Comput Comput Assist Interv Int Conf Med. Image Comput. Comput. Assist. Interv. 10, 27–35.
Reese, T.G., Heid, O., Weisskoff, R.M., Wedeen, V.J., 2003. Reduction of eddy-current-induced distortion in diffusion MRI using a twice-refocused spin echo. Magn. Reson. Med. 49, 177–182.
Ries, M., Jones, R.A., Dousset, V., Moonen, C.T., 2000. Diffusion tensor MRI of the spinal cord. Magn. Reson. Med. 44, 884–892.
Ronen, I., Ugurbil, K., Kim, D.S., 2005. How does DWI correlate with white matter structures? Magn. Reson. Med. 54, 317–323.
Rossignol, S., 2006. Plasticity of connections underlying locomotor recovery after central and/or peripheral lesions in the adult mammals. Philos. Trans. R. Soc. Lond. B. Biol. Sci. 361, 1647–1671.
Schmahmann, J.D., Pandya, D.N., Wang, R., Dai, G., D'Arceuil, H.E., de Crespigny, A.J., Wedeen, V.J., 2007. Association fibre pathways of the brain: parallel observations from diffusion spectrum imaging and autoradiography. Brain 130, 630–653.
Schwartz, E.D., Duda, J., Shumsky, J.S., Cooper, E.T., Gee, J., 2005. Spinal cord diffusion tensor imaging and fiber tracking can identify white matter tract disruption and glial scar orientation following lateral funiculotomy. J. Neurotrauma. 22, 1388–1398.
Shen, H., Tang, Y., Huang, L., Yang, R., Wu, Y., Wang, P., Shi, Y., He, X., Liu, H., Ye, J., 2007. Applications of diffusion-weighted MRI in thoracic spinal cord injury without radiographic abnormality. Int. Orthop. 31, 375–383.
Summers, P., Staempfli, P., Jaermann, T., Kwiecinski, S., Kollias, S., 2006. A preliminary study of the effects of trigger timing on diffusion tensor imaging of the human spinal cord. AJNR. Am. J. Neuroradiol. 27, 1952–1961. Thurnher, M.M., Bammer, R., 2006. Diffusion-weighted magnetic
reso-nance imaging of the spine and spinal cord. Semin. Roentgenol. 41, 294–311.
Tournier, J.D., Calamante, F., Gadian, D.G., Connelly, A., 2004. Direct estimation of the fiber orientation density function from diffusion-weighted MRI data using spherical deconvolution. Neuroimage 23, 1176–1185.
Tournier, J.D., Calamante, F., Connelly, A., 2007. Robust determination of the fibre orientation distribution in diffusion MRI: non-negativity constrained super-resolved spherical deconvolution. Neuroimage 35, 1459–1472.
Tuch, D.S., 2004. Q-ball imaging. Magn. Reson. Med. 52, 1358–1372. Valsasina, P., Rocca, M.A., Agosta, F., Benedetti, B., Horsfield, M.A., Gallo,
A., Rovaris, M., Comi, G., Filippi, M., 2005. Mean diffusivity and fractional anisotropy histogram analysis of the cervical cord in MS patients. Neuroimage 26, 822–828.
Vargas, M.I., Delavelle, J., Jlassi, H., Rilliet, B., Viallon, M., Becker, C.D., Lovblad, K.O., 2008. Clinical applications of diffusion tensor tractography of the spinal cord. Neuroradiology 50, 25–29.
Wedeen, V.J., Hagmann, P., Tseng, W.Y., Reese, T.G., Weisskoff, R.M., 2005. Mapping complex tissue architecture with diffusion spectrum magnetic resonance imaging. Magn. Reson. Med. 54, 1377–1386. Wheeler-Kingshott, C.A., Hickman, S.J., Parker, G.J., Ciccarelli, O., Symms,
M.R., Miller, D.H., Barker, G.J., 2002. Investigating cervical spinal cord structure using axial diffusion tensor imaging. Neuroimage 16, 93–102. Wiegell, M.R., Larsson, H.B., Wedeen, V.J., 2000. Fiber crossing in human brain depicted with diffusion tensor MR imaging. Radiology 217, 897–903.