Housing Wealth and Consumption
By Nuala O’Donnell
1ABSTRACT
In the light of sustained increases in house prices in Ireland, this paper reviews international and Irish evidence on the relationship between housing wealth and consumption. The channels through which such an effect might operate are described. The mortgage market and financial market features that are held to lead a positive relationship are outlined and the Irish position on these assessed. Particular attention is paid to the role of housing equity withdrawal (HEW). Consumption functions for Ireland are estimated incorporating measures of housing wealth and stock market wealth. No evidence of a housing wealth effect is found. However, the relationship may be asymmetric so that it can not be concluded that decreases in housing wealth, for example, caused by declines in house prices, would not have a negative impact on consumption.
1.
Introduction
One aspect of the Irish house price boom which has received relatively little attention is the impact that the resulting increase in housing wealth may have had on household consumption. While there is a substantial literature on this relationship internationally, there are only a few contributions which study the Irish case in depth (Hogan and O’Sullivan, 2003, Kenny, 1998). However, Ireland has been included in several studies of panels of international economies such as those of Case, Quigley and Shiller (2005) and Ludwig and Slok (2004). Many of these panel studies focus on the relative magnitude of the effects of both housing wealth and stock market wealth on consumption. Housing wealth in Ireland increased sharply from 1996 onwards. In the light of international findings on the Marginal Propensity to Consume (MPC) out of housing wealth, it is important to consider the broader ramifications of housing wealth increases. In line with the international literature, this paper also considers the effect of stock market wealth on consumption.
This paper is organised as follows. Section 2 describes the recent evolution of housing wealth in Ireland, and also of consumption. Section 3 describes international and Irish evidence on the relationship between housing wealth and consumption. Section 4 presents the estimation of consumption functions using Irish data. Section 5 reviews the importance of the institutional features of mortgage markets, highlighting the significance of housing equity withdrawal (HEW) in other countries. Section 6 concludes.
1 The author is an Economist in the Economic Analysis, Research and Publications Department. With thanks to Maurice McGuire, Tom O’Connell, Mary Ryan and Karl Whelan for helpful comments. The views expressed in this article are not intended to represent those of the Central Bank and Financial Services Authority of Ireland or the Eurosystem.
2.
Evolution of Housing Wealth and
Consumption in Ireland
2.1 House prices and housing wealth
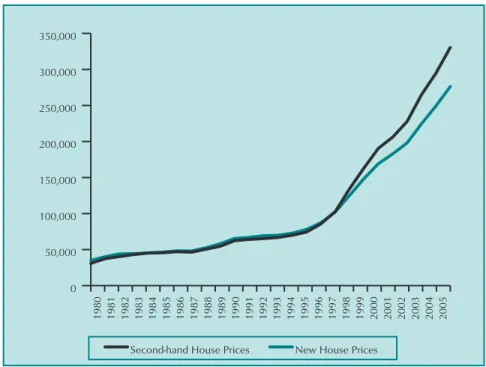
Figure 1 below shows the evolution of new and second hand house prices2
, in nominal terms, from 1980 onwards. Between 1996 and 2005, the average annual growth rate in second hand house prices was 16% while that applying to new house prices
was 13.5%. Thus, the average second hand house cost \85,629
in 1996 but had risen to some \330,399 by 2005. The
corresponding figures for new houses were \87,202 and
\276,221. 0 50,000 100,000 150,000 200,000 250,000 300,000 350,000
New House Prices Second-hand House Prices
2005 2004 2003 2002 2001 2000 1999 1998 1997 1996 1995 1994 1993 1992 1991 1990 1989 1988 1987 1986 1985 1984 1983 1982 1981 1980
Figure 1: New and Second-hand House Prices €, Nominal
How has this increase in house prices affected housing wealth? A very useful series on the housing stock has been provided by the Department of Environment and Local Government (DEHLG) which incorporates an estimate for annual depreciation. This series is available from 1991 onwards but has been backcast prior to that date3. To derive a housing wealth estimate from the housing stock series, the stock of new and existing houses are valued at the average new and second-hand prices respectively, as shown above. According to this series, the nominal value of
the housing stock rose from \39.1bn in 1981 to \553.5bn in
20054
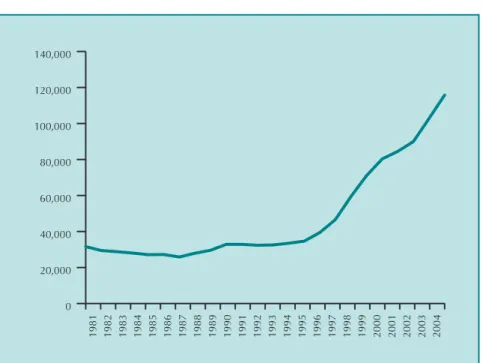
. For estimation purposes, it is the real, per capita value of the housing stock that will be of interest. This is graphed in Figure 2 on the next page.
2 Using figures from the Department of Environment, Heritage and Local Government (DEHLG).
3 Prior to 1991, the housing stock series is backcast using the growth rate of the total number of households in the state.
0 20,000 40,000 60,000 80,000 100,000 120,000 140,000 2004 2003 2002 2001 2000 1999 1998 1997 1996 1995 1994 1993 1992 1991 1990 1989 1988 1987 1986 1985 1984 1983 1982 1981
Figure 2: Real Per Capita Housing Stock, €
Again, the effect of rising house prices is clear with the series increasing from just over \30,000 in 1981 to around \116,000 by 2004.
2.2 Consumption
What of the recent behaviour of consumption? The evolution of real per capita consumption spending is shown in Figure 3 below. 0 2,000 4,000 6,000 8,000 10,000 12,000 14,000 16,000 18,000 2004 2003 2002 2001 2000 1999 1998 1997 1996 1995 1994 1993 1992 1991 1990 1989 1988 1987 1986 1985 1984 1983 1982 1981 1980
While the growth in annual real per capita consumption appears strong at an average of 4.7% between 1996 and 2004, it should be borne in mind that the savings rate was only barely lower at the end of this period than at the beginning, standing at just over
10% in 1996 and 9.5% by 20045
. While there was a sharp dip in the rate to around 5% in 2000, there is little to suggest that the housing boom has provoked a wealth effect on consumption; this would show up in a sustained reduction in the savings rate which has not been the case. Further econometric evidence will be considered in section 4.
3.
International and Irish Evidence on the
Relationship between Housing Wealth and
Consumption
One of the first issues to consider is how consumption may be
affected by housing wealth or through whatchannelscould such an effect operate. Several such channels may be identified as follows6
:
Direct Wealth Effect: — Higher house prices increase housing wealth, which could lead to increased consumption. However, as housing is a consumption good, higher house prices can be viewed as compensation for higher implicit rental costs of living in houses whose prices are increasing. The positive effect of higher house prices is offset by an increase in the opportunity cost of the housing services consumed. Unless homeowners can substitute consumption away from housing (e.g., trade down to a smaller house) there should be no direct wealth effect on consumption. There may, however, be other indirect effects.
Borrowing constraints: — House price changes may affect consumption through their impact on borrowing constraints. An increase in house prices raises the value of housing assets which may be used as colatteral for loans. For borrowing constrained homeowners, this may lead to increased consumption.
Financial Liberalisation: — By relaxing borrowing constraints on all consumers, financial market liberalisation may drive up house prices and provide a stimulus to consumption.
Unobserved factors: — Unobserved macroeconomic factors may drive the apparent relationship between house prices and consumption. If consumers are optimistic about the outlook for the economy as a whole and future income prospects, house prices may be driven up along with consumption. If house prices are more flexible than the prices of other goods, they may be
5 ßased on the National Income and Expenditure Accounts, 2005. Figures for 2003 and 2004 in particular are provisional.
observed to Granger cause consumption (Labhard, Sterne and Young, 2005).
The existence of a direct wealth effect as outlined above is complicated by the differing effect house price increases have on different groups of consumers, e.g., homeowners versus would-be buyers. If these groups have different marginal propensities to consume, the effect of house price changes on their relative wealth positions may induce consumption effects. However, the effects from different groups may partly cancel each other out.
The Magnitude of the Effect of Housing Wealth on Consumption — International Evidence
Most of the studies described in this section are based on time series data, with a few exceptions, and estimate macroeconomic consumption functions. This is based on the life-cycle hypothesis of Modigliani (1949), whereby consumption is determined by households’ lifetime income and wealth. Most allow for different long-run and short-run effects7
. In the long-run, trends in consumption will be closely related to trends in income and wealth. There can be deviations from this equilibrium relationship in the short-run but it will gradually revert back to equilibrium over time. Short-run consumption is therefore modelled with an error correction mechanism to capture this reversion. Short-run dynamic terms which can lead to deviations from the long-run trends may be included such as lagged values of income and
wealth and other factors such as interest rates, the
unemployment rate or inflation (HM Treasury 2003).
Girouard and Blondal (2001) assess the impact of housing wealth on consumption for a panel of G7 countries over the period 1970 to 1999. Disaggregating wealth into housing and financial wealth, the housing wealth effect is found to be significant and positive for US, Canada, UK, France and Japan. The long-term relationship implies MPCs out of housing wealth ranging from 0.02 for the US to 0.18 for Canada. Using gross housing assets instead of housing equity improves the estimated results for some countries and allows a higher housing wealth MPC for the US of 0.05.
Short-term results show that changes in financial wealth have a positive impact on the growth rate of consumption for all countries while changes in housing wealth, using various measures, has a positive effect for Japan, the UK, the US, Canada and France while it has a negative effect for Italy.
Catteet al(2004) examine the linkages between housing markets and the business cycle in OECD countries. The marginal
propensities to consume out of housing wealth are estimated for ten countries, again based on the life-cycle model. Long-run estimates of 0.05 to 0.08 are found for Australia, Canada, the
Netherlands, the UK and US8 while an effect of between 0.01
and 0.02 is found for Italy, Japan, and Spain with statistically insignificant effects found for France and Germany. The impact of housing wealth on consumption appears to be positively
correlated with mortgage market size9
, the efficiency and responsiveness of mortgage markets and the existence of opportunities for equity withdrawal.
Ludwig and Slok (2004) investigate the relationship between stock prices, house prices and consumption using a panel of quarterly data for 16 OECD countries including Ireland, over the period 1960 — 2000. As housing wealth data are not broadly available for these countries, price indices are used as proxies for stock market and housing wealth and enable a quarterly focus. Results are estimated for the full panel and for two sub-groups with the split based on whether a country’s credit market systems
are bank-based or market-based10
. Ireland is included in the group of market-based economies.
The authors caution that due to data limitations, their results are at best, tentative. However, the elasticity of consumption spending to stock market prices is found to be larger for market-based rather than bank-market-based economies. Estimated long-run elasticities on stock prices have increased over time which is taken to reflect the increased importance of stock-market wealth and financial market deregulation. The elasticity of consumption to house price changes is larger in the sub-period 1985-2000 at around 0.03 for both classifications than in 1960-1984. The authors feel that it is still unclear from their results whether this elasticity is different from the corresponding stock price elasticity. This contrasts with the findings of Case, Quigley and Shiller (2005) who find weak evidence of a stock market effect and a strong housing market effect. Their study uses a panel of annual observations for 14 countries, including Ireland, for the period 1975-1999 and a quarterly panel of US states for the period 1982-1999. A different measure of housing wealth is used than in the previous study; estimates of housing market wealth are derived by multiplying a housing price index for each country by the number of households in each year by the homeownership rate to derive the aggregate value of owner occupied housing11
.
8 For these five countries, the housing wealth effect is larger than the financial wealth effect. 9 As measured by, e.g., household mortgage debt ratios.
10 Characterised by a larger size of stock markets and a higher degree of stock market capitalisation than in bank-based systems. The responsiveness of consumption to changes in stock market prices should therefore be higher for market-based systems.
11 Data on the number of owner-occupied housing units were taken from theAnnual Bulletin of Housing and Building Statistics for Europe and North America, published by the United Nations.
The resulting measure may be thought of as the wealth of homeowners assuming they own a standard unchanging home and deliberately takes no account of the size or quality of new construction or of improvements in existing homes.
The econometric results show an elasticity of consumption to housing wealth for the international panel of 0.11 to 0.14 and for the panel of US states from 0.04 to 0.06. Increases in stock market wealth are found to have virtually no effect. Changes in tax laws in the US in 1986 favoured the use of housing equity for consumption and home equity loans became more widely available. Splitting the sample and running estimations before and after 1986 shows that the estimated effects of housing market wealth are substantially larger after the 1986 Act. The authors also test for asymmetry, i.e., whether the effects of housing market wealth decreases have the same effect on consumption as increases. They find that decreases in housing market wealth have no effect on consumption.
Campbell and Cocco (2005) use micro data, namely the UK Family Expenditure Survey (FES), to assess the relationship between consumption and house prices12
. The use of micro data enables the assessment of effects among different sub-groups of the population. The results show the largest house price elasticity of consumption for older homeowners and an elasticity insignificantly different from zero for younger renters, the former being the group most likely to gain and the latter the group most likely to lose from house price increases. This suggests that, other things being equal, as the population ages, consumption may become more responsive to house price changes. Controlling for economy-wide house prices and for regional income, regional house prices are found to influence regional consumption. Labhard, Sterne and Young (2005) provide a critique of the existing literature on the link between wealth and consumption, focusing mainly on the marginal propensity to consume from financial wealth. They argue that there is little theoretical rationale for a wide cross-country dispersion of this coefficient and that differences found in international results may reflect difficulties in accurately measuring wealth and the failure to account for shocks causing changes in both consumption and wealth. With regard to housing, they posit that the theoretical grounds for believing that there is a long-run housing wealth effect across countries are uncertain and that data deficiencies undermine efforts to uncover such an effect. Therefore, it should not be surprising that the literature is inconclusive as to the relative role of housing wealth effects across countries and time, as we have seen. They assert that short-run links found may be due to strong growth in some countries housing markets at
12 Non-durable consumption is the focus of analysis. As each household is interviewed only once in the FES, a pseudo-panel is constructed using data from 1988 to 2000.
certain points in time. Using panel data techniques, the authors find that the hypothesis of a common long-run propensity to consume from financial wealth across countries can not be rejected consistently and an estimate of 6% is obtained for a cross-section of eleven OECD countries.
Irish Evidence
A few studies exist considering the relationship between wealth and consumption in Ireland. Kenny (1998) assesses the role of house prices in the Irish economy, over the period 1975-199713
. The response of consumption is found to depend on the type of shock hitting the housing market. For a purely random increase in house prices, there is some evidence that this gives rise to a positive deviation in consumption above its equilibrium, given the level of income. In the case of an income shock, the model gives rise to a positive response in both consumption and real house prices, but there appears to be no evidence that consumption rises or overshoots its new equilibrium level. Hogan and O’Sullivan (2003) also assess the impact of house prices on consumption in Ireland14
. The study assesses whether there is causation between the house price boom and increases in consumption or whether rising GDP is responsible for both phenomena. Most of the change in consumption is found to be explained by changes in income. In order to control for potential simultaneous equation bias, the model is re-estimated with Instrumental Variables and again the only statistically significant determinant of consumption is found to be income. The authors conclude that the recent growth in real incomes caused both the increase in consumption and in house prices and that the causation ran in one direction only.
In 2005, the IMF published a study on the Irish economy which included an assessment of the relationship between household savings (rather than consumption) and capital gains in housing. An econometric model of savings is estimated using household data from the Household Budget Survey for 1994/95 and 1999/200015
. Capital gains are measured as the change in the housing price in the region in which the household lives between the two surveys, using house price data from the Department of the Environment. Real capital housing gains are found to have a
13 The housing stock data used was calculated using the series on housing completions published by the Department of the Environment, using the perpetual inventory method. A base estimate of the number of households was taken from the Census of Population. The housing price data were computed as a weighted average of the country-wide average of new and second hand house prices deflated by the consumer price index using data from the Housing Statistics Bulletin again published by the Department of the Environment. 14 Housing wealth is calculated as the product of the stock of housing and the average national price of second hand houses, differing in this respect from the Kenny study described above, which used a weighted average of new and second-hand prices. 15 A synthetic panel is constructed using information on the year of birth and gender of the
head of the household and the region where the household lives, in order to exploit the variation in housing prices across regions.
barely significant negative effect on savings, consistent with the findings of Hogan and O’Sullivan, described above. The authors speculate that this may be due to the limited availability of equity withdrawal in Ireland, as did Hogan and O’Sullivan. The issue of bequest motives being very important in Ireland is also raised; households may prefer to pass housing capital gains to their offspring, who now face higher lifetime housing costs.
4.
Estimation and Results
This section describes the estimation of consumption functions incorporating a measure of housing wealth. Stock market wealth is also included as an explanatory variable. The relationship is allowed to differ over the long-run and short-run time horizons16
. The long-run co-integrating relationship was estimated by a variety of methods; the Johansen procedure (Johansen, (1998), Johansen and Juselius (1990)), the Phillips-Hansen approach (Fully Modified Ordinary Least Squares, FM-OLS, (Phillips, 1991), (Phillips, 1994), (Phillips and Hansen, 1990)) or by the Auto Regressive Distributed Lag (ARDL) approach to cointegration. The most satisfactory (or least unsatisfactory) relationship was then selected.
The short-run relationship was freely estimated by OLS with the long-run co-integrating relationship entered into the short-run equation as an error correction term (ECM). A General to Specific approach was adopted for the short-run relationship with a very general starting specification that includes lags of variables appearing in the long-run relationship, the lagged error correction term and a number of lags of variables that might be considered relevant; in this instance these included the unemployment rate and the real short-term interest rate.
The starting point for the estimation was the following long-run equation:
C* =f(PYR, FWR VHSR, ISEQR) [1]
All variables are on a quarterly basis and are logged and in real, per capita terms17
. PYR refers to disposable income and FWR to financial wealth defined as the non-housing capital stock, government debt outstanding and net foreign assets. Data for these two variables are taken from the in-house quarterly
databank of the Bank’s macro-econometric model. The
depreciation rate applied to the non-housing capital stock is from
16 The relationship is estimated using the same approach as that used in the Bank’s macro-econometric model, indeed it is hoped that such a relationship can eventually be embedded within that model (see McQuinn, O’Donnell and Ryan, 2005).
Keeney (2006)18
. The housing stock variable, VHSR, is as defined at section 2, converted to a quarterly basis, using quarterly data on house prices and completions. The unpublished DEHLG dwelling stock data was converted to a quarterly basis using a ‘straight-line’ approach as was the growth rate in the number of
households with which it was back-cast. ISEQR19
refers to the real value of the quarterly average of the ISEQ index of the Irish stock market, again in per capita terms.
Considering firstly results from the Philips-Hansen approach, the coefficients on financial wealth and housing wealth are insignificant, as can be seen from Table 1 below.
Table 1
Phillips-Hansen Estimates, Dependent variable: LPCRPC
Regressor Coefficient Standard Error T-Ratio[Prob]
Intercept −0.332 0.269 −1.23[0.222]
LPYRPC 0.809 0.102 7.89[0.000]
LFWRPC 0.161 0.112 1.44[0.154]
LVHSRPC −0.035 0.022 −1.58[0.118]
LISEQRPC 0.025 0.009 2.82[0.006]
Removing these insignificant variables, yields the results in Table 2 below.
Table 2
Phillips-Hansen Estimates, Dependent variable: LPCRPC
Regressor Coefficient Standard Error T-Ratio[Prob]
Intercept 0.036 0.021 1.68[0.096]
LPYRPC 0.892 0.0176 50.703[0.000]
LISEQRPC 0.037 0.008 4.777[0.000]
The coefficient on income is high at 0.89, while that on the ISEQ index is low at almost 0.04. Using the ARDL approach, very similar results are found with again just income and stock market wealth significant in the long-run, Table 3 below.
Table 3
ARDL Approach, Dependent variable: LPCRPC
Regressor Coefficient Standard Error T-Ratio[Prob]
LPYRPC 0.882 0.043 20.5665[0.000]
LISEQRPC 0.042 0.024 1.7201[0.090]
Intercept 0.069 0.061 1.1353[0.260]
With the Johansen approach, estimating with and without an intercept, only income is significant in the long-run and shows a
18 This paper presents detailed asset level analyses of the stocks and depreciation of Irish fixed assets and the capital formation flows used to derive them, applying an improved perpetual inventory methodology for calculating depreciation based on the method applied for the US National Income and Product Accounts.
coefficient of around 0.9. Thus, in none of the specifications is there a role for housing wealth, nor indeed for financial wealth. Stock market wealth is the only wealth variable which shows as significant in the long-run specification.
Estimating a short-run equation with these long-run relationships entered as error correction terms, those from the Johansen methodology became insignificant and could not be retained in the short-run.
The short-run relationship which follows on from the long-run results in Table 2 from the Phillips-Hansen approach is as follows
Table 4
Ordinary Least Squares Estimation, Dependent variable: DLPCRPC
Regressor Coefficient Standard Error T-Ratio[Prob]
Intercept 0.004 0.001 2.9936[0.004] DLPCRPC(−1) −0.248 0.095 −2.6027[0.011] DLPCRPC(−2) 0.359 0.086 4.1772[0.000] DLPCRPC(−3) 0.413 0.093 4.4510[0.000] DLISEQRPC(−2) 0.019 0.008 2.3219[0.023] ECM(−1) −0.171 0.054 −3.1416[0.002] R-Squared 0.463 R-Bar-Squared 0.426
The first lag of consumption is negative but the overall effect of lagged consumption is strongly positive. The ISEQ index enters with a small positive effect while the ECM term is correctly signed and has quite a strong effect.
More or less identical short-run results to the above follow on from the long-run results in Table 3 derived from the ARDL procedure as follows
Table 5
Ordinary Least Squares Estimation, Dependent variable: DLPCRPC
Regressor Coefficient Standard Error T-Ratio[Prob]
INPT 0.0008 0.002 0.51[0.612] DLPCRPC(−1) −0.252 0.095 −2.65[0.010] DLPCRPC(−2) 0.354 0.086 4.09[0.000] DLPCRPC(−3) 0.408 0.093 4.38[0.000] DLISEQRPC(−2) 0.019 0.008 2.23[0.029] ECM(−1) −0.167 0.054 −3.08[0.003] R-Squared 0.46 R-Bar-Squared 0.424
Thus, there appears to be little role for the housing stock in the long-run and short-run determination of consumption. Tables 2 and 3 yield similar results from the Phillips-Hansen and ARDL procedures with a long-run relationship between consumption, income and stock market wealth. From both, the short-run results are very similar but the resulting specification is not very rich, containing solely lagged consumption and a lag of stock market wealth with no role for financial or housing wealth, income, the interest rate or the unemployment rate. In this way, the short-run
results are not as rich as in the current version of the Bank’s model which retains unemployment, the interest rate and financial wealth in the short-run consumption equation. In line with other commentators, it seems plausible that the lack of widespread availability of equity withdrawal products in Ireland until quite recently is not conducive to the existence of a relationship between housing wealth and consumption in Ireland.
Given the recent behaviour of the savings rate as described in Section 2, it could be argued that, despite the huge increase in housing wealth, it is not surprising that a relationship between consumption and housing wealth does not show up in econometric analyses. Consideration of the savings rate would suggest that the house price boom has not provoked a strong wealth effect on consumption. The econometric evidence supports this view. This is not to say that if house prices were to fall significantly, causing a sizeable decline in housing wealth, that no impact on consumption would be observed, i.e., the relationship between housing wealth and consumption may be asymmetric. It may be the case that while increases in housing wealth do not seem to have had an effect on consumption, reductions in housing wealth would possibly impact on
consumption negatively. This could occur, e.g., through
confidence effects. As noted above, Caseet al(2005), found that decreases in housing wealth had no effect on consumption in the US.
5.
The Importance of Mortgage Market Features
Equity Withdrawal
We have reviewed the not-always-consistent evidence on the relationship between housing wealth and consumption and described the results of an econometric analysis of such a relationship. The issue of how housing equity withdrawal (HEW) can affect this relationship must also be considered.
Equity withdrawal allows mortgage holders to extract liquidity from the housing market by renegotiating existing mortgage loans or contracting second mortgages on the same property. The economy-wide level of HEW reflects the level of owner occupation and of housing wealth, the volume of housing market transactions and the degree of liberalisation in financial and mortgage markets. In the UK between 1979 and 1999, HEW averaged 3 per cent of household disposable income while over the same period in Germany, France and Italy, net injections20
to housing equity of 6 per cent of household income were recorded. This high level of HEW in the UK reflects the strong
20 The excess of net investment in housing over net flows of borrowing secured against housing.
upward trend in house prices and thus housing wealth, a relatively high volume of housing transactions reflecting low transaction costs and a greater relative degree of financial deregulation21.
There are contrasting views as to the impact of HEW on
consumption; one view being that the strong negative
correlation with savings rates (particularly since the mid 1990s in
the US) reflects causation and a strong influence on
consumption. We have noted that Case et al found that the
effects of housing wealth were larger in the US after 1986 when tax law changes favoured the use of housing equity for consumption. The other approach is that the correlation is driven by independent factors which lead to a fall in savings and rising HEW (Klyuev and Mills, 2006).
Girouard and Blondal (2001) assess the importance of HEW by including its level as a proportion of income in their long-run and short run equations. They find evidence of a long-run effect for the US, Canada, the UK and France but the significance of the housing wealth variable is affected for some countries. In the short-run, the change in HEW has a positive and significant impact on the growth rate of consumption in the US, UK, Canada and France but the significance of the financial and housing wealth variables in some countries are again affected. To examine the possibility that HEW may have only a short-term impact on consumption, the HEW variable is then entered only in the short-term equation with an aggregate wealth variable used. The HEW variable is found to be robust to this new specification having a positive and significant impact on the growth rate of consumption on all four countries. Among their conclusions, the authors highlight the need for careful monitoring of mortgage arrangements that make it easier for households to withdraw housing equity and therefore finance consumption. Catteet al(2004) also examine the role of equity withdrawal and the functioning of mortgage markets. When a variable measuring HEW is added to the consumption equation, the MPC out of HEW is significant for Australia, Canada, the Netherlands, the UK and US with a magnitude of 0.20 for the US and 0.89 for the UK. Where the HEW variable is significant, it captures most of the impact of housing wealth on consumption, suggesting that much of the impact is through the greater liquidity that HEW can provide.
However, Klyuev and Mills (2006) cite survey evidence from Australia, the US and the UK of homeowners who released home equity which show that HEW is used mainly to acquire financial assets, repay expensive debts and improve the housing stock
through home improvements. These types of spending have little impact on consumption. Generally, less than twenty per cent is used to finance consumption spending. This evidence shows that equity release occurs primarily through housing transactions rather than through an increase in mortgage debt.
Currently, HEW remains limited in Ireland and given the lack of data on this aspect of the Irish housing market, it is not possible to formally test for such an effect. Anecdotal evidence would suggest that the majority of any equity withdrawal that has occurred to date has gone back into the housing market, thus having little effect on consumption. Much of this may be due to parents transferring housing wealth to adult children to enable them to get a foothold in the housing market (CBFSAI, 2004). The purchase of holiday homes and investment properties would be another relevant factor.
A recent report sheds some new light on this issue22
. Of the total of new mortgages granted in quarter two 2006, top-up mortgages accounted for the largest proportion at 34.4% but were the smallest of the loan categories in terms of value at 16%23
. The authors write ‘based on feedback from lenders it is our understanding that the majority of top-up mortgage funds are used to pay for property extensions and renovations, with the remainder being used to fund a range of activities, e.g., education, car purchase etc.’ Again, spending on extensions and renovations would have little direct impact on consumption.
Other Mortgage Market Features
Besides equity withdrawal, several other mortgage market
features are relevant. Catte et al posit that consumption
responses to housing wealth should be higher where there is a high rate of owner-occupation which leads to a wider distribution of housing wealth, where housing transaction costs are low and housing wealth is exempted from capital gains taxes, which should encourage owners to perceive housing assets as more liquid and where financial markets provide easy access to mortgage financing and to financial products that facilitate equity withdrawal. What is the Irish position on these and other relevant mortgage market features?
The rate of owner occupation in Ireland is one of the highest in
the OECD at 77% exceeded only by Spain and Italy24
. Capital gains on housing assets are taxable although principal owner-occupied dwellings are exempt. Transaction costs in Ireland are generally regarded as being in the middle range of European
22 Irish Bankers Federation/Price Waterhouse Coopers Mortgage Market Profile, 2006. 23 The other loan categories were residential investment loans, re-mortgaging, first time buyers
purchase and mover purchase. Top-ups are defined as a further mortgage advance to an existing borrower which is issued to finance expenditure other than house purchase. 24 The rate is as low as 42% in Germany.
countries (Giuliodori, 2004). As noted above, in the Catte et al
study, the size of the long-run housing wealth effect is positively correlated with household mortgage debt ratios. Ireland recently ranked fifth of the OECD countries in the league of residential mortgage debt as a percentage of disposable income at 106%25. The highest figure was recorded for the Netherlands at 208%, the lowest for Italy at just 20%. Given recent increases in mortgage indebtedness, the figure for Ireland now stands closer to 125%-130%. Considering the proportion of mortgage debt to GDP, Ireland ranked seventh at 33% in 2001, with the Netherlands again highest at almost 80% (HM Treasury 2003). This figure for Ireland is now closer to 70%.
A high proportion of home loans in Ireland are at variable interest rates — the second highest in the OECD in 2002 at 85%26. This means that, until recently, mortgage holders were benefiting from low interest rates. Average loan-to-value ratios in Ireland are currently around 80%, having risen from 60% in the 1980s
(OECD 2006)27
. Indeed, the OECD notes that access to mortgage finance is less restrictive in Ireland than elsewhere, especially compared to Continental Europe. Financial market liberalisation during the 1980s and 1990s has allowed a rapid expansion in credit and increasing loan-to-value ratios are one example of this. This report also highlights the trend towards securitisation of bank loans as another element of liberalisation28
. Already a feature of mortgage markets in the US, UK and the
Netherlands, securitisation allows interest rates on new
borrowing to be more responsive to financial market
developments and lowers the costs of taking out mortgages through increasing competition. It should also make it easier to access HEW although, as we have seen, this remains limited in Ireland.
HM Treasury (2003) outlines the conditions on which HEW depends. These are the degree of owner occupation and housing wealth, the degree of financial market liberalisation and the extent of housing market turnover. Over the period 1987-98, out of twelve countries, Ireland ranks in the middle for the yearly number of housing transactions per 1,000 residents at 13.5. The UK recorded the largest number at 20.6 (Giuliodori, 2004). On the other conditions, as we have just discussed, Ireland would seem to be amenable to increased availability of equity withdrawal. Indeed, CBFSAI (2005) notes that there is wide scope for equity withdrawal in Ireland.
6.
Conclusions
This paper has considered the impact of the recent increase in housing wealth on consumption in Ireland. An examination of
25 OECD (2006), using 2003 data for most countries, the Irish figure is an estimate for 2005. 26 OECD (2006).
27 The corresponding figure for new loans is in the region of 70-100%, (OECD 2006). 28 For more information on residential mortgage securitisation, see Box 3 of Kelly (2004).
the international literature showed mixed evidence on the size of the effect. Irish evidence on the existence of such a relationship is also mixed. Econometric analyses carried out for this article found no evidence of a housing wealth effect. This is not to say that if house prices were to fall significantly, causing a sizeable decline in housing wealth, that no impact on consumption would be observed, i.e., the relationship between housing wealth and consumption may be asymmetric.
The conditions that are held to lead to a strong positive effect on consumption were reviewed. Were it not for the absence of widespread equity withdrawal, conditions in Ireland would seem quite conducive to a potentially strong positive relationship between housing wealth and consumption with high rates of owner occupation, a rapid expansion of mortgage credit and relatively unrestricted access to mortgage finance in an international context. Transaction costs on housing are, however, in the medium range and are higher than in the UK, for example. The Bank, in its 2005 Financial Stability Report, notes that there is wide scope for equity withdrawal in Ireland. Even bearing in mind the contrasting evidence on its role, it seems clear that
should housing equity withdrawal become more widely
available, the impact on consumption will have to be closely monitored.
Given the structural change which has taken place in the Irish housing market over the period under consideration, combined with the structural change which has taken place in the economy as a whole, time-series analyses may not be best-suited to consideration of this topic. Future work will explore the possibility of using the next round of the Household Budget Survey, due to be released this year, for further analysis of this topic.
References
CBFSAI (2004) ‘‘Financial Stability Report 2004,’’ Central Bank and Financial Services Authority of Ireland.
CBFSAI (2005) ‘‘Financial Stability Report 2005,’’ Central Bank and Financial Services Authority of Ireland.
Campbell, J.Y., Cocco, J.F. (2005) ‘‘How do House Prices Affect Consumption? Evidence from Micro Data,’’ National Bureau of Economic Research Working Paper No. 11534.
Catte, P, Girouard, N., Price, R. and Christophe, A. (2004)
‘‘Housing Markets, Wealth and the Business Cycle,’’
Economics Department Working Paper, No. 394, OECD, December 2004.
Case, K.E., Quigley, J.M., Shiller, R.J. (2005) ‘‘Comparing Wealth Effects: The Stock Market versus the Housing Market,’’
Advances in Macroeconomics, Volume 5, Issue 1, Berkeley Electronic Press.
Girouard, N. and Blondal, S. (2001) ‘‘House Prices and Economic Activity,’’ OECD Economics Department Working Papers, No. 279, OECD Publishing.
Giuliodori, M. (2004) ‘‘Monetary Policy Shocks and the Role of House Prices Across European Countries,’’ Working Paper N0. 015/2004, De Nederlandsche Bank, Amsterdam.
Hogan, V. and O’Sullivan, P. (2003) ‘‘Consumption and House Prices in Ireland,’’ Institute for the Study of Social Change, University College Dublin, Working Paper 2003/15.
HM Treasury (2003) ‘‘Housing, Consumption and EMU,’’ EMU Study, HM Treasury.
Irish Bankers Federation / Price Waterhouse Coopers (2006), Mortgage Market Profile, www.ibf.ie
Johansen S. (1988) ‘Statistical Analysis of Cointegration Vectors’, Journal of Economic Dynamics and Control,12, 231-254. Johansen S. and Juselius K. (1990) ‘Maximum likelihood
estimation and inference on cointegration — with application to the demand for money’, Oxford Bulletin of Economic and Statistics, 52, 169-210.
Keeney, M. (2006) ‘‘Measuring Irish Capital,’’ Central Bank and Financial Services Authority of Ireland Technical Paper, 13/RT/06, November 2006 and forthcoming in the Economic and Social Review, Vol. 37.
Kenny, G. (1998) ‘‘The Housing Market and the Macroeconomy: Evidence from Ireland,’’ Central Bank of Ireland Technical Paper, 1/RT/98.
Klyuev, V. and Mills, P. (2006) ‘‘Is Housing Wealth and ‘‘ATM’’? The Relationship Between Household Wealth, Home Equity
Withdrawal and Saving Rates,’’ IMF Working Paper
WP/06/162, International Monetary Fund.
Labhard, V., Sterne, G. and Young, C. (2005) ‘‘Wealth and Consumption: An Assessment of the International Evidence,’’ Bank of England Working Paper No. 275, October 2005.
Ludwig, A. and Slok, T. (2004) ‘‘The Relationship between Stock Prices, House Prices and Consumption in OECD Countries,’’
Topics in Macroeconomics, Volume 4, Issue 1, Berkeley Electronic Press.
McQuinn, K., O’Donnell, N. and Ryan, M. (2005) ‘‘A Macro-econometric model for Ireland,’’ Central Bank and Financial Services Authority of Ireland Technical Paper 9/RT/05.
Modigliani, F. (1949) ‘‘Fluctuations in the Saving-Income Ratio: A
Problem in Economic Forecasting,’’ Studies in Income and
Wealth, 11, pp. 371-442.
O’Donnell, N. and Keeney, M. (2006) ‘‘Special Savings Incentive Accounts: An Analysis of their impact on Spending and Saving,’’ Central Bank and Financial Services Authority of Ireland, Internal Paper, May.
OECD, (2006) ‘‘OECD Economic Surveys Ireland,’’ Volume 2006/3, March.
Phillips P. (1991) ‘Optimal Inference in Cointegrated Systems’, Econometrica, 55, 703-708.
Phillips P. (1994) ‘Some Exact Distribution Theory for Maximum Likelihood Estimators of Cointegrating Coefficients in Error Correction Models’ Econometrica, 63, 73-93.
Philips P. and Hansen B. (1990) ‘Statistical Inference in Instrumental Variables Regression with I(1) Processes’, Review of Economic Studies, 57, 99-125.