A Machine Learning Approach
to Detecting Attacks
by Identifying Anomalies
in Network Traffic
by
Matthew Vincent Mahoney
A dissertation submitted to the College of Engineering at Florida Institute of Technology
in partial fulfillment of the requirements for the degree of
Doctor of Philosophy in Computer Science Melbourne, Florida May, 2003 TR-CS-2003-13
??? Copyright 2003 Matthew Vincent Mahoney All Rights Reserved
A Machine Learning Approach to Detecting Attacks by Identifying Anomalies in Network Traffic a dissertation by
Matthew Vincent Mahoney
Approved as to style and content
________________________________________ Philip K. Chan, Ph.D.
Associate Professor, Computer Science Dissertation Advisor
________________________________________ Ryan Stansifer, Ph.D.
Associate Professor, Computer Science
_________________________________________ James Whittaker, Ph.D.
Professor, Computer Science
_________________________________________ Kamel Rekab, Ph.D.
Professor, Mathematical Sciences
_________________________________________ William D. Shoaff, Ph.D.
Associate Professor, Computer Science Department Head
Abstract
A Machine Learning Approach to Detecting Attacks by Identifying Anomalies in Network Traffic by
Matthew Vincent Mahoney Dissertation Advisor: Philip K. Chan, Ph.D.
The current approach to detecting novel attacks in network traffic is to model the normal frequency of session IP addresses and server port usage and to signal unusual combinations of these attributes as suspicious. We make four major contributions to the field of network anomaly detection. First, rather than just model user behavior, we also model network protocols from the data link through the application layer in order to detect attacks that exploit vulnerabilities in the implementation of these protocols. Second, we introduce a time-based model suitable for the bursty nature of network traffic: the probability of an event depends on the time since it last occurred rather than just its average frequency. Third, we introduce an algorithm for learning conditional rules from attack free training data that are sensitive to anomalies. Fourth, we extend the model to cases where attack-free training data is not available.
On the 1999 DARPA/Lincoln Laboratory intrusion detection evaluation data set, our best system detects 75% of novel attacks by unauthorized users at 10 false alarms per day after training only on attack-free traffic. However this result is misleading because the background traffic is simulated and our algorithms are sensitive to artifacts. We compare the background traffic to real traffic collected from a university departmental server and conclude that we could realistically expect to detect 30% of these attacks in this environment, or 47% if we are willing to accept 50 false alarms per day.
Table of Contents
List of Figures... ix List of Tables... x Acknowledgments ... xi Dedication ... xii 1. Introduction ... 1 1.1. Problem Statement ... 3 1.2. Approach ... 4 1.3. Key Contributions ... 6 1.4. Dissertation Organization... 6 2. Related Work... 9 2.1. Network Vulnerabilities ... 9 2.1.1. Probes... 102.1.2. Denial of Service Attacks... 12
2.1.3. Remote to Local Attacks ... 13
2.1.4. Attacks on the Intrusion Detection System ... 14
2.2. Properties of Network Traffic ... 16
2.3. Intrusion Detection ... 19
2.3.1. Machine Learning ... 19
2.3.2. Network Signature Detection ... 22
2.3.3. Host Based Anomaly Detection ... 22
2.3.4. Network Anomaly Detection ... 23
2.4. Intrusion Detection Evaluation... 25
3.1. Protocol Modeling... 30
3.2. Time Based Modeling ... 32
3.3. PHAD ... 35
3.4. Experimental Procedure ... 36
3.5. Experimental Results... 37
3.5.1. Attacks Detected ... 38
3.5.2. False Alarms ... 40
3.5.3. Detection ??? False Alarm Tradeoff... 41
3.5.4. Detections by Category ... 42
3.5.5. Implementation and Run Time Performance ... 43
3.6. Summary ... 43
4. Application Layer Modeling... 45
4.1. ALAD... 45
4.2. Experimental Results... 48
4.2.1. Client Address Detections... 50
4.2.2. TCP State Detections ... 50
4.2.3. Keyword Detections... 51
4.2.4. Keyword Argument Detections... 53
4.2.5. Server Address/Port Detections ... 54
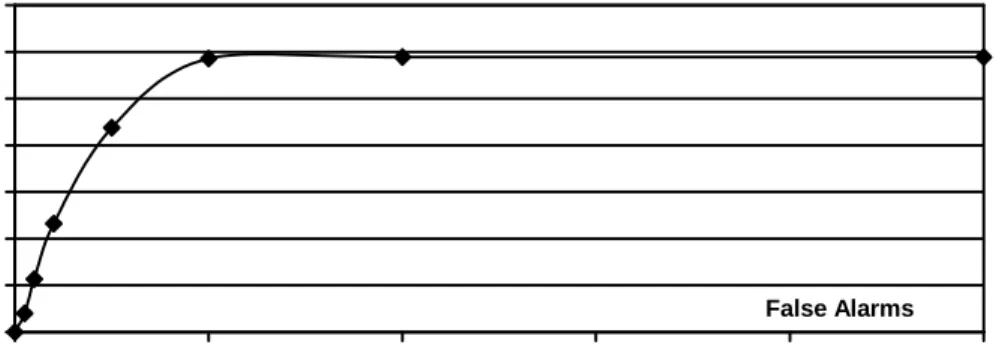
4.2.6. Detection ??? False Alarm Tradeoff... 54
4.2.7. Detections by Category ... 55
4.2.8. Implementation and Run Time Performance ... 56
4.3. Summary ... 56
5. Learning Conditional Rules ... 58
5.1. Rule Learning ... 59
5.1.2. Removing Redundant Rules... 61
5.1.3. Removing Poorly Performing Rules ... 62
5.1.4. Alarm Generation... 63
5.2. Experimental Evaluation ... 64
5.2.1. Experimental Data and Procedures ... 64
5.2.2. Experimental Results ... 65
5.2.3. Detection ??? False Alarm Tradeoff... 67
5.2.4. Detections by Category ... 68
5.2.5. Implementation and Run Time Performance ... 69
5.3. Summary ... 69
6. Continuous Modeling ... 71
6.1. Modeling Previously Seen Values... 71
6.2. NETAD ... 73
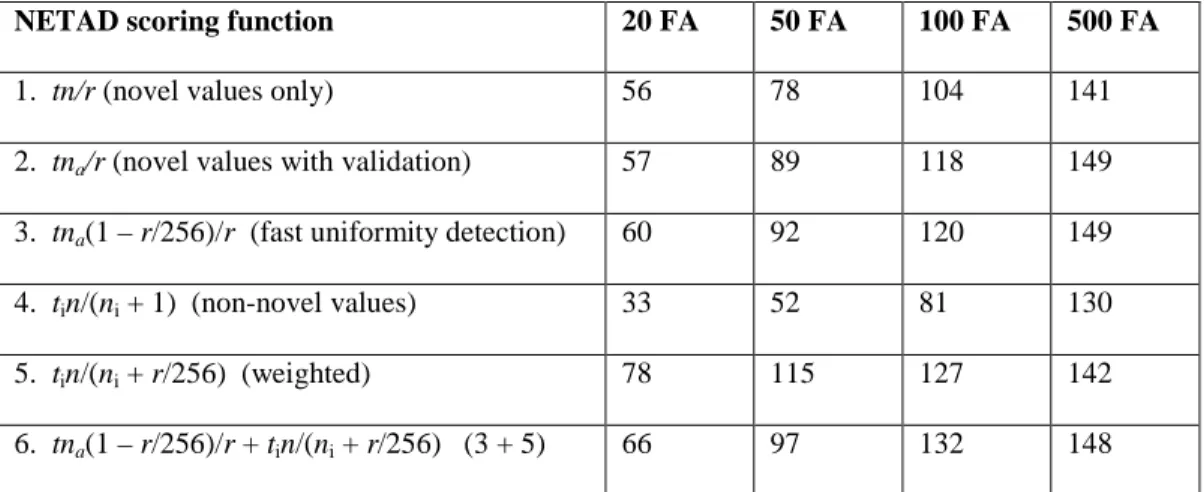
6.3. Experimental Results... 75
6.3.1. Detections by Category ... 78
6.3.2. Detection ??? False Alarm Tradeoff... 79
6.4. Unlabeled Attacks in Training... 80
6.5. Implementation and Run Time Performance... 82
6.6. Summary ... 82
7. A Comparison of Simulated and Real Traffic ... 83
7.1. Traffic Collection ... 85
7.1.1. Environment... 86
7.1.2. Data Set... 87
7.2. Comparison with Real Traffic ... 88
7.2.1. Comparison of All Filtered Packets ... 90
7.2.3. Comparison of Application Payloads... 95
7.3. Summary ... 98
8. Evaluation with Mixed Traffic ... 99
8.1. Data Preparation ... 101 8.2. Algorithm Preparations ... 102 8.2.1. PHAD Modifications ... 102 8.2.2. ALAD Modifications ... 103 8.2.3. LERAD Modifications ... 105 8.2.4. NETAD Modifications... 107 8.2.5. SPADE Modifications... 107 8.3. Evaluation Criteria ... 108 8.4. Experimental Results... 110 8.4.1. PHAD Results ... 111 8.4.2. ALAD Results... 113 8.4.3. LERAD Results... 114 8.4.4. NETAD Results ... 115 8.4.5. SPADE Results ... 117 8.5. Results Analysis ... 118 8.6. Summary ... 121 9. Conclusions ... 123 9.1. Summary of Contributions ... 123
9.2. Limitations and Future Work ... 126
References ... 129
Appendix A: Example LERAD Run ... 135
A.1. Rules... 135
List of Figures
2.1. DARPA/Lincoln Labs IDS Evaluation Test Configuration... 26
3.1. PHAD DFA Curve... 41
4.1. ALAD DFA Curve ... 55
5.1. LERAD Candidate Rule Generation Algorithm ... 60
5.2. LERAD Redundant Rule Elimination Algorithm... 62
5.3. LERAD Rule Validation Algorithm ... 63
5.4. LERAD DFA Curve ... 68
6.1. NETAD DFA Curve ... 79
7.1. Good vs. Bad Rules ... 90
8.1. Mapping Real Time to Simulation Time ... 101
List of Tables
2.1. Top Results in the 1999 IDS Evaluation ... 28
3.1. PHAD Detections by Category... 42
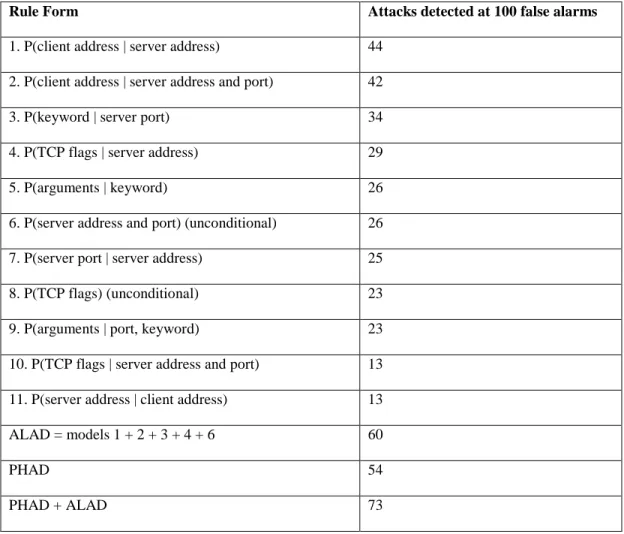
4.1. ALAD Detections by Rule Form ... 49
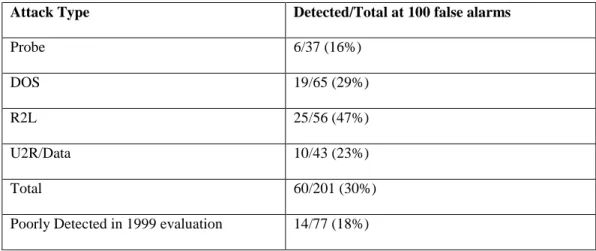
4.2. ALAD Detections by Category ... 56
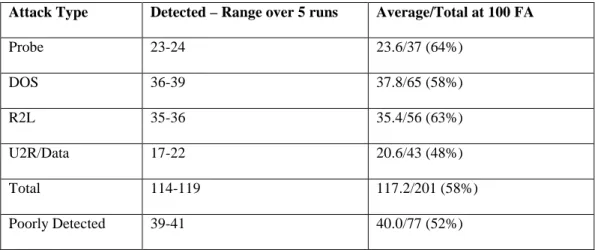
5.1. LERAD Detections by Category ... 69
6.1. NETAD Detections by Scoring Function ... 76
6.2. NETAD Detections by Category ... 79
6.3. NETAD Detections in Continuous Mode ... 81
7.1. Comparison of Nominal Attributes in Simulated and Real Traffic ... 91
7.2. Comparison of Binary Attributes... 92
7.3. Comparison of Continuous Attributes ... 93
7.4. Comparison of Inbound TCP SYN Packets... 94
7.5. Comparison of HTTP Requests ... 95
7.6. Comparison of SMTP and SSH ... 97
8.1. Mixed Data Sets... 102
8.2. Mixed Packet Types for PHAD ... 103
8.3. Mixed Packet Types for NETAD ... 107
8.4. Detections on Mixed Traffic... 111
8.5. SPADE Detections ... 117
8.6. LERAD and NETAD Detections on Mixed Traffic ... 121
Acknowledgments
I wish to thank my dissertation advisor Dr. Philip K. Chan for guidance through this dissertation, including co-authorship of several papers which were published as a result of this research. I also thank my the dissertation committee, Dr. Ryan Stansifer, Dr. Kamel Rekab, and Dr. James Whittaker.
This work would not be possible without the DARPA/Lincoln Laboratory intrusion detection evaluation data set. I thank Richard Lippmann, who led the development of this data set, for valuable feedback on our work. I also thank the anonymous reviewers of our papers for comments that helped guide our work.
Several other students collaborated on this research under Dr. Chan, and their work is ongoing. Mohammad Arshad is using a clustering approach to outlier detection in the network data to detect attacks. Gaurav Tandon is applying our rule learning algorithm to system call arguments (BSM) in experiments with host based anomaly detection. Anyi Liu also worked in this area. Rachna Vargiya and Hyoung Rae Kim are researching tokenization algorithms for parsing the application payload and identifying keywords.
Dedication
To my wife Joan, who put up with my endless hours on the computer, and to my cats Powerball and Dervish, who sat on my lap as I typed, and occasionally tried to help by walking on the keyboard.
Chapter 1
Introduction
Computer security is a growing problem. The Computer Emergency Response Team, or CERT (2003b) reported 82,094 incidents and 4129 new vulnerabilities in 2002. Both of these numbers have approximately doubled each year since 1997. Likewise, the number of web page defacements per year has approximately doubled each year, growing to about 15 per day in 2000, according to www.attrition.org. While much of this growth can be attributed to the growth of the Internet, there is also an increase in the number of incidents per computer. According to the ICSA 1998 Computer Virus Prevalence Survey, the rate of virus infections per computer per month in large North American organizations increased from 0.1% in 1994 to 3% in 1998.
Most vulnerabilities are software errors, a very old problem. For example, both the Morris Internet worm (Spafford, 1988) and the SQL Sapphire worm (CERT, 2003a) exploit buffer
overflows, a common type of error occurring in many C programs in which the length of the input is not checked, allowing an attacker to overwrite the stack and execute arbitrary code on a remote server. Both worms spread quickly all over the world and caused widespread damage, but with one major difference. In 1988, patches to fix the vulnerability were developed, distributed, and installed worldwide within a day of the attack. In 2003, the vulnerability was known months in advance and patches were available, but many people had not bothered to install them.
Patches and updated software versions are almost always available soon after a
vulnerability is discovered. Unfortunately updating software takes time and computer skills, and sometimes introduces new bugs or incompatibilities. In reality, many people leave their systems insecure rather than try to fix something that already appears to be working. This might explain
why in an audit of U.S. federal agencies by the General Accounting Office in 2000, investigators were able to pierce security at nearly every system they tested (Wolf, 2000).
Even if the software update problem were solved, there would still be a time lag between the development of new exploits and the availability of tests to detect the attack (e.g. virus definition files or firewall rules) or patches to fix the vulnerability. Although patches may be available in a day or so, this would not stop the spread of "flash" worms, which could potentially infect all vulnerable computers on the Internet within a few minutes of release (Staniford, Paxson, & Weaver, 2002). The SQL Sapphire worm is one such example, doubling in population every 8.5 seconds and infecting 90% of vulnerable computers worldwide within 10 minutes of its release (Beverly, 2003; Moore et al., 2003).
Software patches also do not help for the more common case where the victim does not know that his or her computer has been compromised. Attackers may go to great lengths to conceal their backdoors. Websites like www.rootkit.com and www.phrack.org provide tools and describe techniques such as modifying the kernel to hide files and processes or modifying TCP/IP protocols to set up stealth channels to penetrate firewalls.
Furthermore, people are generally unaware that their computers are probed many times per day, either with tools specifically designed for that purpose, such as NMAP (Fyodor, 2003), or by network security tools like SATAN (Farmer & Venema, 1993), which are intended to allow network administrators to test their own systems for common vulnerabilities. Probes often originate from compromised machines, so identifying the source can be helpful to their owners. Thus, it is not enough just to secure our systems. It is also important just to know that a probe or an attack (especially a novel attack) has taken place.
Our goal is to detect novel attacks by unauthorized users in network traffic. We consider an attack to be novel if the vulnerability is unknown to the target's owner or administrator, even if the attack is generally known and patches and detection tests are available. We are primarily interested in three types of remotely launched attacks: probes, denial of service (DOS), and
intrusions in which an unauthorized user is able to bypass normal login procedures and execute commands or programs on the target host. The latter is also known as a remote to local (R2L) attack (Kendall, 1998). Our goal is not to detect viruses, or attacks in which the attacker already has login privileges or physical access and gains root or administrative access (a user to root or U2R attack). Such attacks are easy to conceal from a network sniffer by using a secure shell, and are best detected by monitoring incoming files or the operating system locally.
Our goal is detection, not prevention. We could block suspicious traffic, as a firewall does, but our goal is simply to identify such traffic. This is a difficult problem in the absence of rules to identify such traffic. Although rules to detect many attacks have been developed for network intrusion detection systems such as SNORT (Roesch, 1999) and Bro (Paxson, 1998), our goal is to detect novel attacks. By focusing on detection, we can test our algorithms off-line on sniffed traffic. The normal approach to detecting novel attacks is anomaly detection: modeling normal behavior and signaling any deviation as suspicious. This process generates false alarms, and is one reason the approach is not widely used. Another problem is that the system often cannot help a user, who is typically not an expert in network protocols, decide if an unusual event (say, a UDP packet to port 1434) is hostile or not. In fact, this is the signature of the SQL Sapphire worm, but it could also be legitimate traffic if one were running a server vulnerable to this attack. Nevertheless, an anomaly detection system could help bring unusual events buried in masses of data to the attention of a network administrator, either in real time, or in a forensic analysis of sniffed traffic after something has gone wrong. Thus, our goal is simply to identify the events most likely to be hostile while accepting some false alarms.
1.1. Problem Statement
The problem we are trying to solve is to detect attacks in network traffic with no prior
mostly attack-free) traffic is available from the system we are monitoring. The types of attacks we wish to detect are those that could be detected in network traffic if we knew what to look for. These are attacks by remote, unauthorized users: probes, DOS, or R2L. We assume that our system will be part of a more comprehensive intrusion detection system (IDS) that also uses hand-coded rules to detect known attacks, and host-based methods (monitoring file system and operating system events) to detect U2R attacks, viruses, and backdoors.
1.2. Approach
Our approach to detecting novel attacks is anomaly detection: using machine learning to generalize from attack-free traffic, with the assumption that events which do not fit the model are likely to be hostile. Currently most network anomaly models are based on source and destination IP addresses and server ports. For example, an IDS might signal an alarm in response to a packet addressed to UDP port 1434 if such packets are normally rare, which would be the case a for system not running a database server. If it were, it might signal an alarm if the source address was unusual for that port. In either case, the IDS would assign an alarm score or confidence level inversely proportional to the probability of the event, based on the average frequency in the past. This approach can detect many port scans and many attacks on servers with trusted clients.
Our approach differs in two respects. First, we model protocols, rather than just addresses and ports. Many attacks exploit bugs in protocol implementations. For example, the Morris worm exploits a buffer overflow vulnerability in fingerd, a UNIX based server which tells whether a user is logged in. This attack would not be detected using normal methods (unusual client addresses) because finger accepts requests from untrusted clients. However, by modeling the finger protocol, we could detect this attack. Normal requests are short one-line commands containing ASCII text, but the exploit is 576 characters long and contains VAX executable code. In addition to application
protocols like finger, HTTP (web), and SMTP (email), we also model the transport layer (TCP, UDP, and ICMP), network layer (IP) and data link layer (Ethernet).
Second, our model estimates the probability of an event using the time since it last occurred, rather than average frequency. This model is better suited to bursty (non-Poisson) processes with long range dependencies (Leland et al.; 1993, Paxson & Floyd, 1995). For example, a fast port scan might generate a rapid burst of alarms using a frequency based model, but in a time based model only the first packet would generate a high score, effectively consolidating the alarms. Because we model a large number of attributes, it is necessary to form conditional rules to constrain the protocols, such as "if server-port = 80 then word-1 = GET or POST". We describe an algorithm for generating such rules automatically from a sample of attack-free training data. Many attacks can be detected by events that have never occurred before (i.e. word-1 = QUIT), but it is also effective to model events that have occurred, perhaps many times, but not recently, for example the first occurrence of word-1 = POST in a week. The second model is more appropriate when we do not use explicit training and test periods. We compare these two approaches.
We evaluate our systems on the 1999 DARPA/Lincoln Laboratory IDS off-line evaluation (IDEVAL) data set (Lippmann et al., 2000; Lippmann & Haines, 2000),which simulates several hosts on a local network connected to the Internet under attack by published exploits. Unfortunately the properties that make an IDS sensitive to attacks also make it sensitive to simulation artifacts. For example, the simulation uses different physical machines with the same IP address to simulate some of the attacks and some of the background traffic (Haines et al., 2001). This leads to the unexpected result that many attacks can be detected by anomalies in the TTL, TCP window size and TCP option fields caused by idiosyncrasies of the underlying simulation. Additional artifacts occur in the distribution of client IP addresses and in many application level protocols. We analyze these artifacts in detail by comparing the background traffic with real traffic collected on a university departmental server. We find that by injecting real traffic into the simulation and by some
modification to our algorithms that most simulation artifacts can be removed and the methods we describe remain effective.
1.3. Key Contributions
The key contributions are as follows:
??? A time-based model appropriate for bursty traffic with long range dependencies. ??? Modeling application protocols to detect attacks on public servers.
??? A randomized algorithm that efficiently learns an anomaly detection model represented by a minimal set of conditional rules.
??? Anomaly detection without labeled or attack-free training data.
??? Removing background artifacts from simulated evaluation data by injecting real traffic.
1.4. Dissertation Organization
The rest of this dissertation is organized as follows. In Chapter 2, we review network security and attacks, intrusion detection, properties of network traffic, and the IDEVAL test set. In Chapters 3 through 6, we introduce four anomaly detection algorithms to illustrate our first four key contributions. These four systems are PHAD (packet header anomaly detector) (Mahoney & Chan, 2001), ALAD (application layer anomaly detector) (Mahoney & Chan, 2002b), LERAD (learning rules for anomaly detection) (Mahoney & Chan, 2002a), and NETAD (network traffic anomaly detection) (Mahoney, 2003).
In Chapter 3, we use PHAD to illustrate time-based modeling. The attributes are the Ethernet, IP, TCP, UDP, and ICMP packet header fields. The model is global. No conditional rules are used, and no distinction is made between incoming and outgoing traffic. An anomaly occurs only if a field has a value never seen training. The anomaly score is proportional to the number of
training packets and the time since the last anomaly, and inversely proportional to the number of allowed values.
In Chapter 4, we use ALAD to illustrate the use of conditional rules to model application protocols. ALAD models inbound client traffic. It combines a traditional model based on addresses and ports with a keyword model of the application payload. For example, it signals an anomaly when the first word on a line in an SMTP or HTTP header is novel.
In Chapter 5, we use LERAD to illustrate a rule learning algorithm. LERAD uses a training sample to generate candidate rules that should generate high anomaly scores, then tests these rules on the full training set, keeping those not likely to generate false alarms. LERAD models inbound client requests, but could be used on any type of data that can be expressed as tuples of nominal attributes.
PHAD, ALAD, and LERAD signal anomalies only when a value is never seen in training. In Chapter 6, we introduce NETAD (which tests inbound client packets with fixed conditional rules) to compare these models with those that assign anomaly scores to previously seen values. This type of model does not require an explicit attack-free training period. We conclude that both types are effective, but attack-free training data should be used if it is available.
In Chapter 7, we analyze the IDEVAL training and background data by comparing it to real traffic collected on a university departmental server. Although the IDEVAL developers took great care to make the simulated Internet traffic as realistic as possible, we find that the simulated traffic is too "clean" and predictable in subtle ways that a good anomaly detection system could root out. This would explain some (but not all) of the attacks we detected earlier, and suggests that the false alarm rates we measured are unrealistically low.
In Chapter 8 we inject real network traffic into the IDEVAL data to better simulate a real environment. This raises the false alarm rate and masks the detection of attacks by artifacts, yielding more credible results, not just on our systems, but also on another network IDS, SPADE (Hoagland, 2000). We conclude that our systems could legitimately detect 20% to 40% of novel
attacks at false alarm rates of 10 to 50 per day, with a tradeoff between detection and false alarm rate. We believe this is an improvement over current methods.
In Chapter 9, we summarize our contributions and discuss limitations and future work. Our contribution is not to build a network anomaly IDS, but to describe the general principles by which one should be built and tested.
Chapter 2
Related Work
Our goal is to distinguish hostile network traffic from normal traffic. Thus, we review hostile traffic, normal traffic, current methods of distinguishing them, and how these methods are evaluated.
2.1. Network Vulnerabilities
There are thousands of known exploits. Kendall (1998) describes a taxonomy of attacks, grouping them into four major categories.
??? Probes ??? testing a potential target to gather information. These are usually harmless (and common) unless a vulnerability is discovered and later exploited.
??? Denial of service (DOS) ??? attacks which prevent normal operation, such as causing the target host or server to crash, or blocking network traffic.
??? Remote to local (R2L) ??? attacks in which an unauthorized user is able to bypass normal authentication and execute commands on the target.
??? User to root (U2R) ??? attacks in which a user with login access is able to bypass normal authentication to gain the privileges of another user, usually root.
We are interested in detecting the first three types, because they generally exploit network protocol implementations. U2R attacks exploit bugs or misconfigurations in the operating system, for example a buffer overflow or incorrectly set file permissions in a suid root program. The actions of
an attacker can be easily hidden from a network sniffer by launching the attack from the console or through a secure shell.
Kendall describes many of the attacks we will describe in this section. His analysis does not include self-replicating attacks such as worms or viruses, although they normally propagate by exploiting R2L vulnerabilities. They may also contain DOS attacks as payloads, for example, erasing all files on an infected computer on a certain date.
2.1.1. Probes
Probes gather information to search for vulnerable systems. For example:
??? IP sweep ??? testing a range of IP addresses with ping to determine which ones are alive (Kendall, 1998). Another way to gather a list of potential targets is to spoof a zone transfer request to a DNS server, as is done by the ls command in NSLOOKUP.
??? Port scans ??? testing for ports with listening servers. Tools such as NMAP (Fyodor, 2003) and HPING (Sanfilippo, 2003) use sophisticated techniques to make scans hard to detect, for example, scanning with RST or FIN packets (which are less likely to be logged), or using slow scans to defeat an intrusion detection system (IDS) looking for a burst of packets to a range of ports.
??? Fingerprinting ??? determining the operating system version of the target based on
idiosyncrasies in responses to unusual packets, such as TCP packets with the reserved flags set. This method, implemented by QUESO and NMAP, distinguishes among hundreds of operating system versions using only 7 packets (Fyodor,1998).
??? Vulnerability testing ??? Network administration tools such as SATAN (Farmer & Venema, 1993), SAINT (Kendall, 1998), MSCAN (Kendall, 1998), and NESSUS (Deraison, 2003) test for a wide range of vulnerabilities. These tools serve the dual purpose of allowing network administrators to quickly test their own systems for vulnerabilities, and allowing
attackers to test someone else's system. NESSUS is open source and uses a scripting language and has an extensive library of tests, which is updated as new vulnerabilities are discovered. As of February 2003, NESSUS tests for 1181 vulnerabilities.
??? Inside sniffing ??? An attacker with physical access to a broadcast medium such as Ethernet, cable TV, or wireless, could sniff traffic addressed to others on the local net. Many protocols such as telnet, FTP, POP3, IMAP, and SNMP transmit passwords unencrypted. Probes (other than sniffers) normally cannot use spoofed source IP addresses because they require a response back to the attacker. However there are a number of methods to make it harder to detect the true source, for example:
??? Sending large numbers of spoofed packets in addition to true source addresses, so that the victim will not know which address is the real probe.
??? Launching a probe from a compromised host. ??? Idle scanning through a zombie (Fyodor, 2002).
Idle scanning, a feature of NMAP, allows an attacker to conceal its address by exploiting any intermediate host (a zombie) that is lightly loaded and that yields predictable IP fragment ID values, as many operating systems do. For example, the ID may be incremented after each packet sent. The attacker probes the zombie on an open port (say, a web server on port 80) to get the current ID, then sends a TCP SYN packet to the target port to be probed, with the spoofed source address of the zombie. The source port is set to 80. The target responds to the zombie on port 80 either with a SYN-ACK packet if the port is open, or a RST if closed The zombie then replies (with a RST) to the target in case of a SYN-ACK (since no TCP connection was open), but does not respond to a RST from the target. The attacker then probes the zombie a second time to see whether the IP ID is incremented by one or two, thus learning whether the port is open or closed.
2.1.2. Denial of Service Attacks
Denial of service attacks can target a server, a host, or a network. These either flood the target with data to exhaust resources, or use malformed data to exploit a bug. Kendall (1998) gives the following examples, all of which are used in the IDEVAL test set.
??? Apache2 ??? Some versions of the apache web server will run out of memory and crash when sent a very long HTTP request. Kendall describes one version in which the line "User-Agent: sioux" is repeated 10,000 times.
??? Back ??? Some versions of apache consume excessive CPU and slow down when the requested URL contains many slashes, i.e. "GET /////////////..."
??? Land ??? SunOS 4.1 crashes when it receives a spoofed TCP SYN packet with the source address equal to the destination address.
??? Mailbomb ??? A user is flooded with mail messages.
??? SYN flood (Neptune) ??? A server is flooded with TCP SYN packets with forged source addresses. Because each pending connection requires saving some state information, the target TCP/IP stack can exhaust memory and refuse legitimate connections until the attack stops.
??? Ping of death ??? Many operating systems could be crashed (in 1996 when the exploit was discovered) by sending a fragmented IP packet that reassembles to 65,536 bytes, one byte larger than the maximum legal size. It is called "ping of death" because it could be launched from Windows 95 or NT with the command "ping ???l 65510 target".
??? Process table ??? An attacker opens a large number of connections to a service such as finger, POP3 or IMAP until the number of processes exceeds the limit. At this point no new processes can be created until the target is rebooted.
??? Smurf ??? An attacker floods the target network by sending ICMP ECHO REQUEST (ping) packets to a broadcast address (x.x.x.255) with the spoofed source address of the target. The target is then flooded with ECHO REPLY packets from multiple sources.
??? Syslogd ??? The syslog server, which could be used to log alarms remotely from an IDS, is crashed by sending a spoofed message with an invalid source IP address. Due to a bug, the server crashes when a reverse DNS lookup on the IP address fails.
??? Teardrop ??? Some operating systems (Windows 95, NT, and Linux up to 2.0.32) will crash when sent overlapping IP fragments in which the second packet is wholly contained inside the first. This exploits a bug in the TCP/IP stack implementation in which the C function
memcpy() is passed a negative length argument. The argument is interpreted as a very
large unsigned number, causing all of memory to be overwritten.
??? UDP storm ??? This attack sets up a network flood between two targets by sending a spoofed UDP packet to the echo server of one target with the spoofed source address and port number of the chargen server of the other target.
2.1.3. Remote to Local Attacks
While probes and DOS attacks may exploit TCP/IP protocols, R2L attacks always exploit application protocols to gain control over the target. Kendall describes several attacks, which can be grouped as follows:
??? Password guessing ??? Many users tend to choose weak or easily guessed passwords. An attack could try common passwords such as guest, the user name, or no password. If this fails, an attacker could use a script to exhaustively test every word in a dictionary. Any service requiring a password is vulnerable, for example, telnet, FTP, POP3, IMAP, or SSH. ??? Server vulnerability ??? An attacker exploits a software bug to execute commands on the
sendmail (SMTP), named (DNS), and imap. Other bugs may allow a command to be
unwittingly executed. For example, the PHF attack exploits a badly written CGI script installed by default on an old version of apache. The following HTTP command will retrieve the password file on a vulnerable server:
GET /cgi-bin/phf?Qalias=x%0a/usr/bin/ypcat%20passwd ??? Configuration error ??? An attacker exploits an unintended security hole, such as exporting
an NFS partition with world write privileges. One common error is setting up an open X server (using the command xhost +) when running a remote X application. The xlock attack scans for open X servers, then displays a fake screensaver which prompts the user to enter a password, which is then captured. xsnoop does not display anything; it merely captures keystrokes.
??? Backdoors ??? Once a host has been compromised, the attacker will usually modify the target to make it easier to break in again. One method is to run a server such as netcat, which can listen for commands on any port and execute them (Armstrong, 2001).
2.1.4. Attacks on the Intrusion Detection System
It is reasonable to expect that if a system is running an IDS, then the IDS might be attacked. This could either be an evasion, such as port scanning with FIN or RST packets, which are less likely to be logged, or a denial of service attack such as syslogd.
Ptacek and Newsham (1998) and Horizon (1998) contend that it is not possible for a network sniffer to see exactly the same traffic as the target without an impractical level of knowledge about the target environment. For example, if two TCP segments overlap with
inconsistent data, some operating systems will use the first packet, and others will use the second. If the IDS is unaware of which method is used, then an attacker could exploit this to present innocuous data to the IDS while presenting hostile data to the target. Another technique would be to use short
TCP checksums, then an attacker could present the IDS with innocuous packets with bad checksums that would be dropped by the target. Many other exploits could exist, depending on how accurately the IDS implements the TCP/IP protocols. Many do so poorly. Ptacek and Newsham found that out of four commercial systems that they tested, all were vulnerable to some of these attacks, and furthermore, none could properly reassemble fragmented IP packets.
Newman et al (2002) tested one open source and seven commercial network intrusion detection systems costing $2500 to $25,000 on a high speed (100 Mbs.) network Most systems flooded the user with false alarms. Seven of the eight systems crashed at least once during their 31 day test period, often because the logs filled up. This study suggests that many intrusion detection systems would be easy targets of flooding attacks.
Even if the IDS properly reassembled IP packets and TCP streams (handling checksums, retransmissions, timeouts, invalid TCP flags, etc. correctly), it is still possible to elude detection by making small changes to the attack. Consider the PHF attack described in Section 2.1.3. An IDS might detect this by searching for the string "GET /cgi-bin/phf?" or something similar. NESSUS employs a number of features to evade simple string matching, such as the following.
??? URL encoding ??? replacing characters with %XX, e.g. "GET %2F%63%69..." ??? Modifying the path, e.g. "GET /foo/../cgi-bin/phf?" or "GET "/cgi-bin/./phf?"
??? Replacing spaces with tabs, e.g. "GET<tab>/cgi-bin/phf?". This syntax is nonstandard, but accepted by the target web server.
Thus, it seems that an IDS must not only fully model the IP and TCP protocols of the hosts it protects, with all their idiosyncrasies and bugs, but also application protocols as well. If it does not, then a determined attacker could find a way to evade it.
2.2. Properties of Network Traffic
A network intrusion detection must distinguish between hostile and benign traffic, and must do so quickly to keep up with a high speed network. Depending on whether the IDS uses signature or anomaly detection, it must either model attacks (of which there are thousands) or normal traffic. There are two main challenges for modeling normal traffic (for anomaly detection). First, network traffic is very complex, and second, the model changes over time.
Many internet protocols are described in the Request for Comments (RFC), a set of documents dating back to 1969, which can be found at www.ietf.org. As of Feb. 14, 2003, there were 3317 documents totaling 147 megabytes of text. The set is growing at a rate of about 250 new documents per year. However, the documentation describes how protocols should behave, not how the thousands of different clients and server versions actually implement them, with all their idiosyncrasies and bugs. Nor do the RFCs cover every protocol. Some protocols may be proprietary and not documented anywhere.
Bellovin (1993) and Paxson (1998) found that wide area network traffic contains a wide range of anomalies and bizarre data that is not easily explained. Paxson refers to this unexplained data as "crud". Examples include private IP addresses, storms of packets routed in a loop until their TTLs expire, TCP acknowledgments of packets never sent, TCP retransmissions with inconsistent payloads, SYN packets with urgent data, and so on. Bellovin found broadcast packets
(255.255.255.255) from foreign sites, ICMP packets with invalid code fields, and packets addressed to nonexistent hosts and ports. Many of these were investigated and found to be not hostile. Instead, many errors were caused by misconfigured routers or DNS servers.
Rather than try to specify the extremely complex behavior of network traffic, one could instead use a machine learning approach to model traffic as it is actually seen. For example, an IDS could be trained to recognize the client addresses that normally access a particular server by observing it over some training period. Unfortunately, research by Adamic (2002) and Huberman
and Adamic (1999) suggest that this approach would fail for some attributes (such as client
addresses) because the list of observed values would grow at a constant rate and never be completed no matter how long the training period. Adamic found that the distribution of Internet domains accessed by a large number of HTTP clients (web browsers) has a power law or Pareto distribution, where the r'th most frequent value occurs with frequency cr-1/ k, where c and k are a constants and k is usually close to 1 (in this case, 1.07). When k = 1, the r'th most frequent value occurs with frequency proportional to 1/r. Zipf (1939) observed this behavior in the distribution of word frequencies in English and several other languages (with c
. Since then, power law
distributions have been observed in many natural phenomena such as city populations or incomes (Mitzenmacher 2001), and CPU memory accesses (Stone, 1993). We found that many attributes of network traffic collected on a university departmental server have Zipf-like distributions, for example, HTTP and SSH client versions and client addresses in TCP connections (Mahoney & Chan, 2003).
The problem with a power law distributed random variable is it implies that the "normal" set of values cannot be learned no matter how long the observation period. If we make n
observations of a Zipf-distributed random variable and observe r distinct values, then the expected number of values occurring exactly once (denoted r1) is r/2. By Good-Turing (Gale & Sampson,
1995), the probability that the next value of any discrete random variable will be novel is E[r1]/n,
which for a Zipf variable is estimated by r/2n. This implies that r (the size of the vocabulary to be learned) grows without bound. A similar argument can be made for power law distributions where k is not exactly 1.
A confounding problem in traffic modeling is that it is not possible to determine the average rate of many types of events (for example, bytes per second or packets per second for some packet type), regardless of the duration of the sampling period. It had long been assumed that network traffic could be modeled by a Poisson process, in which events are independent of each other. If we measured packet rates, for example, we would find random variations over small time
windows (e.g. packets per second), but these would tend to average out over longer periods (e.g. packets per month).
However, Leland et al. (1993) and Paxson & Floyd (1995) showed that this is not the case for many types of events. If we graphed packets per second or packets per month, they would both show bursts of high traffic rates separated by gaps of low activity. Furthermore, both graphs would look the same. A burst or gap could last for a fraction of a second or for months. The distribution of traffic rates would be independent of time scale. This behavior is a property of self-similar or fractal processes. Leland et al. formalizes the notion of a self-similar process as follows.
??? Long range dependency. (For a Poisson process, events separated by a long time interval are independent).
??? A nonsummable autocorrelation correlation, such as 1/t. For a Poisson process, the autocorrelation decays exponentially, e.g. e-t/T for some time constant T.
??? A Hurst parameter greater than 0.5.
The Hurst parameter characterizes the self-similarity of a process. It is defined as the rate at which the sample standard deviation of an aggregate process decreases as the aggregate size increases. For example, the aggregate size increases by a factor of M = 60 when going from packets per second to packets per minute. If the sample standard deviation of this process decreases by a factor of M1-H, then the process is said to have a Hurst parameter of H. For a Poisson process, H = 0.5. For a purely self-similar process, H = 1. Leland et al. measured H in the range 0.7 to 0.9 for Ethernet packet rates and byte rates on networks of various sizes, with higher values of H when traffic rates were higher.
These results suggest that for some attributes it is impossible to either learn the full set of possible values of an attribute, or the average rate at which any individual value should be observed. Fortunately all is not lost. Paxson and Floyd found that some events, such as session interarrival times, can be modeled by a Poisson processes. Processes may also have predictable time-dependent
behavior. For example, traffic rates are higher during the day than at night. Also, not all attributes have power law distributions, and it may be possible to distinguish these attributes from the others.
2.3. Intrusion Detection
Intrusion detection systems can be categorized along three dimensions.
??? Host or network based ??? A host based system monitors operating system events and the file system to detect unauthorized use (viruses, R2L or U2R attacks). A network based IDS monitors network traffic to and from one or more hosts to detect remote attacks (usually probes, DOS, or R2L).
??? Signature or anomaly detection ??? A signature (or misuse) detection system searches for patterns or events signaling known attacks. An anomaly detection system signals a possible novel attack in the case of events that differ from a model of normal behavior. ??? Hand coded or machine learning ??? A hand coded system requires the user to specify rules
for normal behavior or specific attacks. A machine learning system generalizes from training data, which is either normal or contains labeled attacks.
For example, a virus detection program is host based (it examines files on the computer on which it runs), uses signature detection (pattern matching for known viruses), and is hand coded (using vendor-updated virus definition files). The subject of this dissertation is the exact opposite: network anomaly detection using machine learning to generalize from normal traffic. These methods differ in the types of attacks they detect (U2R or probe, known or novel). A good system will combine different techniques to increase coverage.
2.3.1. Machine Learning
Some intrusion detection systems use machine learning to model attacks (signature detection) or normal behavior (anomaly detection). The general problem of machine learning is
described in (Mitchell, 1997). We are given a set of instances (e.g. network packets or user sessions), some of which have category labels (e.g. normal or hostile). The problem is to assign labels to the remaining instances. In general, an instance is a set of attribute-value pairs (e.g. {port = 80, duration = 2.3 sec.}). An attribute is said to be nominal if the values are unordered. For
example, port numbers are nominal because port 80 (HTTP) and 79 (finger) are no more related to each other than they are to port 21 (telnet), numeric values notwithstanding. An attribute with ordered values (such as duration) is continuous. In general, an instance can be represented as a vector of continuous values by assigning elements with values 0 or 1 to each nominal value, e.g. (port21 = 0, port79 = 0, port80 = 1, duration = 2.3).
Machine learning can be applied to either signature or anomaly detection. If we are given training instances labeled both normal and hostile (or labeled with the type of attack), then we are using signature detection. Such data is difficult to obtain. More commonly, we label all traffic as normal (perhaps incorrectly). In this case, any instance far outside the training set is assumed to be hostile. This is the basis of anomaly detection.
The following is a summary of some common machine learning algorithms. There are many others.
??? Memorization ??? We categorize test instances by finding a matching training instance. If no exact match is found (a common problem), then this method fails (or we assume an anomaly).
??? Nearest neighbor ??? We define a distance function between instances, perhaps Euclidean distance between vectors. A test instance is assigned the same category as its nearest neighbors from the training set. If a test instance has no nearby neighbors, it is anomalous. ??? Naive Bayes ??? We use the training data to estimate a set of probabilities, P(category |
attribute = value) for each category and each attribute. We then estimate the probability of the category of a test instance by taking the product of the probabilities for each attribute,
This approach is called naive because we are assuming that the attributes are independent. However this method often works well even when they are not.
??? Neural networks ??? We assign an input neuron (a model of a brain cell) to each vector element and an output neuron to each category. These neurons and possibly other intermediate neurons are connected by weights, w. Given an instance, x, we compute the relative probability yi that the category is i by yi = g(??j wij xj), where g is a bounding
function that limits the output to the range 0 to 1. The network is trained by incrementally adjusting the weights wij to correctly categorize the training set, i.e. yi = 1 if the category is
i, and 0 otherwise. By adding intermediate neurons, nonlinear functions of the input can be
learned.
??? Decision Tree ??? A nested set of if-then-else rules are constructed of the form "if attribute < value then ...". These rules form a tree, where the leaf nodes specify a distribution of categories, e.g. "P(hostile) = 2%". A tree is constructed recursively using a greedy
algorithm by finding the rule that maximizes the separation of categories (information gain) on the portion of the training set at each node.
??? RIPPER (Cohen, 1995) finds a rule sequence of the form "if ... then ... else if ... then ... else if ..." to assign categories to a training set. A condition may be a combination of attributes, such as "if port = 80 and duration > 100 sec. then category = hostile, else if ...". It uses a greedy algorithm so that the first few tests apply to most of the training instances, and extends the rule until no more training instances can be categorized.
??? APRIORI (Agrawal & Srikant, 1994) finds association rules. It makes no distinction between the category and other attributes. Given a training set, it allows any attribute to serve as the label and finds if-then rules that predict it based on other attributes. APRIORI is useful for market basket analysis. For example, does port number predict duration, or does duration predict port number?
2.3.2. Network Signature Detection
We review a representative sample of intrusion detection systems. For a more complete survey, see (Axelsson, 1999).
Network intrusion detection is usually rule based, although the rules may specify the behavior of an attack (signature detection) or rules that specify acceptable traffic (strict anomaly detection). For example, the user could specify that packets addressed to unused ports are not allowed, and list those ports. SNORT (Roesch, 1999) and Bro (Paxson, 1998) are two such systems. Both systems allow rules to be specified using scripts. For example, the SNORT distribution includes the following rule to detect PHF by searching for the string "/phf" in TCP data packets addressed to the normal HTTP port.
alert tcp $EXTERNAL_NET any -> $HOME_NET 80 (msg:"IDS128 - CVE-1999-0067 - CGI phf attempt";flags:PA; content:"/phf";flags:AP; nocase;)
Other rule-based systems are components of larger systems that also use host based methods. These include P-BEST (Lindquist & Porras, 1999), which is one component of EMERALD (Newmann & Porras, 1999), and NetSTAT (Vigna & Kemmerer, 1999), which is a component of the STAT suite (Vigna et al., 2000).
2.3.3. Host Based Anomaly Detection
Many of the early anomaly detection systems surveyed by Axelsson (1999) model user behavior, for example, client IP addresses and normal login times. A login from an unusual address or at an unusual time of day would be deemed suspicious. Rules could either be learned or
programmed.
DERBI (Tyson et al., 2000) is a file system integrity checker designed to detect signs of an intrusion, such as a backdoor. It can be considered an anomaly detection system in the sense that normal behavior is defined such that operating system files should never be modified.
Forrest et al. (1996) uses the analogy of a computer immune system to apply anomaly detection to program behavior in a host-based system by monitoring operating system calls. It was found that servers and operating system components make predictable sequences of operating system calls. When a programs is compromised in an R2L or U2R attack (for example, a buffer overflow), it executes code supplied by the attacker and deviates from the system call sequences observed during training. Forrest et al. used a type of nearest-neighbor approach: an n-gram model with n = 3 to 6 and would signal an anomaly if a program made a sequence of n calls not observed in training.
Other models are possible. For example, Ghosh and Schwartzbard (1999) trained a neural network with delayed feedback (an Elman network) on system calls to generalize from normal sequences. Schwartzbard and Ghosh (1999) also applied this technique to Windows NT audit logs. The neural networks were trained by labeling attack-free data as normal and by generating random training data labeled as hostile.
NIDES (Anderson et al., 1999) compares short and long term program behavior by comparing vectors of host-based attributes, such as number of files open, CPU time, and so on. The short term behavior (a single event or a small time window) represents the test instance, and the long term behavior (a large time window) represents the training model. As with most practical systems where guaranteed attack-free training data is not available, we just make the assumption that most of the data observed so far is attack free. Obviously if there are attacks in the training data, then repeat attacks of the same type are likely to be missed.
2.3.4. Network Anomaly Detection
Network anomaly detection systems usually monitor IP addresses, ports, TCP state information, and other attributes to identify network sessions or TCP connections that differ from a profile trained on attack free traffic. They are usually combined with signature detectors as components in larger systems.
SPADE (Hoagland, 2000), a SNORT plug-in, is an anomaly detection system which monitors addresses and ports of inbound TCP SYN packets (normally the first packet in a client-server session). By default, it models only the destination (client-server) address and port, and constructs a joint probability model by counting address/port combinations: P(address, port) = count(address, port) / count(all). If the current packet (included in the counts) has a probability below a threshold, it is deemed anomalous, and an alarm is generated. The threshold is varied slowly in order to keep the alarm rate constant. SPADE also has probability modes that include the source address and port. Unusual source addresses on servers that accept only a small list of trusted clients might indicate an unauthorized user.
ADAM (Barbara et al., 2001a; Barbara et al., 2001b) combines an anomaly detector trained on attack-free traffic with a classifier trained on traffic containing known, labeled attacks. Like SPADE, it monitors TCP connections. In addition to addresses and ports, ADAM also monitors subnets (the first 1-3 bytes of a 4-byte IP address), TCP state flags, the day of the week, and time of day. The anomaly detection component performs offline market basket analysis on attack-free traffic using techniques similar to RIPPER or APRIORI to find conditional rules among these attributes with high support and confidence. During testing, sessions which violate these rules are passed to the second component, a classifier (a decision tree) trained on traffic containing labeled attacks. Sessions which cannot be confidently classified as known attacks or normal are classified as unknown attacks.
eBayes (Valdes & Skinner, 2000), a component of EMERALD (Newmann & Porras, 1999) measures several attributes of a session, such as event intensity, error intensity, number of open connections, number of ports, number of addresses, and distributions of services and connection codes. Unlike SPADE and ADAM, eBayes considers a group of TCP connections within a short interval to be a single session. eBayes maintains a set of probability models, P(attribute = value | category) and uses naive Bayesian inference to assign a category to a session based on the observed attributes, which are assumed to be independent. Like ADAM, categories correspond to known
attacks, normal behavior, and a category for unknown attacks (which requires training data with labeled attacks). Unlike ADAM, eBayes adapts during the test phase in two ways. First, the probabilities are slowly adjusted to reinforce the most likely category, and second, there is a mechanism to automatically add new categories when there is not a good match between the observed values and existing categories.
2.4. Intrusion Detection Evaluation
Ideally an IDS should be evaluated on a real network and tested with real attacks.
Unfortunately it is difficult to repeat such tests so that other researchers can replicate the evaluation. To do that, the network traffic would have to be captured and reused. This raises privacy concerns, because real traffic can contain sensitive information such as email messages and passwords. Thus, network traffic archives such as ITA (Paxson, 2002), and the University of New Mexico data set (Forrest, 2002) are sanitized by removing the application payload and some packet header fields, and scrambling IP addresses.
The DARPA/Lincoln Laboratory IDS evaluation (IDEVAL) data sets (Lippmann et al., 2000; Lippmann & Haines, 2000) overcome this difficulty by using synthetic background traffic. The goal of this project was twofold. First, the goal was to test a wide variety of systems (host or network, signature or anomaly, four different operating systems) on a wide range of attacks. The second goal was to provide off-line data to encourage development of new systems and algorithms by publishing a standard benchmark so that researchers could compare systems and replicate results. Evaluations were conducted in 1998 and 1999. The 1999 evaluation improved on the 1998 evaluation by simplifying the scoring procedure, providing attack-free data to train anomaly detection systems, adding many new attacks, and one new target (Windows NT) to the three UNIX-based targets in 1998.
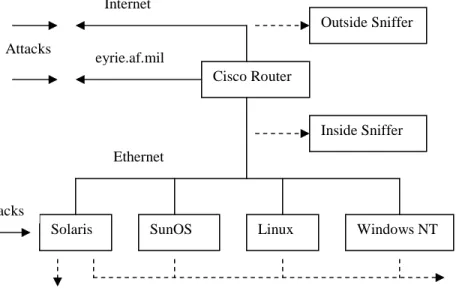
Figure 2.1. The 1999 DARPA/Lincoln Laboratory IDS Evaluation Test Configuration
Figure 2.1 shows the configuration of the 1999 evaluation test bed. A local area network is set up to resemble a portion of a typical Air Force base network. There are four main "victim" machines, running SunOS, Solaris, Linux, and Windows NT. Traffic generators simulate hundreds of other hosts and users running various applications and an Internet connection (Haines et al., 2001). The mix of protocols (HTTP, SMTP, telnet, etc.) and hourly variations in traffic volume are similar to traffic collected on a real Air Force network in 1998. Content is taken from public web sites and mailing lists, or synthesized using English word bigram frequencies.
The evaluation data set is collected from the four victim machines and from two network sniffers, an "inside" sniffer between the router and the victims, and an "outside" sniffer between the router and the Internet. The host based data consists of audit logs and nightly file system dumps and directory listings, in addition to Solaris Basic Security Module (BSM) system call traces. This data
Solaris SunOS Linux Windows NT
Cisco Router
Inside Sniffer Outside Sniffer
Ethernet Internet
BSM Audit logs, daily file system dumps and directory listings eyrie.af.mil
Attacks
is analyzed off-line to detect attacks. Attacks may originate from either the Internet, from
compromised hosts on the local network, or from attackers who have physical access to the victims or the local network. Most attacks are against the four main victim machines, but some are against the network, the Cisco router, or against simulated hosts on the local network.
The 1999 evaluation had two phases separated by about three months. During the first phase, participants were provided with three weeks of data (collected Monday through Friday, 8:00 AM to 6:00 AM local time each day). The second week of data contained 43 labeled instances of 18 attacks which were taken from the Bugtraq mailing list, from published sources such as www.rootshell.com, or which were developed for the evaluation. Many of these attacks are described in Section 2.1. Attacks were sometimes made stealthy or hard to detect, for example, by slowing down a port scan or obfuscating suspicious shell commands. Attacks were labeled with the start time and the name of the victim. The first and third weeks contained no attacks, and could be used to train anomaly detection systems.
During the second phase, participants were provided with two weeks of test data (weeks 4 and 5) containing 201 unlabeled instances of 58 attacks, 40 of which were not in the training data. Participants were required to provide a list of alarms identifying the target address, time, and a numerical score indicating a confidence level in the alarm, and optionally, the type of attack. Participants also provided a system specification which describes the types of attacks their system is designed to detect. Attacks are classified by category (probe, DOS, R2L, U2R), the type of data examined (inside sniffer, outside sniffer, BSM, audit logs, file system dumps, or directory listings), victim operating system (SunOS, Solaris, Linux, or NT), and whether the attack is new (not in week 2). Systems are evaluated by the fraction of attacks detected out of those they are designed to detect at various false alarm rates (say, 10 per day, or 100 total) by ranking the alarms by score and discarding those which fall below a threshold that would allow more false alarms. An attack is counted as detected if there is an alarm with a score above the threshold that identifies the victim address (or any address if there is more than one) and the time of any portion of the attack with 60
seconds leeway before the start of the attack or after the end. Alarms that detect attacks that the system is not designed to detect (out of spec attacks), and duplicate alarms detecting the same attack are discarded without penalty. Any other alarm is considered a false alarm.
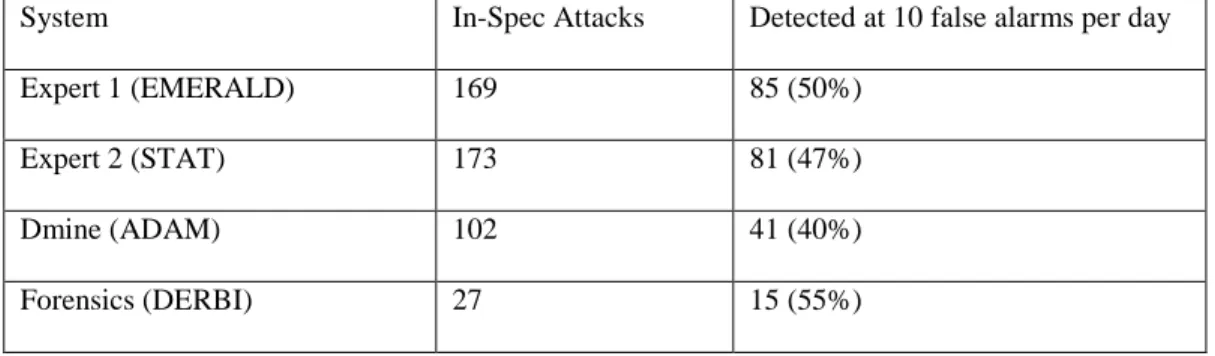
Eight organizations participated in the 1999 evaluation, submitting 18 systems. The top four systems reported by (Lippmann et al., 2000) are shown in Table 2.1. The best systems detected about half of the attacks they were designed to detect at a false alarm rate of 10 per day. Subsequent to the evaluation, the five weeks of training and test data were released to encourage research in intrusion detection. The data and truth labels are available at http://www.ll.mit.edu/IST/ideval/.
System In-Spec Attacks Detected at 10 false alarms per day
Expert 1 (EMERALD) 169 85 (50%)
Expert 2 (STAT) 173 81 (47%)
Dmine (ADAM) 102 41 (40%)
Forensics (DERBI) 27 15 (55%)
Table 2.1. Top results in the 1999 IDS evaluation (Lippmann et al., 2000)
Of the 58 attack types, there were 21 that were classified as poorly detected. None of the 18 systems detected more than half of the instances of any of these attacks. Often these were missed because the systems did not monitor the relevant protocols or because they were new attacks not found in the labeled training data. The attacks are as follows:
??? Stealthy ipsweep (probe, slow ECHO REQUEST scan for active IP addresses). ??? Stealthy portsweep (probe, slow port scan, or using stealthy techniques such as FIN
scanning).
??? queso (probe, operating system fingerprinting using malformed TCP packets).
??? resetscan (probe, port scan using unsolicited RST packets).
??? arppoison (DOS, disrupting local traffic by forging replies to ARP-WHO-HAS packets).
??? dosnuke (DOS, crashes Windows by sending urgent data in a NetBIOS request).
??? selfping (DOS, crashes SunOS by sending an ICMP ECHO REQUEST to self).
??? tcpreset (DOS, disrupts local traffic by forging RST packets to close TCP connections).
??? warezclient (DOS, downloading illegal software from a local anonymous FTP server).
??? ncftp (R2L, FTP client bug exploit).
??? netbus (R2L, a backdoor server).
??? netcat (R2L, another backdoor, uses a stealthy DNS channel).
??? snmpget (R2L, exploits an easily guessed router password).
??? sshtrojan (R2L, fake SSH server upgrade with login backdoor).
??? loadmodule (U2R, exploits a trojan shared library to gain root).
??? ntfsdos (U2R, an attacker with console access copies the disk, bypassing file system
protection).
??? perl (U2R, exploits a bug in a setuid root Perl script).
??? sechole (U2R, exploits a bug in Windows NT).
??? sqlattack (U2R, a restricted user escapes from a database application to the UNIX shell).
??? xterm (U2R, gains root using a buffer overflow).
Chapter 3
Time-Based Protocol Modeling
This chapter introduces PHAD (Mahoney & Chan, 2001), a Packet Header Anomaly Detector. PHAD is unusual in two respects among network anomaly detection systems. First, it models protocols rather than user behavior, because many attacks exploit errors in protocol implementations that can be detected by unusual inputs or outputs. Second, it uses a time-based model, which assumes that network statistics can change rapidly in a short period of time. When PHAD sees a burst of unusual events, only the first event of that burst ought to be surprising and reported as an anomaly. This cuts down on false alarm floods.3.1. Protocol Modeling
Most network anomaly detection systems are designed (perhaps implicitly) to distinguish authorized and unauthorized users. For example, an authorized user would know the environment and not attempt to contact nonexistent hosts or services as a port scan would. Also, servers requiring passwords (telnet, FTP, POP3, etc.) would have a regular set of authorized clients that could be identified by their source IP addresses, and perhaps other idiosyncrasies, such as time of day. Thus, unusual source addresses on these services would hint at unauthorized access. These methods are quite distinct from host based techniques that model program behavior. Forrest uses the model of an immune system to detect when a vulnerable server or operating system component is executing code that was not part of the original program, such as a root shell in a buffer overflow attack. Because program code does not change over time, programs tend to make characteristic
sequences of operating system calls. Any novel code executed by these processes is likely to result in sequences that deviate from this pattern.
Program modeling could be used in a network intrusion detection system by monitoring the output of vulnerable servers. Like system call sequences, we would expect a program's output to deviate from normal behavior when it executes novel code. For example, it would be unusual to see a root shell prompt coming from a mail server, as during a sendmail buffer overflow attack. Such an attack could not be caught by user modeling, because no unusual ports or addresses are accessed and mail servers will accept any client address without authentication.
Another approach is protocol modeling. In section 2.1, we saw that many attacks exploit bugs in protocol implementations. For example, sendmail, imap, and named exploit improper implementation of SMTP, IMAP, and DNS, in which the length of the input is not checked in some cases. Teardrop and ping of death exploit bad implementations of IP protocol, such that the target crashes when presented with unusual IP fragments that do not reassemble properly. Queso is able to identify some operating system versions because of bugs in their TCP implementations which cause them to give nonstandard responses to unusual data, such as TCP packets with the reserved flags set. A common theme of such attacks is that the input is unusual in some sense. There is a reason for this. If the error could be invoked by commonly occurring data, then the bug would have been quickly discovered and fixed.
Another source of protocol anomalies could come from bugs in the attacking code. Just as it is hard for the developer of a server or client and get all the details of a protocol right, it is hard for the attacker too. For example, attacks that spoofs the source address have to be programmed at the IP level using a technique such as raw sockets. This requires the attacker to fill in all of the other IP header fields, such as TTL, header length, checksum, fragmentation pointer, and so on. It is hard to get this right. Not only must the packet satisfy the protocol requirements, but if it is to elude detection, it must also duplicate the idiosyncrasies of the protocols in the target environment. For example, many operating systems generate predictable sequences of IP fragment ID numbers or
TCP initial sequence numbers (a fact exploited by attacks such as queso). The same reasoning applies to application protocols. For example, a normal SMTP session starts with a HELO/EHLO handshake. It is not required for an attack like sendmail, but if it was omitted, the attack could be detected.
A third source of protocol anomalies could come from attacks on the IDS. Many of the IDS vulnerabilities described in Section 2.1.4 are the result of differences in the IDS's and the target's implementation of TCP/IP. Because of the nature of software testing, differences exposed by the most common cases will be discovered and fixed first. Any remaining inconsistencies will only be exposed by rare events, such as small TTL values, IP fragmentation, inconsistent
overlapping TCP segments, and so on.
To summarize, there are five potential ways to detect attacks.
1. Unusual ports and addresses, signs of an unauthorized user (traditional model). 2. Unusual outputs, signs of a successful attack.
3. Unusual inputs that exploit hidden bugs in the target. 4. Unusual inputs due to bugs in the attacking code. 5. Unusual inputs to exploit hidden bugs in the IDS.
3.2. Time Based Modeling
In Section 2.2 we saw that many types of network events occur in bursts separated by gaps, over both short and long time scales. Many network processes tend to be self-similar or fractal rather than Poisson, and to have a nonsummable autocorrelation function such as 1/t (where t is time). Events separated by long time intervals are not independent, as in a Poisson model. Instead there is a long range dependency.
Anomaly detection is the identification of rare events. In a frequency-based model, the average rate of events is estimated by counting the number of events and dividing by the
observation period. This is a poor way to model a bursty process because there is no average rate. For example, consider the following (bursty) sequence of 20 observations of an attribute:
00000000000000001111. What is the probability that the next observation will be a 1? If we assume that each event is independent, then 1 occurs 4 out of 20 times, so P(1) = 4/20 = 0.2. However, if the events were independent, it is unlikely that all the "0"s and "1"s would be grouped as they are. (This type of pattern is common in network traffic). Such a sequence is more likely to originate from a process that has a state. At a minimum, the state might represent the previous output, such that the next output repeats with high probability. Without knowing more about the underlying process, we can propose the following model, which we will call the 1/t model: the probability of an event is inversely proportional to the time since it last occurred. The last observation of a "0" occurred 5 time