Human Behaviour in Design’05
Preprints of the International Workshop on Human Behaviour in Design’05 Grand Hyatt Hotel, Melbourne, Australia 15 August 2005
edited by John S Gero Udo Lindemann
International Workshop on Human Behaviour in Design’05 Grand Hyatt Hotel, Melbourne, Australia
15 August 2005 ISBN 1 86487 740 5
2005
PUBLISHED BY
Key Centre of Design Computing and Cognition University of Sydney NSW 2006 Australia Email: [email protected]
INTERNATIONAL COMMITTEE
Lucienne Blessing, Technical University of Berlin, Germany Nathalie Bonnardel, University of Provence, France Maolin Chiu, National Cheng-Kung University, Taiwan Gabi Goldschmidt, Technion University of Technology, Israel Koichi Hori, University of Tokyo, Japan
Bryan Lawson, University of Sheffield, United Kingdom Larry Leifer, Stanford University, United States Masaki Suwa, Chukyo University, Japan Hsien-Hui Tang, Chang Gung University, Taiwan Barbara Tversky, Stanford University, United States Willemien Visser, INRIA, France
Preface
SESSION ONE 1
Comparing collaborative design behavior in remote sketching and 3D virtual worlds
Mary Lou Maher, Zafer Bilda and David Marchant
3
On social dynamics factors in multi-stakeholder decision making in the early stage of product development
Ping Ge and Ping-Hung Hsieh
27
Design behaviour measurement by quantifying linkography in protocol studies of designing
Jeff WT Kan and John S Gero
47
Multi-level studies of design ideation components
Jami J Shah, Steve M Smith and Noe Vargas-Hernandez
59
SESSION TWO 67
Using functional linguistics to analyse a ‘conceptual journey’
Nora Shaheed and Andy Dong
69 Comparison of designers using a tangible user interface and a graphical user interface and the impact on spatial
Mi Jeong Kim and Mary Lou Maher
81
Using Wikis and Weblogs to support reflective learning in an introductory engineering design course
Helen L Chen, David Cannon, Jonathan Gabrio, Larry Leifer, George Toye and Tori Bailey
95
CONTACT AUTHORS EMAIL ADDRESSES 107
PREFACE
Engineering design has become an increasing research focus as we try to understand design in order to improve it. This is the domain of the field of design science. Research in design science can be carried out using two primary paradigms. One, design computing, uses hypotheses about design processes, constructs computational models of them and carries out empirical studies on those computational models. The other, design cognition, uses concepts from cognitive science and carries out empirical studies using human designers. Much of the current research in design science focuses on positing and developing computational models of designing. There is surprisingly little research in the area of design cognition: studying humans designing. This workshop aims at addressing this latter area.
Studying human designers can be carried out in many ways ranging from experiments in laboratories with individual designers, experiments in laboratories with design teams, to in-situ studies of individuals and teams. The experiments can be concerned with elaborating aspects of the acts of designing or of changing the design environment. The latter is generally concerned with the introduction of various forms of computational and communication technologies. Many of these are represented in the papers in this volume.
This workshop is organised as part of the Design Society’s Special Interest Group on Human Behaviour in Design. It aims to provide a forum for both the presentation and discussion of cutting-edge and ongoing research into human behaviour in designing. It follows on from an earlier workshop at DESIGN 2004 in Dubrovnik.
This volume presents the preprints of the International Workshop on Human Behaviour in Designing’05. The workshop is held as part of the International Conference on Engineering Design, ICED’05, held in Melbourne, Australia. The papers address questions of designing spanning disciplines and spanning the globe. The papers were selected from the submissions by two referees.
The support of the Key Centre of Design Computing and Cognition of the University of Sydney in organizing this workshop is gratefully acknowledged. Mercèdes Paulini worked hard to produce a coherently formatted volume.
John S Gero Sydney July 2005
SESSION ONE Comparing collaborative design behavior in remote sketching and 3D virtual worlds
Mary Lou Maher, Zafer Bilda and David Marchant On social dynamics factors in multi-stakeholder decision making in the early
stage of product development Ping Ge and Ping-Hung Hsieh Design behaviour measurement by quantifying linkography in protocol studies of designing Jeff WT Kan and John S Gero Multi-level studies of design ideation components Jami J Shah, Steve M Smith and Noe Vargas-Hernandez
COMPARING COLLABORATIVE DESIGN BEHAVIOR IN REMOTE SKETCHING AND 3D VIRTUAL WORLDS
MARY LOU MAHER, ZAFER BILDA University of Sydney, Australia
and
DAVID MARCHANT Woods Bagot, Australia
Abstract. The aim of this study is to compare two architects’ collaborative design behaviour while using a shared whiteboard application in one design session and a 3D virtual world in a second design session. Our preliminary analysis shows that designers spend more time discussing design ideas while sketching and more time creating the design model and inspecting spatial relationships while in a 3D virtual world.
1. Introduction
Recent developments in networked 3D virtual worlds and the proliferation of high bandwidth communications technology have the potential to transform the nature of distance collaboration in professional design. There have been numerous developments in systems that support collaboration that have resulted in system architectures to support information sharing and remote communication. Whilst these initiatives have led to important advances in the enabling technologies required to support changes in global economic practices, there remains a gap in our understanding of the impact of the technologies on the working practices of the people who are the primary users of such systems.
Research into the characteristics of collaborative work can assist in our understanding of how the collaborative design process can be supported and how new technologies can be introduced into the workplace. An understanding of collaborative design includes such factors as the role that communication media play, the use of physical materials, and computer tools and the way people communicate verbally and non verbally. Only by
gathering information about the rich and complex picture of collaborative design can we understand the characteristics and needs of the practitioners involved as well as those factors which contribute to their professional effectiveness.
2. Team collaboration in high bandwidth environments
The comparison presented in this paper is part of a larger study funded by the CRC for Construction Innovation in Australia1. In studying the impact of high bandwidth environments on design collaboration, an experimental study with 3 design settings was developed:
1. A collaborative design process in which designers work face to face with their current design and communication tools.
2. A collaborative design process in which designers use a shared drawing system with synchronous voice and video conference.
3. A collaborative design process in which a 3D virtual world is used in addition synchronous voice and video conference.
The reason for including the first setting is to understand the nature of the collaboration process as it takes place using traditional methods and without digital systems for designing and communicating. The study has been carried out over three months using an open ended exploratory approach into gathering data on existing design practice.
This paper presents an analysis of the data collected from the 2nd and 3rd
settings, comparing two architects’ collaborative design processes while using a shared whiteboard application and while using a 3D virtual world on a desktop computer. The two collaborative environments were selected as representative of current low-bandwidth technology (Net Meeting) and a prototype of high-bandwidth technology (extended Active Worlds). The paper begins with a summary of relevant methodologies and studies, and then the experiment design and data collection methods are described. Finally, protocol analysis of the design sessions and the results are presented.
3. Background
There are many studies that reveal the nature of design thinking and the characteristics of early conceptual design as distinct from detailed or embodiment design. The results of those studies can assist in our understanding of how the processes of design can be supported and how new technologies can be introduced into the workplace (Munkvold 2003).
Protocol analysis has been accepted as a prevailing research technique allowing elucidation of design processes in designing (Cross et al. 1996).
And whilst the earlier studies dealt mainly with protocols’ verbal aspects (Akin 1986), later studies acknowledge the importance of design drawing (Akin and Lin, 1995), associating it with design thinking which can be interpreted through verbal descriptions (Suwa and Tversky 1997; Suwa et al. 1998; Stempfle and Schaub 2002).
The protocol analysis technique has been adopted to understand the creative nature of collaborative design (Cross 1997), the design behavior of teams in terms of coherent idea production (Goldschmidt 1996; Van der Lugt 2003), process-oriented designing (Gero and McNeill 1998); and reflection-in-action (Valkenburg and Dorst 1998). Another stream of studies were concerned with the impact of use of different communication channels on design process (Vera et al. 1998; Gabriel and Maher 2002).
The ROCOCO project studying protocols of collaborative design presents one of the early approaches to detailed analysis of drawings together with analysis of verbalizations (Scrivener et al. 1992 cited in Mazijoglou et al. 1996). Consequently recent design protocol studies employed analysis of physical actions such as drawing, moving hands (referring to hand gestures in sketching) and also seeing/looking which provided a comprehensive picture of constructing external representations during designing (Suwa et al. 1998; 2000; Kavakli and Gero 2002).
Protocol studies in the engineering design domain focused on the work environment context and the social interaction discourse (Buciarelli 1994) as well as design behavior and communication (Badke-Schaub 2003; Glock 2003). These studies emphasized the analysis of conversation patterns, in order to gather information about the team dynamics, individual motivations, social interpretations etc. Protocol studies of this kind have been done relatively less in architectural design practice because of the difficulties in collecting protocols.
The internet and the expansion of international design practices have initiated our interest in studying “collaboration at a distance” both within the same profession and across professions. We believe that design work would be conceived as a social process, rather than design being influenced by social factors (Suchman and Trigg 1991; Bucciarelli 1994). Consequently the architectural design process could be conceived as a process of communication and interaction between designers and different domains instead of a process where the architect is a self-sufficient individual mind.
4. Method
In this study we worked with two architects from Woods Bagot, who were selected on the basis of observations carried out in the workplace/baseline study. In these observations, the collaborative roles of the participants were determined, and their face to face interactions were recorded. We name the
designers as Alex and Casey, the same names as their avatar names in the virtual world environment, rather than using their real names.
A series of pilot studies have been conducted for testing the experiment set up and maintaining participants’ acquaintance with the technologies. Before the experiment sessions, the participants were given a training session on the use of software and related tools. Then in the experiment sessions they were asked to work on a hypothetical design brief that they are exposed to for the first time.
4.1. EXPERIMENT SET-UP
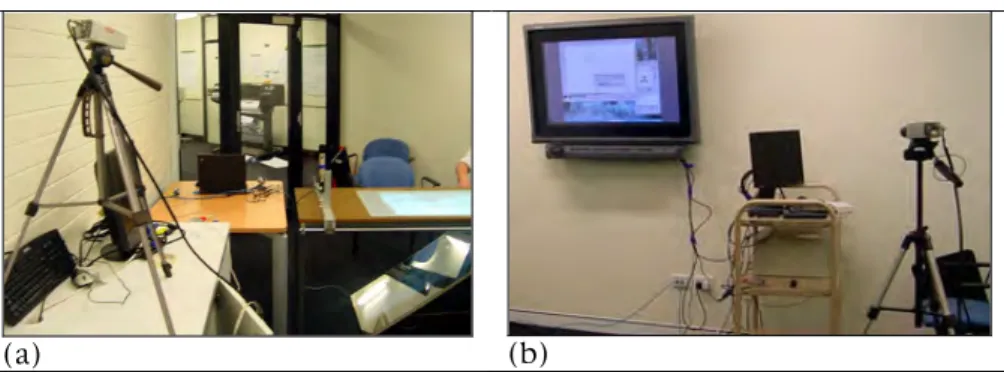
We record the designers’ activities and verbal exchanges in each session with a surveillance DVR (digital video recording) system. The DVR system was set to show four different views on one monitor. Two cameras were used to monitor the two participants’ behaviors and the other two views are video streams directly from the two designers’ computer display screens. Two separate microphones for each participant were fed into the DVR system through a sound mixer. Figure 1 shows the equipment set-up where two participants are located in the same room with a panel in between them. We placed the designers in one room to simulate high bandwidth audio, using the LAN for video and shared applications.
Figure 1. Diagram of equipment set up
In the experimental set-up, two cameras and two computers are connected to the DVR. “Desktop screen 1” was projected on a horizontal
Workbench/ Mimio Tool DVR Camera 1 Camera 2 P A N E L Desktop Screen2 Smart Board Desktop Screen1
workbench (with glass top) and a Mimio Tool2, and “desktop screen 2” was connected to the Smart Board with flat panel plasma display3. In the first
setting, the plasma display and the horizontal workbench were used so the designers had a large drawing surface. In the second setting, the cameras and video streams were connected to a typical desktop computer configuration with a vertical screen, keyboard and mouse.
Figure 2(a) shows the set-up and Figure 2(b) shows the first experiment setting. The location of the cameras was an important issue, since we aimed at monitoring participants’ movements, verbalizations, gestures and the drawing actions. Cameras 1 and 2 capture the gestures, general actions such as walking, looking at, moving to the side etc. while the direct connections to the computers/screens capture the drawing process in detail.
(a) (b)
Figure 2. (a) Camera 1, Desktop screen 1, and Mimio on workbench; (b) Camera 2, desktop screen 2, and Smart Board
In the first setting of the experiment, the architects used Microsoft Net Meeting, one participant via a Smart Board, Figure 2(b), the other participant via the Mimio on a projection table, Figure 2(a). Net Meeting includes a shared whiteboard application and web-cam application. The architects were able to see each other via the web-cam and also were able to talk to each other because they were located in the same room.
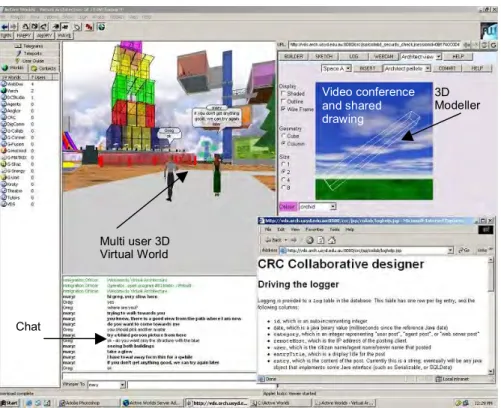
In the second setting of the experiment, the architects used an extended 3D virtual world application in Active Worlds, Figure 3. The 3D world includes a multi-user 3D building environment, video contact, a shared whiteboard, and an object viewer/insert feature. The participants can talk to each other because they are in the same room.
2http://www.mimio.com 3 http://www.smarttech.com
Figure 3. Extended virtual world 4.2. EXPERIMENT DESIGN
The experiment followed a 6 step procedure.
1. The designers were presented a short description of how they could use Smart Board or Mimio Tool. These are both pen and digital ink interfaces to a standard windows environment. The Smart Board is attached to a vertical plasma display and the Mimio is placed on a horizontal projection display.
2. The designers were given a 15 minute training session on the use of Net meeting. In the training session participants were engaged in doing a tutorial in order to review and/or build their skills in using specific features of the software application provided for collaboration.
3. The designers were given a design brief (see Appendix) and shown a collage of the photos of the site they are required to build on. The design brief involves designing an art/craft gallery on a site in Sydney. They were given time to read through the design brief and inspect the site layout and photos. The site layout was set in the share whiteboard application as a background image on several pages so that participants can sketch on them.
Multi user 3D Virtual World 3D Modeller Video conference and shared drawing board Chat
4. The designers commenced designing using Net meeting. The duration of the session was half an hour. Five minutes before the end of the session they were reminded that this was the amount of time remaining.
5. After a 5 minute break, the designers were given a 15 minute training session on the use 3D world. They were asked to do a tutorial in order to review and/or build their skills in using specific features of the software application.
6. The designers commenced designing collaboratively on the same design task/design brief, this time using the extended virtual world. The duration of the session was half an hour. Five minutes before the end of the session they were reminded that this was the amount of time remaining.
Table 1 shows the summary of methods, tools and activity of participants:
TABLE 1. Experiment sessions
1st Phase 2nd Phase Participants Alex and Casey Alex and Casey Interface Smart Board and Mimio
on a glass table Desktop Screen Software Net Meeting Active Worlds Application Shared White Board Construction Space
Webcam √ √
Training tutorial √ √
Design Brief Architect Version Architect Version
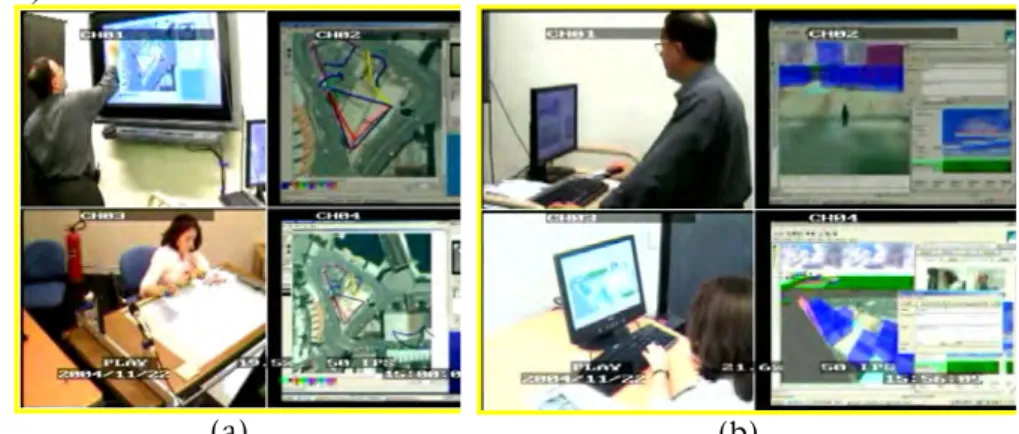
Figure 4 shows the shots from the recorded activities of the architects collaborating during Net meeting (Figure 4a) and 3D world session (Figure 4b).
(a) (b)
Figure 4. Architects collaborating during (a) Net meeting session (b) 3D world session
4.3. PROTOCOL CODING
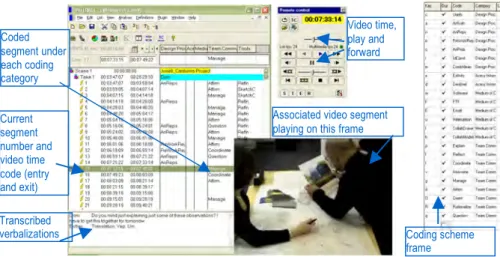
The software used for the analysis of the experiment sessions is called INTERACT4, with the interface as shown in Figure 5 for coding the
recorded videos. More information on the reasons for choosing this software and how it improved our coding process can be found in Candy et al (2004).
Figure 5. INTERACT Coding interface 4.3.1. Segmentation
The continuous stream of video and audio date needs to be segmented for coding and analysis. A single filmed session is called a Scene in INTERACT. There are “Takes” in a Scene which we refer to as design episodes. We utilized one take for coding one actor’s activity, and second take for second actor’s activity separately in a scene. “Events” are smaller activity definitions building up the “Takes” which are also the smallest segment definitions in the current study. In the study done by Dwarakanath and Blessing, an event was defined as a time interval which begins when new portion of information is mentioned or discussed, and ends when another new portion of information is raised (Dwarakanath and Blessing 1996). This event definition is an optimal one for our study as well, since the occurrences of actions and intentions change spontaneously as architects draw and communicate interactively.
An event can change when a different person starts speaking in a collaborative activity if s/he is introducing a new portion of information. In some cases the conversation goes on between the actors however the intention or subject of interest remains the same. For example, in Segment
4www.mangold.de Current segment number and video time code (entry and exit) Coded segment under each coding category Transcribed verbalizations Video time, play and forward
Associated video segment playing on this frame
Coding scheme frame
48 both Casey and Alex take turns in one segment, however their subject of interest is still the “ramp to a car park”:
Segment 48:
“Casey: This is... there is a photo of there. That is actually a ramp to a car park. And then there is a building and a little <inaudible>
Alex: And that is the ramp? Casey: That is the ramp.”
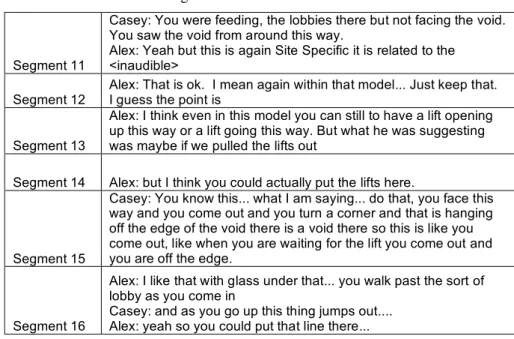
Then this conversation could be put into one segment despite the change in speaker. Table 2 shows the segmentation of a protocol excerpt from the study.
TABLE 2. Segmentation in terms of event definitions
Segment 11
Casey: You were feeding, the lobbies there but not facing the void. You saw the void from around this way.
Alex: Yeah but this is again Site Specific it is related to the <inaudible>
Segment 12 Alex: That is ok. I mean again within that model... Just keep that. I guess the point is Segment 13
Alex: I think even in this model you can still to have a lift opening up this way or a lift going this way. But what he was suggesting was maybe if we pulled the lifts out
Segment 14 Alex: but I think you could actually put the lifts here.
Segment 15
Casey: You know this... what I am saying... do that, you face this way and you come out and you turn a corner and that is hanging off the edge of the void there is a void there so this is like you come out, like when you are waiting for the lift you come out and you are off the edge.
Segment 16
Alex: I like that with glass under that... you walk past the sort of lobby as you come in
Casey: and as you go up this thing jumps out.... Alex: yeah so you could put that line there... 4.3.2. Coding Scheme
The purpose of the coding scheme is to provide categories for the collected data that will highlight the similarities and differences in collaborative designing using the two different design environments. These differences provide the basis for understanding the impact of introducing a new design environment. We have developed 3 coding categories: communication content, design process, and operations on external representation. The communication content category partitions each session according to the content of their conversation, focusing on the differences in the amount of conversation devoted to discussing design development when compared to other topics. The design process category characterizes the different kinds of designing tasks that dominate in the two different design environments. The operations on external representation category looks specifically at how the
designers interacted with their external representation of the design to see if using 2D entities or 3D objects was significant.
Communication Content:
The communication content category is applied to the transcribed conversation between the two designers, and one code is assigned to each segment. This code category has 5 codes as shown in Table 3.
TABLE 3. Communication Content
Software features Software/ application features or how to use that feature Design Process Conversations on concept development, design exploration, analysis-synthesis-evaluation. Awareness Awareness of presence or actions of the other Context free Conversations not related to the task
Tech Prob Talking about a technical problem
Communication on software features involves the questions about how to do specific tasks with the software, talking about individual experience of how to do things, problems faced during the use of the software, any feedback about the interface or use of software /statements of frustration about not getting something right etc.
Communication on design process involves statements about design issues, environmental or structural issues, design ideas, design solutions, judgments about design solutions, functional issues or design constraints, client requirements, comments on design brief, in other words any conversation about the design process.
Communication on awareness refers to conversations on participants’ presence and actions in a digital environment, for example:
“I see where you are, I’ll come down and join you and here I’m”. “aaaha you re working on the NE corner….”
“Did you manage to put walls?
Yes there are a couple of panels at the southwest corner”.
Context free communication refers to the conversations that are not related to the design, the software, or awareness of others, for example “shall we have a beer after this?”.
Communication on technical problems is coded separately from software features because they are problems that may be resolved in future experiments. The technical problems include software crashes, computer hardware or server failures, internet disconnection.
Design Process:
The design process category characterizes the kinds of design tasks the designers are engaged in for each segment. Assigning a design process category takes into consideration the words spoken during each segment as well as the actions observed in the videos. The codes in the design process category are an adaptation of the coding scheme developed by Gero and McNeill (1998). The codes in this category are shown in Table 4.
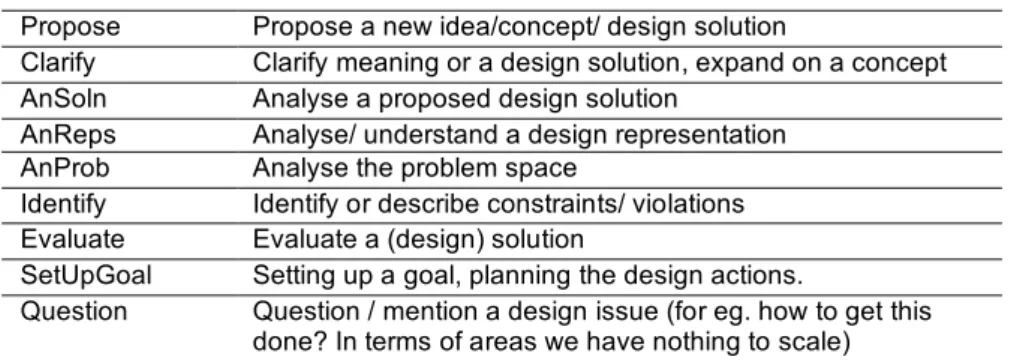
TABLE 4. Designing Process
Propose Propose a new idea/concept/ design solution
Clarify Clarify meaning or a design solution, expand on a concept AnSoln Analyse a proposed design solution
AnReps Analyse/ understand a design representation AnProb Analyse the problem space
Identify Identify or describe constraints/ violations Evaluate Evaluate a (design) solution
SetUpGoal Setting up a goal, planning the design actions.
Question Question / mention a design issue (for eg. how to get this done? In terms of areas we have nothing to scale) Operations on external representations:
The external representations category looks specifically at the actions the designers perform while using the software. Each segment is interpreted using the video of the designers’ behaviour including movements or gestures, and the video stream of the computer display showing how the software was being used. Table 5 shows the codes in the external representations category.
TABLE 5. External Representation
Create Create a design element Group Group elements
Move Orientate/Rotate/ Move element Erase Erase or delete a design element
Inspect Attending to, referring to the representation
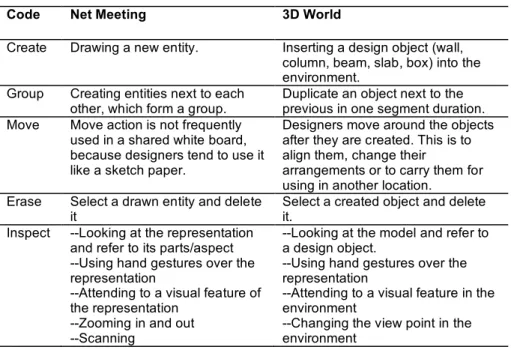
The actions required to construct external representations differ in each media. Thus the definitions of the codes in this category need to be explained for Net meeting and 3D worlds, as shown in Table 6.
TABLE 6. External Representation Actions
Code Net Meeting 3D World
Create Drawing a new entity. Inserting a design object (wall, column, beam, slab, box) into the environment.
Group Creating entities next to each other, which form a group.
Duplicate an object next to the previous in one segment duration. Move Move action is not frequently
used in a shared white board, because designers tend to use it like a sketch paper.
Designers move around the objects after they are created. This is to align them, change their
arrangements or to carry them for using in another location.
Erase Select a drawn entity and delete it
Select a created object and delete it.
Inspect --Looking at the representation and refer to its parts/aspect --Using hand gestures over the representation
--Attending to a visual feature of the representation
--Zooming in and out --Scanning
--Looking at the model and refer to a design object.
--Using hand gestures over the representation
--Attending to a visual feature in the environment
--Changing the view point in the environment
5. Interpretations 5.1. OBSERVATIONS
In the different design environments there was a noticeable difference in the designers’ focus. The sketching environment encouraged the designers to stay at a high level of abstraction and the 3D virtual world encouraged the designers to focus on the relationships between the objects in the design solution.
In the Net Meeting session, the architects produced sketches on the aerial view of the site layout. In page 1, Figure 6(a), the participants focused on organization of the layout and the relationships between the larger elements in the environment. Then, in page 2, Figure 6(b), the participants focused on the elements of the building, where they deal with form and structure in parallel to functions and the organization of the building elements (such as the location of loading dock suggesting two levels on the south side, the plaza and open gathering space suggesting a curved façade). In page 3, Figure 6(c), they mainly worked on the form of the building, evaluating the form and how successfully they satisfied the design brief requirements. In pages 4 and 5 they produced section drawings where they worked out the form of the design and considered 3D aspects of the building.
(a) (b) (c) Figure 6. Net meeting drawings (a) page 01 (b) page 02 (c) page 03
In the 3D World session the two architects constructed the design they previously worked on in the Net Meeting session. They started with placing the (pink) walls next to each other, Figure 7(a), and then moving them around, aligning them. Alex managed to put the walls on top of each other, and get the look of a second floor, Figure 7(b). Then they started using the space elements (blue transparent boxes) to represent the space, the building should cover, Figures 7(c) and 7(d). The construction of the blue spaces was relatively quick and towards the end of the design they managed to get a sense of the building on the site, Figure 7(d).
(a) (b) (c)
(d) (e)
5.2. PROTOCOL ANALYSIS
In the protocol analysis, we consider each of the three categories of codes separately.
5.2.1. Communication Content
Figure 8 shows the percentages of the percentage of time in each of the communication content codes. Most of the communication in Net Meeting session was on “designing” (85 %) followed by relatively little percentages of “software features” (8.5 %) and “awareness” (5.7%), Figure 8(a). In the 3D world session nearly half of the communication was on software features, Figure 8(b). The remaining communication was primarily about awareness and designing (22% and 28%). The significant amount of time on the 3D virtual world on the features of the software may be due to the unusual experience of being in a 3D virtual world while creating and editing a building model. It is significant that the designers in the 3D world session focused on expressing issues related to their awareness of each other. This is relevant because the location of the avatar determines what each designer can see, so the ability to collaborate depends on knowing where the other avatar is and what the avatar is facing.
(a) (b)
Figure 8. Percentage of time on communication content (a) Net Meeting (b) 3DWorld
5.2.2. Design Exploration
Figure 9 shows the percentages of time on design exploration codes in Net Meeting versus 3D World sessions. The designers spent significantly more time in proposing and analyzing solutions during the Net meeting session, Figure 9. However in 3D world session participants spent most time on setting up goals and then on analyzing external representations, Figure 9. This is consistent with our observations that the designers were focused more on high level issues in Net Meeting and were more focused on building the 3D models in the 3D world.
Figure 9. Percentages of time for design process actions (a) Net Meeting (b) 3D World
Figure 10 shows design process actions over time for each individual in Net meeting and 3D World sessions where “1” refers to Alex and “2” refers to Casey. In the Net meeting chart (Figure 10a) one can observe the cluster at the beginning of the session which is formed by analyzing a problem (AnProb), questioning (Question), and setting up goals (SetUpGoals) actions. Then proposal of ideas/ solutions (Propose) start to occur (Blue bars). Meanwhile analyzing solutions (AnSoln) are triggered by proposal actions (the pink arrows point to this relationship). Evaluation of solutions/ ideas (EvaluateSoln) occurs only after the first half of the session; in smaller time intervals in between analysis of solutions (orange ellipse markers point out to this relationship). However in the 3D world session there is hardly any pattern in occurrence of certain actions, Figure 10(b). Fewer segments are coded as “designing” in the 3D world than in Net Meeting, as explained in the section on communication content. This may account for the lack of patterns in their behaviour.
5.2.3. External Representations
Figure 11 shows the percentage of time related to operations on the external representation in Net meeting and 3D world sessions. “Inspect” was a dominant behavior in the Net meeting session that covers more than half of the total design session (60%) followed by “Create” (35%). Grouping elements consists of only 4.5% of the total actions time. In the 3D world
session inspection is observed in nearly half of the total duration of the session (45%), and this is followed by moving and grouping elements (26% and 21%). Time spent in creating elements is significantly small (6%) in 3D world session compared to Net Meeting (35%). Thus the ratio of the actions in constructing an external representation seems to be quite different when participants are engaged in a different media.
Figure 10. Individual design process actions over time (a) Net Meeting (b) 3DWorld
(a) (b)
Figure 11. Percentage of segment on operations on external representations (a) Net Meeting (b) 3DWorld
(a)
Figure 12 shows actions for operations on external representation over time for each individual in Net meeting and 3D World sessions where “1” refers to Alex and “2” refers to Casey. Looking at the occurrence of actions for each individual in the Net meeting session, Figure 12(a), we see Inspect-Create and Inspect-Create-Inspect patterns (see the pink arrows), as a frequently observed combination. Create and Inspect actions are observed to trigger each other rather occurring in parallel.
Looking at the occurrence of actions in 3D World, we again observe the Inspect-Create pattern (see pink arrows). Then, Create is usually followed by Move forming the Create-Move pattern (see orange arrows), and then Move is followed by Group action, forming a Move-Group pattern (see purple arrows). This chain of actions i.e. Inspect-Create-Move-Group pattern occurs at least three times during the session for each individual (see yellow ellipses). Note that Inspect can be observed as a continuous action, either in parallel with or immediately after Create, Move or Group actions. Thus the pattern of constructing external representations (Inspect-Create-Move-Group) is not one directional chain-like pattern only but interacting with the Inspect action frequently.
Figure 12. Individual actions over time to construct external representations (a) Net Meeting (b) 3DWorld
6. Discussion
Based on our insights from the baseline/workplace studies, the communication content in face to face sketching sessions is predominantly about the designing rather than about the tools they are using or where the other person is located. This is explained by the familiarity of this environment for the designers and the physical access they have to each
(b) (a)
other. We noticed a similar phenomenon in the remote sketching environment, where the designers talked about the design rather than the software or the awareness of each other. However, in the 3D virtual world we found that the conversation was predominantly about the software, and then only secondarily about the design and about their awareness of each other. The large percentage of the discussion on the software can easily be associated with the novelty of the experience, and the split between designing and awareness of others is due to the significance of the information about the other designer’s location with respect to the design model they are creating. This result emphasizes two aspects regarding the nature of the 3D world that is different to remote sketching: 1. Participants may communicate about their existence since they are in a virtual world, 2. participants may need to communicate about their actions, and location or presence of the objects since they can choose a different viewpoint to visualize the current representation.
Comparing the design tasks in Net Meeting and 3D World sessions, we showed that in Net Meeting the architects explored the design ideas more frequently, Figure 9, with the highest occurrences of segments on proposing and analyzing design solutions. Further these actions frequently triggered each other over the timeline of the design session. In protocol studies, this behavior refers to a design thinking cycle which involves analyzing a problem, proposing a (tentative) solution, analyzing the solution and finally evaluating it (Gero and McNeill 1998). A similar cyclic process was emphasized in creative cognition literature as explore-generate-evaluate actions (Finke et al. 1991). However in many cases, it is only after designers synthesize a solution that they are able to detect and understand important issues and requirements of the given problem. Lawson (1990)called this phenomenon ‘analysis through synthesis”. Then analysis of tentative solutions (in other words exploration) could be means to an evaluation which is an expected behavior during the conceptual phase of designing. In the Net Meeting session, the designers designed in a similar cyclic pattern where they propose and then analyze solutions, and in between evaluate them, Figure 10(a).
In the 3D World session, no significant patterns for designing were observed, Figure 10(b). This indicates a different behavior to the analysis-synthesis-evaluation cycle. In the 3D World, the designers set up goals in terms of building parts of their design or plan their actions. Then they analyzed the external representation, in terms of attending to parts and relationships, rather than thinking about the problem at an abstract level. This shows that designers’ aim in the 3D world session was to construct a representation of the design which we call “design making” rather than design exploration.
Comparing the operations on external representations in Net Meeting and 3D world sessions, we observed significantly different ratios in occurrence of actions; particularly of Create, Move and Group actions, Figure 11. This difference is mainly to do with the nature of representations the designers were dealing with; they construct with lines in a 2D media in Net Meeting, and with objects in a virtual environment in the 3D world, Figures 6 and 7.
Constructing external representations was a more complex issue in the 3D world session. The architects were engaged in the Inspect-Create pattern during the Net Meeting session, Figure 12(a), while they were engaged in a more complex pattern involving Inspect-Create-Move-Group actions during the 3D World session, Figure 12(b). In the 3D World the designers were synthesizing objects, through Create-Move-Group actions and continuously inspecting how they looked. This can also be interpreted as an “analysis through synthesis” process. Thus in the 3D world the designers were engaged in that similar pattern however with different tools; in Net Meeting they were dealing with abstract concepts, in 3D world with objects.
The results show that the designers’ behavior was different when they were engaged in remote sketching via Net Meeting and when they were engaged in modeling via the 3D World. They would not have focused on the details of how objects would come together and be synthesized if they were not using a 3D environment. In the same sense they would not be engaged in design process on an abstract level i.e. through design exploration, if they were not using the remote sketching environment. Thus the distinction between the nature and benefits of the two design environments were revealed by analyzing the design behavior of the participating designers: 3D World is for design making, remote sketching is for design exploration. In parallel to this view, there are also participant comments in the recorded sessions that they considered the 3D world environment as a modeling tool rather than a conceptual tool.
Further studies will focus on engaging more designers in the 3D World environment. In these studies the designers will be encouraged to engage in design exploration rather than only design making. They will be given a new design brief where they need to develop concepts, explore possible design solutions and evaluate them. We will increase the time dedicated to training on the extended virtual world, to assure that they utilize the software efficiently during the experiment rather than learning it.
7. Conclusions
Introducing new tools to the design process requires understanding of what purpose they serve. A design environment could be beneficial either for conceptual phase, detailing phase or modeling phase, however analysis of design behavior is needed for understanding the benefits of the
tools/environments. This case study was an attempt to characterize and compare the design behavior of two architects using two different tools/media for designing. We demonstrated architects developed abstract concepts, analyzed synthesized and evaluated them when they were involved in remote sketching via Net Meeting shared whiteboard. The same architects focused on synthesis of the objects and the making of the design, when they were involved in 3D modeling via the extended virtual world.
Acknowledgements
This project is funded by the CRC for Construction Innovation. Special thanks to our participant architects at Woods Bagot, and to our second coder Jeff Kan from KCDCC.
References
Akin, O: 1986, Psychology of Architectural Design, Pion, London.
Akin, O and Lin CC: 1995, Design protocol data and novel design decision, Design Studies
16:221-236.
Badke-Schaub, P: 2003, Strategies of experts in engineering design, in N Cross and E Edmonds (eds), Expertise in Design, Design Thinking Research Symposium 6, University of Technology, Sydney, Australia.
Bucciarelli, L: 1994, Designing Engineers, MIT Press, Cambridge, Mass.
Cross, N: 1997, Creativity in design: analyzing and modeling the creative leap, Leonardo
30(4): 311-317
Cross N, Christiaans H and Dorst K (Eds): 1996, Analyzing Design Activity, John Wiley & Sons, Chichester, UK
Eastman, CM: 1970, On the analysis of intuitive design processes, in G Moore (ed), Emerging Methods in Environmental Design and Planning, MIT Press, Cambridge, Mass, Cambridge, pp. 21-37.
Gabriel, GC and Maher, ML: 2002, Coding and modeling communication in architectural collaborative design, Automation in Construction 11: 199–211.
Gero, JS and Mc Neill, TM: 1998, An approach to the analysis of design protocols, Design Studies 19: 21-61.
Goldschmidt, G: 1996, The designer as a team of one, in N Cross, H Christiaans, and K Doorst (eds) Analysing Design Activity, John Wiley and Sons, Chicester, West Sussex. Glock, F: 2003, Design tools and framing Practices, Computer Supported Cooperative Work
12(2): 221-239.
Kavakli, M, Gero, JS: 2002, The structure of concurrent cognitive actions: A case study on novice and expert designers, Design Studies 23(1): 25-40.
Mazijoglou, M, Scrivener, S and Clark, S: 1996, Representing design workspace activity, in N. Cross, H. Christiaans, and K.Doorst (eds.) Analysing Design Activity, John Wiley and Sons, Chicester, West Sussex.
Munkvold, BE: 2003, Implementing Collaboration Technologies in Industry: Case Examples and Lessons Learned, Springer-Verlag, London Ltd.
Stempfle, J and Badke-Schaub P: 2002, Thinking in design teams – an analysis of team communication, Design Studies 23: 473–496.
Suchman L and Trigg R: 1991, Understanding practice: Video as a medium for reflection and design, in J Greenbaum and M Kyng (eds) Design at Work: Cooperative Design of Computer Systems, Erlbaum, Hillsdale, NJ, pp. 65-90.
Suwa, M and Tversky, B: 1997, What do architects and students perceive in their design sketches? A protocol analysis, Design Studies 18(4): 385-403.
Suwa, M, Gero, JS and Purcell, T: 2000, Unexpected discoveries and s-inventions of design requirements: Important vehicles for a design process, Design Studies 21: 539-567. Suwa, M, Purcell, T and Gero, JS: 1998, Macroscopic analysis of design processes based on
a scheme for coding designers’ cognitive actions, Design Studies 19(4): 455-483. Valkenburg, R and Dorst K: 1998, The reflective practice of design teams, Design Studies
19(3): 249-271
Van der Lugt, R: 2003, Relating the quality of the idea generation process to the quality of the resulting design ideas, in A Folkeson, K Grale´ n, M Norell and U Sellgren (eds) Proceedings of 14th International Conference on Engineering Design, Stockholm (CD-Rom no page numbers)
Vera, AH, Kvan, T, West, RL, and Lai, S: 1998, Expertise, Collaboration and Bandwidth, retrieved from the WWW (http://arch.hku.hk/~tkvan/chi98/chi98.pdf)
Appendix
Brief for a Harbourside Gallery (Architect Version) During this design session you are asked to prepare a block model esquisse scheme for a proposed art/craft gallery on this site. The site and information below provide details about the location and use of the site. There are 30 minutes available for this investigation.
This project is to prepare a block model esquisse scheme for a proposed art/craft gallery on this site. You should assume that all existing buildings have been demolished before your scheme commences construction. There is no floor space ratio or height restriction applicable for this project so you may choose to liberate as much or as little of the site for open space as suits your scheme.
Site
The site is a triangular block as shown below. Site area is approximately
2800m2.North is to the top of the picture where the harbour and wharves are visible. There are roads on all 3 sides of the site at varying heights relative to the ground floor of the existing buildings. You will see that one road crosses the other on an overhead bridge immediately to the south of the site, then ramps down along the west side of the triangle.
Accommodation Required Area (m2)
Galleries and performance space
Permanent exhibition suite 1500
Sculpture garden 600
Temporary exhibition suite 1 750 Temporary exhibition suite 2 150
Forum 750
Front of house public areas
Entrance/foyer xx
Reception 30
Cloak store 20
Café (with after hours access) 200
Shop 100
Shop storage 30
Ticket office 25
Members lounge 60
Back of house support areas
Staff entry xx
Loading dock to suit truck 12.5 x 2.5 x 4.5 high
Unloading 60 (min. opening 4.5 x 4.5)
Bay for forklift 10
Exhibition receiving and preparation 200
Restoration and repair workshop 200
General storage 50
Chair storage 30
Cleaning 10
Board room 60
Director 30
Assistant directors and manager 20 x 3
Curators 15 x 12
Accounts 10 x 4
Security 20
Technical support 30 x 2
Volunteers 20
Toilets and showers xx
Notes
No car parking required
Maximize energy efficiency and passive solar principles All galleries to be naturally lit
Forum minimum span 25 metres Separate delivery for café and shop
The participants were also given a collage of the photos showing the site and the surrounding area (Figure A1)
ON SOCIAL DYNAMICS FACTORS IN MULTI-STAKEHOLDER DECISION MAKING IN THE EARLY STAGE OF PRODUCT DEVELOPMENT
PING GE AND PING-HUNG HSIEH Oregon State University, USA
Abstract. Social dynamics exists wherever more than one human being is involved in making a decision. In particular, when design decisions are influenced by a group of stakeholders who may have different interests and background, the decision making process is affected by both technical and social dynamic factors, and the design results are consequently a product of the joint influence. Though important, the role of human and social dynamics factors in design process is not well understood. Furthermore, means are lacking for measuring the effect of these factors on the design results. In this work, our study is focused on design problems concerning understanding customer needs at the early stage, in particular, identifying quality requirements and their relative importance by a group of stakeholders. We introduced one among many human and social dynamics factors, i.e., trust, and investigated its role in the early stage design decision making of product development. Derived from the definition and principle forms of general trust, the trust concept used in the prioritizing problem we use in the study is specified. The existing measurement scales used in social science are modified for measuring the trust in terms of trustworthiness. The possible scenarios of integrating the trustworthiness from this work in group-prioritizing customer requirements are discussed to show the potential of developing a systematic design methodology with social dynamics consideration in the early stage of product development.
1. INTRODUCTION
It is not uncommon to observe situations where decisions involve multi-stakeholders in product development. Usually, given a certain design problem, a group of stakeholders with different backgrounds and interests are brought together and try to find solution(s) that are agreeable to each of them, as shown in Figure 1. Because of different background and interests, every single stakeholder may hold his/her unique understanding and
interpretation of the same things, and negotiations are often needed to find a common ground among the stakeholders. On the other hand, it is possible that the importance of each stakeholder can differ from each other, and therefore, their opinion may weigh differently in the final results. However, even when one or several authoritative figure(s) (such as a project leader or management) has to make a decision, he/she consciously or unconsciously takes into account opinions or concerns from those crucial parties that may affect the next step implementation process of their decisions. Existing efforts have produced a wealth of methods/tools to support teamwork and group decision making. But the research questions still remain: 1) What are the underlying factors that bring together multi-stakeholders’ diverse perceptions? and 2) How do these factors contribute to the final consensus?
Figure 1. Reaching consensus in a multi-stakeholder environment
Product quality plays an important role in successful product development and this fact has forced product development companies to include understanding customer needs as an important part in their practice. Kano’s model indicates that the better their needs and desires are understood and fulfilled, the more the targeted customers are satisfied, and therefore, the more desirable quality the product delivers (Ullman 2003). As shown in Figure 2, there exist three levels of product quality attributes: basic, performance, and excitement. In most product development, performance related product quality attributes take a majority part of the overall quality requirements. For instance, based on a survey published in Time (Nov 13, 1989), the major categories of performance requirements associated with product quality include Reliability, Maintainability, Durability, Looks, Design, the use of latest Technology and the number of Features. For a certain product development, the identification and specification of those
essential performance-level, and maybe also several excitement-level, product quality attributes are among those early stage decisions to be made as part of design problem appraisal.
Figure 2. Kano’s model of customer satisfaction
Customer survey is commonly used to obtain raw customer data and a process then takes place to extract information on what is a good quality product. The goal of the process is to decide on a list of Requirements that capture and represent the essential product quality attributes. As suggested by Hauser et al. (1988) in House of Quality, the extraction process of these Requirements that capture and represent the essential product quality attributes involves both the voice of customers and the inputs from product development stakeholders. The development stakeholders are consist of representatives from marketing, sales, service divisions, and engineering stakeholders from design, manufacturing, and supply chain. As a result, the decisions on these Requirements reflect an agreement on the understanding and interpretation of the product quality attributes by all the stakeholders including customers.
Based on their investigations of Sweden industrial practice, Engelbrektsson et al. discovered that customers (end users) often have difficulties in verbalizing all requirements for future product (Engelbrektsson 2004; Karlsson 1996). In addition, requirements have been found to change during the development of the product or system as the customer and the product development team gain experience and insight (Hsia 1993). There are also evidences that the traditional marketing methods
such as conjoint analysis may be insufficient in providing the desired information, in particular to supply the detailed information required by engineers.
In order to avoid confusion with the existing notion of Customer Requirements (CR), we propose to use Quality Requirements (QRs) to represent the agreement among the multi-stakeholders on the essential product quality attributes because they tend to reflect the true nature of the extraction process. The product quality attributes may mean different things to the different stakeholders: to customers (end users, etc.), they should represent what the customers wants and needs to facilitate their daily life and work; to engineering stakeholders, they may have more emphasis on advanced technology and better design; to marketing stakeholders, they usually mean better price, packaging, brand, neat advertising campaign, etc. Besides the corporate strategy and practical constraints (such as technology readiness, budget, personnel and time), the engineering stakeholders can bring in some performance related product quality attributes that may greatly affect the customers’ satisfaction about the product (particularly when using the product) though they may not be explicit in the customer survey and/or marketing analysis. There may exist negotiations and compromises between the QRs directly derived from raw customer data and the inputs from engineering stakeholders. In case where there might be a lack of sufficient resources to gather the hard evidence from the customers as desired, the involvement and influence of the engineering stakeholders in the QR extraction process maybe even more. Besides a development company’s economic objectives, more and more companies are investing on organizations and activities that satisfy regulations concerning compelling societal concerns, such as environmental sustainability. These concerns may not be directly required by the consumers, but they must be considered and complied by the product developers in order to get the regulators’ permission for their products’ market release. The attributes addressing these concerns are incorporated into the product quality requirements based on the development stakeholders’ understanding and eventually reflected in the final QR related decisions, as show in Figure 3. Furthermore, individual stakeholder preference can also lead to different levels of benevolence toward the product and team, which might influence the group decisions.
Demand modeling approaches have been identified to be useful in predicting customers’ demand for a product and also play an important role in assessing the profit or revue that a product can generate. Li et al. proposed the Comparing Multi-attribute Utility Values Approach (Besharati 2002), followed by a Customer Expected Utility Approach (Li 2000) by Besharati et al. Wassenaar et al. proposed an Integrated Latent Variable Choice Modeling for an enhanced demand model by combining a latent variable
model and a multinomial logit choice model (Wassenaar 2003; Wassenaar 2004).
Figure 3. Understanding customer needs by multi-stakeholders
By using a latent variable construct, this approach enables to establish an explicit relationship between the marketing-oriented product attributes (such as those used in conjoint measurement, more reflect the customers’ perceived product attribute levels) and engineering oriented product attributes (such as those related to engine performance, more reflect true engineering performance and requirements). Compared to the existing conjoint measurement approaches, this approach seems to have more consideration on incorporating the engineering development stakeholders’ inputs in understanding customer needs. However, it is still not clear how to capture and assess the contributions of important social dynamics factors in understanding customers’ needs by multi-stakeholder, such as different knowledge/experiences, communication skills, interpersonal trust, personality, politics, etc. The investigation of the existing approaches on understanding customer needs shows that, though the social dynamic factors and their role in understanding customer needs for product development are important, they are not well understood. We argue that, if we can somehow identify these social dynamic factors and understand their internal mechanism in a multi-stakeholder group design decision process, we may be able to understand the negotiation process among the multi-stakeholders
much better and fundamentally improve the effectiveness and efficiency of understanding customer needs.
The involvement of the multiple product development stakeholders (as multi-stakeholders from now on) has bestowed the QR extraction process with both technical and social dynamic characteristics. The multi-stakeholders are valued by their individual knowledge and specialized expertise. However, in the mean time, this also creates the barriers that could prevent them from smooth communication solely based on the technical basis and terms. As a result from different interest and background, each stakeholder may have his/her understanding and interpretation of the customer data, company’s marketing strategy and societal trend (such as environmental regulations). When negotiating for a design decision, each stakeholder may bring an individual “voice” to the table based on their understanding of or perceived what are the essential quality attributes. The negotiation process can be influenced by a set of social dynamics factors, such as knowledge/experiences, communication skills, interpersonal trust, personality, politics, etc. Along negotiations the “voices” of different stakeholders are heard, understood, and interpreted by others, and combined, integrated, evolved to a final group agreement. The final QRs decision represents a group understanding and interpretation of what are the essential quality attributes with the influences of the social dynamic factors among the group members though they may not be visualized externally. Assuming all stakeholders are equally involved and authorized, the negotiation among them about a design decision would be on a democratic basis. If not equally powered, their negotiation mechanism can be less democratic and easily manipulated. If the group is dominated by some extroverts, the voice of the non-extroverts might be poorly represented, or even worse, not be heard at all. We can enumerate many other such examples when a negotiation process is hindered by some implicit human and social factors and the teams have to struggle laboriously in the dark.
By looking into the existing work on social network, it has inspired us to conjecture that the social dynamic factors in the negotiation process might be reflected in parts of the social network among the stakeholders (such as an advisory network, to whom are you going to ask for advice, etc.) (Krachhardt 1993; Katz 2003). According to the existing social network literature, interpersonal social effects are authoritatively involved in building a social network based on social, informal interactions. Among the many studied social factors, the authors recognized the significance of trust in strategic decisions, such as prioritizing the customer requirements and other important tasks in engineering design (Korsgaard 1995; Eisenhardt 1989). During our investigation, the idea has emerged that trust in others’ individual opinion or decision on a certain design problem may be an underpinning
factor affecting the negotiation process among multi-stakeholders when trying to reach consensus at the early design stage. Existing literatures in marketing and management have investigated trust definition, trust measurement, antecedents of trustworthiness, and behavior implications of different types of interpersonal trust (McAllister 1995). For example, possible antecedents that affect the trustworthiness among group members in a group decision setting include an individual’s knowledge/capability, integrity, and benevolence of peers, etc. On the other hand, environmental factors, such as targeted customer market, corporate culture, and corporate infrastructure, can also influence the trust network among multi-stakeholders. It is necessary and possible to study trust network and its role in engineering decision making, so that knowledge can be acquired on the characteristics of trust network in multi-disciplinary product development teams, and methods/tools can be developed to assess and incorporate their impact into group decision making.
In the proposed work, we focus on understanding different forms of trust network and their possible impact on design decisions concerning understanding customer needs. This work investigates the role of trust in a cross-functional multi-stakeholder group decision making problem, i.e., prioritizing customer requirements at the early design stage. Two principle forms of trust network are studied and hypotheses are developed. The existing measurement scales used in social science are modified for measuring the interpersonal trust in terms of trustworthiness, and a preliminary questionnaire is constructed. With a proper measurement mechanism, a trust network among stakeholders can be concluded, and the trust’s effect on the group QR decisions be accounted in terms of trustworthiness. The trust measurement may then be used to weight each stakeholders’ contribution towards the final decision. Given the limited length of the paper, the integration of the proposed trust measurement in the negotiation process to finalize the QR relative importance is only discussed briefly in this paper, and will be the focus of another work.
2. Background Review
Integration of human and social dynamics effects into the early stage decision of collaboration design require the consideration of both technical and social aspect in solutions. In this section, we review existing work in three most relevant areas: quality decisions at the early design stage, modeling customer demand, and social dynamics in group decision making. 2.1. UNDERSTANDING QUALITY ATTRIBUTES
A useful way to build quality into products is Quality Function Deployment (QFD). QFD supports the fundamental processes at an early stage of product
development with strong integration of the customer’s voice (VOC) (Akao 1990; Cohen 1995). QFD helps to develop specifications or goals for the product, how the competition meets the goal, what is important to the customer and numerical targets to work towards (Ullman 2003). QFD provides a method to convert the customer wants and needs into engineering specifications. Given constraints on resources (e.g. time, money and personnel) it is not only necessary to know what the customer wants, but how relative important it is for him. An initial distinction between the customer requirements (CR) are provided by the categories wants (i.e. like-to-have), needs (must-have) and desires (i.e. wish-to-have) (Lai 1998). The customer himself might not be capable to rank the importance of the customer requirements, because for him everything might be as important and yet the CR have to be traded off. QFD proposes the use of the planning matrix, where as the costumer importance, the satisfaction of the customer, the competitive satisfaction performance, the goal, improvement ratio, sales importance, are used to find a normalized weight (Cohen 1995) of each CR. In extensive customer inquiries the weights of each CR might be found. Ullman describes several techniques to assess either ordinal or relative importance with the customer together (Ullman 2003). The key requirements for extensive customer inquiries are a) the targeted customer has to be clearly determined and b) there have to be sufficient resources to gather the data. Often in engineering projects neither of these requirements are fulfilled. An alternative to extensive customer inquiries is that the cross-functional stakeholder group decides on the importance of each CR on their own (Cohen 1995). It is supposed that within the stakeholder group the voice of customer is represented adequately. Using the alternative brings uncertainty to the obtained CR, there will be a gap between what the customer will perceive as product quality and what the group of stakeholders perceives the customer will perceive. To make matter more uncertain strategic aspects of the organization and societal concerns (e.g. environment) have to be integrated in the determination of relative importance as well. According to Lai et al. (1998) only an effective group decision making process may apply to achieve correct CR and their ranking in such a case. Lai et al. are proposing a technique to integrate communication of team members and preference for CR of each individual team member. Their proposed technique allows individuals to stick to their own set of criteria despite the group decision making. Lai et al. assume that preference of every stakeholder is equally important and neither consider power or expertise as distinctive factors for a certain stakeholder’s contribution.
2.2. MODELING CUSTOMER DEMAND
Conjoint analysis or conjoint measurement (Green 1975; 1978) assumes that a set of product attributes can be identified to affect customers’ buying preference. Typical product attributes here include brand name, service option, price, appearance, description used to advertise the products, psychological images, convenience of use, etc. The value ranges (numerical or nominal) of these attributes are also known. Customer evaluation responses on their preference to the representative combinations of the above product attributes’ values are then collected for conjoint analysis. The analysis result includes utility scales for all the product attributes. Then the composite utility of a single combination of the product attributes’ values can be obtained, currently by using an additive model without considering interactions among the attributes. By comparing the utility of different combinations of the product attributes’ values, knowledge can be obtained on what are customers’ preferred combinations for a product. When applying to understanding customers’ needs for product development, its limitation includes: 1) the nature of a