Measuring the
Risk-Based Value of
IT Security Solutions
Ashish Arora, Dennis Hall, C. Ariel Pinto, Dwayne Ramsey, and Rahul Telang
I
nformation security problems cost millions of dollars for US companies and billions for the overall US economy, according to a joint survey by the Computer Security Institute and the US Federal Bureau of Investigation (http://www.gocsi.com/press/20040609.jhtml). Nowadays, the question is not whether organi-zations need more security, but how much to spend for added security.And yet investing in IT security has always been a hard sell for IT man-agers. Scores of security technologies are on the market and, if anything is certain, it is that none of them can guarantee security. Each choice involves risk. The problem is that security man-agers lack structured cost-benefit methods to evaluate IT security solutions in light of prevail-ing uncertainties.A new framework can help evaluate the costs and benefits of IT security solutions using a com-pany’s risk profile. Using an unconventional con-cept, this framework bases benefit on avoided risk rather than increased productivity. Lawrence Berkeley National Laboratory (LBNL) uses this framework to help demonstrate to management and auditors that it is significantly less expensive to accept some damage from cyberattacks than to attempt to prevent all possible damages.This pragmatic approach continues to enable LBNL’s cyber-security staff to optimize cyber-security countermeasure investments and reduce spending without sacrific-ing protection.
RISK-BASED BENEFIT
Risk-based benefitis the reduction in expected loss from security failure incidents (that is, a reduction in risk). It is noteworthy that this ben-efit does not necessarily translate into additional resources, which companies would typically use for other productive endeavors. In this sense, IT security activities have a strong affinity with other activities that do not produce revenue but nonetheless provide essential and necessary sup-port for the overall organization.As such, the rel-evant criterion in evaluating IT solutions is not simply the cost of implementation but how much benefit each additional dollar of investment brings, in the form of reducing the expected loss or risk.This is the basic idea of valuation on which we base our framework.
GENERAL FRAMEWORK
The framework described here uses a risk man-agement approach that integrates risk profile with actual damages and implementation costs to determine the costs and benefits of information security solutions. This approach requires rea-sonably voluminous data and is thus well suited for organizations with extensive incident data or when the consequences of incidents are high enough to warrant extensive data gathering.
Two crucial concepts are necessary.The first, inci-dent type, refers to the various types of cybersecu-rity-related incidents that an organization records. An incidentis any undesirable event resulting from attacks against the information system. Although
trade-off of security solutions.
Resources
S E C U R I T Y
no generally accepted naming scheme exists for incident types, most organizations track incidents on an annual basis. They typically group them into types such as root compro-mises (violations of network access rights) and malicious-code attacks (by, for example, worms such as Slammer).
The second crucial concept is bypass rate.Bypass rateis the rate at which an attack results in observable damage to the organization. Each security solution has a bypass rate for every incident type. A 100 percent bypass rate means the security solution does not stop incidents of that type.
By using incident types and bypass rates, IT profession-als can better judge the efficiency and return on investment (ROI) for an organization’s security solutions. Suppose that the expected number of attacks per year, in the absence of any security solutions for a given incident type, is N. If only one security solution is in place, the expected number of successful attacks in a year is Ntimes the bypass rate for that security solution and the given incident type. Furthermore, suppose the expected damage from a single incident of a given type is D. The total unprotected risk to the organization is then N×D, and the expected damage is N×D×net bypass rate for the given incident type.
A value of total unprotected risk greater than the pany’s total worth implies that, if left unprotected, the com-pany does not have enough resources to cover the total damage of this type.
If two or more security solutions are in place, it is nec-essary to make some assumption about how they combine to ward off attacks.The assumption that proved to be
effec-tive at Lawrence Berkeley National Laboratory is that each acts as an independent fil-ter. Under this assumption, the net bypass rate is the product of the individual bypass rates for the given incident type. For example, although a perimeter firewall might miss an attack, the intrusion detection system might still prevent it.
This assumption is consistent with the general impression that having several security solutions is a wise investment— net bypass rate is the product of the individual bypass rates, while the investment cost is only the sum of the individual investments.
In many cases, it’s not possi-ble to record all damages. In these cases, you must estimate the number of incidents and the damage, and adjust accord-ingly. If actual damages are available at all, they are likely to be reasonably accurate. Nevertheless, a small adjustment for unrecorded incidents is reasonable.
With current technology, it is impossible to directly count the total number of attacks in a year. However, an organ-ization might also estimate bypass rates either by con-sulting the operators of the various security solutions or by contacting the vendors of the various security products. If this is not possible, the organization can still establish a lower limit on net bypass rate by assigning a limit to the total unprotected risk.
This analysis requires the following data:
• Observed damage.This is the damage that the company sustains in a given time period for each incident type. • Cost.For a given security solution, this is its
implemen-tation and operating costs.
• Bypass rate.You must estimate this rate (as discussed earlier) for each pairing of incident type and security solution.
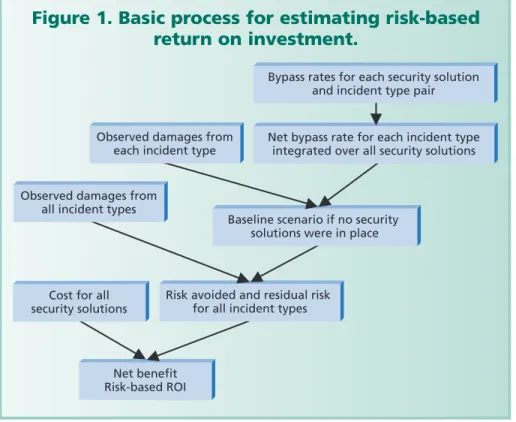
The general analysis framework has three phases: • Estimate the net bypass rate for all security solutions. • Calculate incident risk and baseline scenario.
• Calculate net benefits and risk-based ROI (RROI). Figure 1 outlines the procedure; we discuss it in the fol-lowing short sections.
Net benefit Risk-based ROI
Risk avoided and residual risk for all incident types Observed damages from
all incident types
Cost for all security solutions
Baseline scenario if no security solutions were in place
Bypass rates for each security solution and incident type pair
Net bypass rate for each incident type integrated over all security solutions Observed damages from
each incident type
Figure 1. Basic process for estimating risk-based
return on investment.
Net bypass rate(incident type) =
∏Bypass rate(incident type, security solution)
for all security solutions.
Calculate incident risk and baseline scenario
Observed damage describes the damages incurred when an incident occurs, and it comes from organizational processes that an incident
triggers. Observed damage includes, for example, lost productivity from a work stoppage that occurs because of, for example, a root compromise.
Incident risk is the observed damage for each incident type divided by the corresponding net bypass rate:
This represents the damage that a company would have incurred from each incident type if no security solutions were in place.
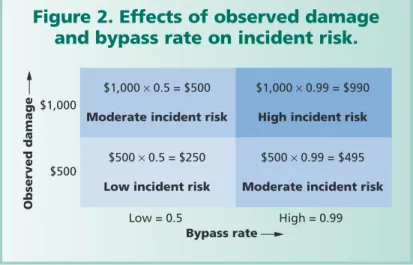
Figure 2 shows how variations and combinations in observed damages and bypass rates affect incident risk. For incidents with a given observed damage but different bypass rates (50 and 99 percent), the incident with the lower bypass rate will indicate higher incident risk.This is because lower bypass rate implies that it took more attempted attacks to produce the same given damage. Thus, in this case, the incident with the lower bypass rate comes with a higher risk, if the system remains unpro-tected.
The baseline scenario is the grand total of all incident risks to the organization if it had no security solutions in place:
Baseline scenario= ΣIncident risk(incident type), for all incident types
Residual riskis the expected value of damages with only one installed security solution. We calculate it by multi-plying each incident risk by its corresponding bypass rate for the given security solution and summing over all inci-dent types:
Residual risk(security solution) =
Σ[Incident risk(incident type) × Bypass rate (security solution)]
Incident risk =Observed damage (incident type) Net bypass rate (incident type)
Calculate net benefit and RROI
RROI is the ratio between the net benefit in imple-menting an IT solution and the implementation cost. Unlike the conventional notion—where ROI measures how effectively an investment uses resources to generate profit—RROI measures how effectively you use resources to avoid or reduce risk. Specifically, a positive RROI means that the dollar value of the avoided risk is greater than the implementation cost. An RROI greater than 1 means that you avoid more dollars of risk for each dollar spent on an implementation.
Positive RROI does not change the fact that IT security activities are not revenue generators. Rather, RROI should help guide the overall investment in security such that the company should invest in security until the RROI falls to a minimum rate acceptable to the organization. That is, until a point where further investment has such a diminished return that you’re better off investing the money elsewhere.
If, however, you must choose among alternative secu-rity investments, net present value (NPV), the difference between benefits and costs, is a more appropriate meas-ure than ROI. However, the use of NPV poses a burden in requiring more detailed information such as the cost of capital, and the time when costs and benefits occur. This presents a difficult challenge in terms of IT security solu-tions, because the occurrence of security failure is highly unpredictable and uncertain.
EXAMPLE
The CIO of a data services company wants to evaluate the corporate IT security system. The system consists of five solutions: firewalls, a vulnerability eradication pro-gram, an intrusion prevention system, a configuration
RROI =Baseline scenario – Residual risk – Cost Cost
$1,000 × 0.5 = $500
Moderate incident risk
$500 × 0.5 = $250
Low incident risk
$1,000 × 0.99 = $990
High incident risk
$500 × 0.99 = $495
Moderate incident risk
Observed damage
Bypass rate
Low = 0.5 High = 0.99 $1,000
S E C U R I T Y
management system, and a training program. The CIO’s objective is to gauge whether the company is spending too much or too little on security, based on the net benefit and the company’s acceptable ROI.
To accomplish this evaluation, the CIO assembles a team
to model the effectiveness of these solu-tions in securing the network against security incidents. For one year, the team records network security incidents and classifies them into four types: • account compromises, unauthorized
account access;
• improper use, information leaks and other potential embarrassments to the organization;
• malicious-code infections, such as worms and viruses; and
• root compromises, unauthorized root access to user accounts. Table 1 shows the team’s findings for all observed incidents and damages for the one year. These damages include the cost of resources used to repair damaged information as well as any lost productivity.
However, the team knows that these observations are only the tip of the ice-berg. There are certainly many more unsuccessful attacks that the existing security system blocked. Estimating the number of unsuccessful attacks is a key step in the analysis.
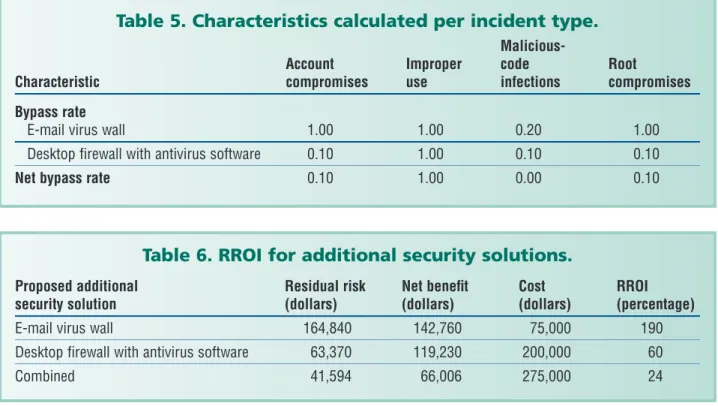
After close collaboration with ven-dors and IT professionals, the team esti-mated how ineffective the security solutions were in preventing incidents, developing a bypass rate for each inci-dent type. In particular, the bypass rate for improper use is 100 percent for fire-walls and vulnerability eradication, because these security solutions cannot detect improper use. However, an intru-sion prevention system is quite effec-tive at detecting such incidents.Training and configuration management also provide some help.
Because there is no easy way to ascer-tain the interaction of the security solu-tions, the team assumes that the net bypass rate for each incident type is the product of the rates for all five solutions, as Table 2 shows. By using the observed damages, the team can also calculate the risk for each incident type.
The team now wants a picture of the actual risk that the various incidents create, that is, the damage if no security was in place. It obtains this measure by dividing the observed damage for each incident type by the
correspon-Table 1. Occurrences and damage
by incident type.
Incident type
Malicious-Account Improper code Root Characteristic compromises use infections compromises
Observed 3 289 345 23 occurrences Observed 5,400 27,900 272,200 77,100 damages (dollars) Average 1,800 100 790 3,350 damage (dollars)
Table 2. Characteristics calculated
per incident type.
Malicious-Account Improper code Root Characteristic compromises use infections compromises Bypass rate Firewalls 0.80 1.00 0.80 0.80 Vulnerability 0.40 1.00 0.40 0.40 eradication program Intrusion 0.15 0.15 0.15 0.15 prevention system Configuration 0.60 0.80 0.50 0.55 management system Training 0.80 0.80 0.80 0.90 program
Net bypass rate 0.02304 0.0960 0.0192 0.0238
Observed 5,400 27,900 272,200 77,100
damages (dollars)
Incident 234,400 290,600 14,177,100 3,244,900
ding net bypass rate. For example, account compromises have an observed damage of $5,400 from attacks that bypassed all five security solutions.The actual damage rep-resents 0.02304 (2.3 percent) of the damage that would have occurred had these security solutions not been in place. Therefore, the incident risk for account compromises is $5,400/0.02304 = $234,400. In the absence of all five security solutions, this is the damage that the company would have suffered.Table 2 shows the observed damages together with incident risks.
The team now reconciles its assumptions about bypass rates with its conclusions about the incident risks. For this example,
Baseline scenario= 234,400 + 290,600 + 14,177,100 + 3,244,900 = $17,947,000
the sum of the incident risks in Table 2. In particular, the team asks whether this baseline scenario for all four types of nearly $18 million is realistic, too high, or too low.After significant discussion, the team decided the implied total risk estimate is realistic and moves on to the next step.
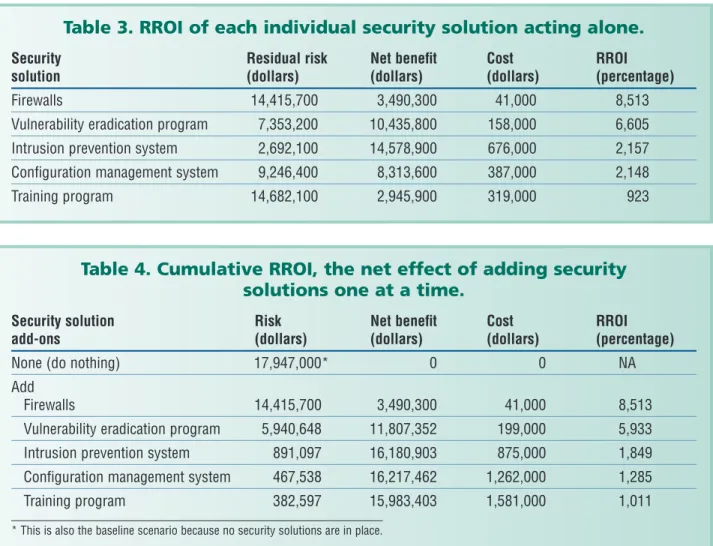
The team now calculates the residual risk of each secu-rity solution acting alone. For example, for the firewalls, Residual risk(firewalls) = (0.8 ×$234,400) +
(1.0 ×$290,600) + (0.8 ×$14,177,100) + (0.8 ×$3,244,900) = $14,415,700
where the values for bypass rate and incident risk come from Table 2.
From this, the net benefit is the risk avoided (baseline scenario minus observed damages) less the annual cost. Net benefit(firewalls) =
17,947,000 – 14,415,700 – 41,000 = $3,490,300
RROI for the firewalls alone is 3,490,300/41,000 = 85.13 = 8,513 percent.Table 3 shows residual risk, net benefit, and RROI for all five security solutions acting alone.
The team wants to know if it could omit any of the solu-tions. To perform this calculation, it starts with the best stand-alone solution and adds each additional one sequen-tially, in order of the stand-alone RROIs. Table 4 shows
Firewalls 14,415,700 3,490,300 41,000 8,513 Vulnerability eradication program 7,353,200 10,435,800 158,000 6,605 Intrusion prevention system 2,692,100 14,578,900 676,000 2,157 Configuration management system 9,246,400 8,313,600 387,000 2,148 Training program 14,682,100 2,945,900 319,000 923
Table 4. Cumulative RROI, the net effect of adding security
solutions one at a time.
Security solution Risk Net benefit Cost RROI
add-ons (dollars) (dollars) (dollars) (percentage)
None (do nothing) 17,947,000* 0 0 NA Add
Firewalls 14,415,700 3,490,300 41,000 8,513 Vulnerability eradication program 5,940,648 11,807,352 199,000 5,933 Intrusion prevention system 891,097 16,180,903 875,000 1,849 Configuration management system 467,538 16,217,462 1,262,000 1,285 Training program 382,597 15,983,403 1,581,000 1,011
Because these solutions will add to the existing system, the initial risk to which they apply is simply the observed damages from the previous one year study. Table 6 shows the stand-alone RROI for each additional solution taken separately as well as together. Given these data, the CIO concluded that the wisest investment is to acquire both solutions, reducing residual risk from $382,597 to $41,594. He will use these data as leverage for reducing the annual cost or improving the bypass rates of the two solutions.
OBSERVATIONS
We mentioned earlier that RROI differs from its con-ventional counterpart in the way you view the benefits. However, it is timely to reiterate the appropriateness of RROI for decisions about how much to invest, and not so much in choosing among alternatives, as discussed in the previous section.
The decision process for managing the dilemma of choos-ing among security solutions is beyond the scope of our framework. This is a case in which sensible chief informa-tion security officers or CIOs will use more than one crite-rion to evaluate IT security solutions.
CHALLENGES TO APPLYING THE FRAMEWORK
In practice, there are significant challenges in using this framework.
Obtaining true costs
Companies often miscalculate non-cash but otherwise very relevant costs, such as the lost productivity and oppor-the cumulative results of adding oppor-these security solutions.
Each new solution starts from the residual risk and cost of the preceding solutions. For example, for the firewalls and vulnerability eradication program together,
Residual risk(firewalls + vulnerability eradication program) = (0.8 ×0.4 ×$234,400) + (1.0 ×1.0 × $290,600) + (0.8 ×0.4 ×$14,177,100) + (0.8 ×0.4 × $3,244,900) = $5,940,648
With a total net benefit of $15,983,403 and total cost of $1,581,000, the RROI is 1,011 percent, as the last line of Table 4 shows.
The team notes that even though RROI decreases with each additional solution, it is quite acceptable at 1,011 per-cent for the entire set of solutions.
The training program has the lowest stand-alone RROI. The team does not conclude, however, that it should elim-inate training. Instead, team members decide to enhance the training program to improve its bypass rate. Training is essentially the only defense against socially engineered attacks—those in which attackers use human interaction (social skills) to obtain or compromise information. As such, training is a key defense against what is likely to be a significant future threat.
Having completed the initial analysis,the CIO now decides to use the model to evaluate two new proposals:A virus wall for the corporate e-mail system and internal firewalls with antivirus software for desktop systems. Table 5 shows the costs and estimated bypass rates for these security solutions.
S E C U R I T Y
Table 5. Characteristics calculated per incident type.
Malicious-Account Improper code Root
Characteristic compromises use infections compromises
Bypass rate
E-mail virus wall 1.00 1.00 0.20 1.00 Desktop firewall with antivirus software 0.10 1.00 0.10 0.10
Net bypass rate 0.10 1.00 0.00 0.10
Table 6. RROI for additional security solutions.
Proposed additional Residual risk Net benefit Cost RROI security solution (dollars) (dollars) (dollars) (percentage)
E-mail virus wall 164,840 142,760 75,000 190 Desktop firewall with antivirus software 63,370 119,230 200,000 60 Combined 41,594 66,006 275,000 24
because of IT security breaches.
However, such a challenge also occurs in other settings like physical, health, and environmen-tal risk assessment where human lives are at stake. The difficulty in placing a value on such risks does not jeopardize the use of ROI-based methods in those settings.
The implementation cost of the solutions can also be difficult to estimate because several solu-tions share resources, both human and machine, during implementation.The double counting of some costs can also result from vague definitions in accounting and operation processes.
Estimating bypass rates
The bypass rate for existing and proposed security solutions can be difficult to estimate because of minimal or nonexistent informa-tion. Currently, the most reliable sources of this
information are intrusion detection experts who have worked closely with the particular solution and have detailed knowledge of the current security system. This is especially true in evaluating new solutions that have no actual performance data. More recently, there have been developments in using honeypots—network traps set to attract attackers. Honeypots can help directly measure the potential frequency of incidents on certain types of networks, rather than using only estimates of bypass rates.
Compensating for interaction among solutions
In the example application of our framework, we assume the combined effectiveness of the various solutions to be multiplicative. The network architecture and the configu-ration of particular solutions can result in interactions that are too complicated to assess analytically. Such systems might instead require simulation models and methods, which are still under development.
Representing catastrophic losses
A constant challenge in risk assessment is the proper rep-resentation of catastrophic incidents. In our example, the estimates of costs, consequences, and frequencies are aver-ages or expected values.This process averaver-ages out rare but catastrophic events, instead focusing on frequent but typi-cally less-damaging events. So this process could potentially neglect infrequent incidents that have disastrous conse-quences.Though existing tools deal with these catastrophic events, they demand detailed information or
oversimplify-ing assumptions that often preclude applyoversimplify-ing them to IT security analysis.
T
here continue to be challenges in reliably estimating the costs and benefits of IT security solutions that go beyond the framework presented here. Changing technologies, both on the attack and defense fronts of IT security, and evolving network architecture can result in the continuous influx of new and untested security solu-tions. The prevailing economic climate also increases the demand for CIOs to be more prudent with IT security investments.Together, these forces make structured cost-benefit methods even more vital in evaluating and com-paring IT security solutions.However, for these same two reasons, uncertainties sur-rounding the current and future states of IT security con-tinue to hinder the reliable analysis of available solutions. On the other hand, current trends support the basic activ-ities of this risk-based framework. University-based initia-tives such as Cylab (http://www.cylab.cmu.edu), and industry consortia such as the Sustainable Computing Consortium, federally funded entities such as CERT/CC (http://www.cert.org), and independent organizations such as the Honeynet Project (http://project.honeynet.org) all continue to gather and provide updated and more reliable information on IT security threats, vulnerabilities, attacks, and outcomes.
Some of the methodological challenges that this frame-work exposes are not unique to IT. For example, other fields must analyze the sparse or otherwise disparate empirical data typical of IT security incidents. Thus, it might be
pos-These articles cover key topics in the evolving discussion of measuring the costs and benefits of IT security solutions.
➤ “The New Meaning of Quality in the Information Age,” C.K. Prahalad and M.S. Krishnan,Harvard Business Rev., Sept.-Oct. 1999, pp. 109-118.
➤ “Information Security: Why the Future Belongs to the Quants,” D. Greer Jr., K.S. Hoo, and A. Jaquith,IEEE
Secu-rity & Privacy, July-Aug. 2003, pp. 24-32.
➤ “Is Return on Security Investment (ROSI) Impossible?” Sygate Inc., 2002; http://china.sygate.com/solutions/request/ ROSI%20Whitepaper.pdf.
➤ “Finally, a Real Return on Security Spending,” S. Berinato, CIO, 15 Feb. 2002; http://www.cio.com/archive/021502/.
➤ “Calculating Security ROI is Tricky Business,” M.J. Wilson,
Computerworld, 24 July 2003, http://www.computerworld.
Rahul Telangis an assistant professor of information sys-tems at Carnegie Mellon University. Contact him at [email protected].
For further information on this or any other computing topic, visit our Digital Library at http://www.computer.org/ publications/dlib.
This article draws extensively on a risk assessment tech-nique developed at Lawrence Berkeley National Laboratory beginning in September 2000. Dennis Hall led the self-assess-ment effort and developed the technique for ranking security operations based on a quasi return-on-investment metric. A team performed data collection and analysis in collaboration with Jim Rothfuss, the laboratory’s manager of the Cyber Protection Program; and Dwayne Ramsey, the laboratory’s liai-son to the US Department of Energy.
This work was supported by the Director, Office of Science, Safeguards and Security Science, US Department of Energy, under contract nos. DE-76SF00098 and DE11 AC03-76SF00098. We also acknowledge partial support from the Software Industry Center and the Center for Communication and Computer Security (C3S) at Carnegie Mellon University.
sible to analyze such data using tools developed in other disciplines, such as medical testing, environmental protec-tion, and even antiterrorism. Overall, IT professionals are becoming better at managing security investment, and must continue exploring unconventional avenues such as risk management in addressing IT security.■
Ashish Arorais a professor of economics and public
pol-icy and serves as the codirector of the Software Industry Center at Carnegie Mellon University. Contact him at [email protected].
Dennis Hall is a cybersecurity consultant at Lawrence
Berkeley National Laboratory. Contact him at [email protected].
C. Ariel Pintois an assistant professor of engineering
man-agement and systems engineering at Old Dominion Uni-versity. Contact him at [email protected].
Dwayne Ramseyis the computer protection manager at
Lawrence Berkeley National Laboratory.