Foreign Resource Inflows and Domestic Revenue Mobilization in
Ethiopia: A Co-integration & Granger Causality Analysis
Fikadu Goshu (MBA, MSc)
Entrepreneurship Development Center- Ethiopia
Lead Business Development Service Advisor & Visiting Lecturer at Wollega University P-O-Box 675 Nekemte, Ethiopia.
Admassu Tesso (PhD)
Wollega University, Department of Economics, Ethiopia Abstract
This study examines the effect of foreign resource inflows and domestic revenue mobilization in Ethiopia over the period 1980 to 2014 using co-integration and vector error correction analysis. All the necessary time series tests such as stationary test, model sufficiency, integration test are conducted. The variables in the model are co-integrated and show long run relations. The empirical result from the model shows that aid and grant have positive effect on domestic revenue mobilization in the long run. Also, the granger causality analysis reveals that there is a bi-directional causal relationship between real GDP growth and domestic revenue mobilization in Ethiopia. This implies that the country has to give strong emphasis on domestic revenue mobilization for the sustainable economic development of the country. Therefore, aid recipient country like Ethiopia has to work hard on how to enhance domestic revenue raising capacity of the country which is at the heart of meeting the capital required for the sustainable economic growth and development in times of short falls and precariousness of external sources of finance.
Keywords: Domestic Revenue; Foreign Aid; Foreign Grant; External Borrowing; Ethiopia 1. INTRODUCTION
Developing countries face challenges of abject poverty, slow GDP growth, high mortality rates from illnesses, and low levels of education (Leeson, 2008; Kumler'07, 2007). The governments of these developing countries do not have sufficient financial resources to fight against these challenges effectively. Foreign aid plays a key role in the implementation of the development programs to combat these challenges (Pattillo, Polak, & Roy, 2007; Lohani'04, 2004). It is an important source of finance in most countries of sub-Sahara Africa where foreign aid supplements low savings, narrow export earnings and thin tax bases (Arellano, Bulíř, Lane, & Lipschitz, 2009; Bhattarai, 2007). It is the main source for government revenue in supplementing government expenditure. For many low income countries, aid could amount up to three times the level of their yearly domestic revenue (Gupta, Clements, Pivovarsky, & Tiongson, 2003).
During the period of 1980 to 2009, the amount of Official Development Assistance (ODA) to developing countries is on average between 3.7 and 6.7% of GDP and around 20 to 40% of average tax revenues (Bakhtiari, Izadkhasti, & Tayebi, 2013; Benedek, Crivelli, Gupta, & Muthoora, 2012). During this period, the average ODA to total revenue of Ethiopia is 37.6% and the average net ODA to GDP of Ethiopia is 5.92%. However, despite the percentage share of foreign aid is high in developing countries, it is much more volatile and unpredictable for the sustainable economic growth and development. The volatility of foreign aid grows with the degree of aid dependence (Gupta, Clements, Pivovarsky, & Tiongson, 2003).
As a result of volatility and unpredictable nature of the foreign aid, there has been an increasing emphasis given to domestic resource mobilization (DRM) for sustainable development financing. Domestic public resources are more stable and sustainable source of income and can also strengthen a legitimate relationship between citizens and the state and foster good governance. A greater emphasis is given to DRM for financing development strategies at the 2008 Doha Review Conference (Culpeper, 2008). Also, the 2015 Addis Ababa Accord reaffirmed the importance of DRM for financing sustainable development program in the post 2015. However, there is a great challenge in DRM in sub-Saharan Africa where there are low savings rates, high dependence on foreign aid and weak capacity of mobilizing domestic resources (Samy & Bhushan, 2012). In order to improve the challenges of DRM, donors provide technical assistance to developing countries which included reforms of tax legislation, simplification of tax structures and abolishment of some taxes and introduction of new ones (Fjeldstad, 2013).
Ethiopia is the second largest populous country in Africa, with an estimated population of nearly 82.9 million in 2009 and a growth rate of 2.2% per year (World Bank, 2013) that need sufficient social and economic infrastructural for the decent life. This requires significant financial outlays. In light of fulfilling the above public demands, the capacity of the country for enhancing the required level of investment and promotion of economic growth through domestic capital sources (revenue generation) and private capital inflow alone is far from adequate to finance government spending demand. As a result, foreign capital inflows are receiving due attention because
of their potential effect in financing these investments and perceived in promoting economic growth in the country. This is supported by exiting facts that the average ODA to total revenue of Ethiopia during the period of 1980 to 2014 is 35.9% which is almost approaching the maximum amount of average ODA to tax ratio of developing countries indicating country's dependence on eternal resources for government financing. Also, the average share of net ODA to GDP for the stated period is 5.59% which is very high when compared to the average of developing countries. This is also an indication for the country’s dependence on external source of finance for government spending.
Also, the relatively high share of ODA in government budgets in some countries has raised concerns about the detrimental effects of aid dependency on domestic revenue effort, spending programs and budget planning as well as institution building. (Bakoup, 2013; Fjeldstad, 2013). The scenario of high share of ODA in government budget is also true for Ethiopia as most as the ratio of foreign aid to government expenditure ranges between 14.1 to 41.5% with an average share of 23.53% of foreign aid to government expenditure during the period of 1980 to 2014. Moreover, the Government budgetary operation including grants during 2013/14 resulted in 27.4 billion Birr deficit that accounts for 2.6% of GDP. The deficit was financed through external and domestic borrowings of which 75% of the deficit was financed from external sources (NBE, 2014). This makes the importance of foreign aid indisputable to the performance of the economy in addition to domestically generated revenue. The following figure shows the ratio of ODA to Ethiopian GDP, ODA to government expenditure and ODA to to that of domestic revenue mobilization.
Figure 1: Percentage of ODA to GDP, government expenditure & domestic revenue mobilization
Source: Own computation based on data, 2015
Finally, existing literature on the effect of foreign aid on DRM tendency to segregate aid in to loan and grant elements based on the level of grant elements at its source. However, the difficulty arises at the destination where foreign aid (that includes grant and loan) is utilized in lump sum at the recipient country. In this case, it is difficult for separating the effects of each. Instead, the best option is to use data that the country treated separately on annual expenditure report as aid, grant and external borrowing. Moreover, the direction of the relationship between foreign aid, grant and external borrowing with DRM effort remains fundamentally empirical questions in which this paper tries to asses. Thus, this study tries to analysis the impact of foreign aid, external grant and net external borrowing on domestic revenue mobilization in Ethiopia.
This paper is organized in to five sections: section presents an introduction; section two discusses analytical framework of the study; section three discusses data set and methodology; section four presents result and discussion and the last section presents conclusion of the study.
2. ANALYTICAL FRAMEWORK OF THE STUDY
The relationship between foreign aid and domestic revenue is viewed in terms of government budget constraint in any given period (Gupta, Clements, Pivovarsky, & Tiongson, 2003). This is stated as:
Where GOV is government expenditure, REV is domestic revenue, AID is foreign aid, and NBO is net government borrowing. Differentiating equation (1) with respect to AID yields:
= + + … … … … … … . . …...… … … (2) Thus, for an exogenous increase in foreign aid, the response of a government could either be: reduce DRM; increase government expenditures; reduce borrowing to meet the budget constraint or choose a combination of the above alternatives. In the case of reducing DRM, the government chooses to pass the benefit of higher foreign aid inflows to the private sector by reducing DRM efforts. At the extreme, the government could decide to reduce this effort by the full amount of foreign aid while holding aggregate government expenditure and borrowings constant. That is:
= −1 !"# = 0 !"# = 0
In case when an increase in foreign aid increases government expenditures, the DRM may increase or decrease depending on the magnitude of the response of expenditure to foreign aid. If the increase in expenditure is smaller than the increase in the foreign aid, that is aid is fungible, or 0 < ⁄ < 1, holding borrowing unchanged,'. (. , ⁄ = 0), DRM effort would decline. If the expenditure increase is greater than an increase in foreign aid, i.e., ⁄ > 1, DRM should increase.
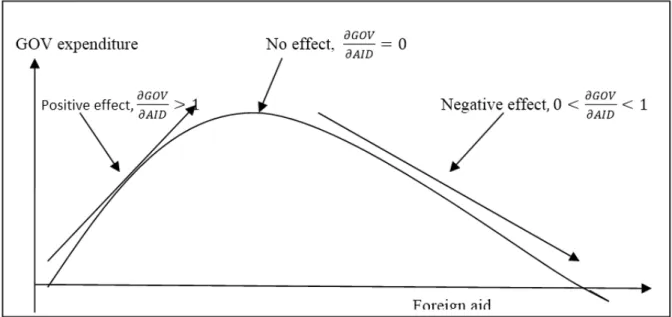
Figure 2: Graph of Aid laffer curve
Source: Own computation on the bases of the concepts
Finally, when an increase in foreign aid induces a decrease in borrowing, the government decides not to spend foreign aid, i.e., ⁄ = 0. This can happen when government builds up deposit with the financial system, so as to release resources for the private sector as well as for repayments of debt obligations. Thus, when viewed in terms of government budget constraints, the effect of DRM effort to an increased foreign aid flows could be positive, zero or negative. This can be presented by the following three scenarios:
1. The case of positive (increasing) effect of foreign aid on DRM i.e., > 1, holding borrowing unchanged; 2. The case of maximum effect of aid on DRM threshold i.e., = 0, No effect; and
3. The case of decreasing effect of foreign aid on DRM i.e.,0 < < 1 , increase in foreign aid decreases borrowing. The above three conditions can be presented by the above inverted U shape of Aid Laffer curve. 3. DATA SET AND METHODOLOGY
This section consists of three sub-sections. The first sub-section presents model specification followed by the second sub-section explaining source of data. This is followed by the final sub-section that presents econometric estimation techniques.
3.1. Model Specification
The econometric model used in this paper is based on the model applied by (Benedek, Crivelli, Gupta, & Muthoora, 2012; Bhushan & Samy, 2010; Gupta, Clements, Pivovarsky, & Tiongson, 2003). These authors have examined how aid may affect tax revenue. To this end they have considered tax revenue in relation to GDP as a function of aid, capturing potential non-linear effects by the squared term and including control variables such as GDP per
capita, agriculture in value added, industry value added, trade openness, inflation, external indebtedness, and quality of institutions. The model is specified as:
+ , = -.+ -/ + -0( )2 + -1 2 + -3( 2)2 + -4 + -5 + -6 7 + -8 + -9 + -/.2 + -// : + -/0 ;
+ -/1 , … … … . … . . (3)
Where; lDRM is total domestic revenue as percent of GDP in log form, AID is foreign aid as as percent of GDP, GRNT is grant as percent of GDP, EBO is net external borrowing as percent of GDP, DBO is net domestic borrowing as percent of GDP, RGDP is the growth rate of real GDP; AVA is agriculture value added as percent of GDP, IVA is industry value added as percent of GDP, TRDE is the sum of expor and import as percent of GDP, INF is inflation, and DM is the dumy variable for the two regim in Ethiopia where 1 stands for the period of 1992 to 2014 and 0 otherwise. Forien aid squred (AIDS) and grant squred (GRNTS) are genrated to cature the potential non-linear effects.
The control variables are drawn from previous studies of (Benedek, Crivelli, Gupta, & Muthoora, 2012; Bhushan & Samy, 2010; Gupta, Clements, Pivovarsky, & Tiongson, 2003) used in their analysis. The overall growth of the economy is measured by real GDP growth, is expected to show a positive correlation with revenue because of a higher degree of economic growth and institutional sophistication. A higher share of agriculture in value added is expected to be negatively associated with revenue because agriculture is harder to tax, particularly if carried out informally or on a subsistence basis in which Ethiopia is a typical case. By contrast, a higher industry value added in GDP is associated with higher revenues. The degree of trade openness, which is measured as the sum of the shares of imports and exports in GDP, can present either sign (Benedek, Crivelli, Gupta, & Muthoora, 2012). Other relevant control variables like inflation and net external borrowing (EBO) are included for additional robustness. Dummy variable is incorporated to capture the effect of revenue mobilization policy of Dergue and the current Ethiopian government policy.
3.2. Source and Type of Data
The data used in this study is extracted from two main sources: the world bank, world development indicator; and national bank of Ethiopia annual report. The dataset comprise of the period 1980 to 2014. Data on total DRM, RGDP growth, net domestic borrowing, grant and net external borrowing are drawn from National Bank of Ethiopia annual report annexes. Data on foreign aid, openness to trade (the sum of import and export to GDP), domestic saving mobilization, agricultural value added, industry value added, and inflation are collected from World Bank, World Development Indicator data.
3.3. Econometric Estimation Techniques
The standard estimation and hypothesis testing assumed that all variables, in particular regression, are stationary. However in reality most macroeconomic variables are non stationary. Therefore hypothesis testing and inference using such results will be invalid. To avoid such wrong inferences from the non stationary regressions, the time series property of the data should be checked prior to the estimation of the long run model through stationary test. Unit root test has become a widely popular approach to test for stationary and also used in this paper. In order to determine whether or not a long-run equilibrium relationship exists among the unit root variables, a co-integration test is conducted by residual base approach and the Johanson Maximum Likelihood Estimation procedure. Finally, following all the test of the data, ordinary least square method is used to determine the effect of foreign aid and grant on DRM in Ethiopia. All estimation of the empirical results is made by using STATA 10 software.
4. RESULTS AND DISCUSSIONS 4.1. Results of the Unit Root Test
Before proceeding to estimate the effect of foreign aid on DRM and economic growth in Ethiopia, it is necessary to investigate whether the data series is stationary in level, or stationary in differences. This helps for the easily applying of the correct methodology and at the same time to avoid any spurious inferences. The stationarity of the series is investigated by employing the Augmented Dickey-Fuller (ADF) unit root test. The augmentation is adding lagged values of first differences of the dependent variable as additional regressors which are required to account for possible occurrence of autocorrelation. Since unit root tests are sensitive to the presence of deterministic regressors, the three models (equation 4 to 6) are estimated in this paper and the ADF with drift (equ.6) is used in the decision of the unit root.
∆>?= @>?A/+ B CD∆>?AD E
DA/
∆>?= H + @>?A/+ B CD∆>?AD E DA/ + F?… … … . . … … … . … … … . … … … . (5) ∆>?= H + -2 + @>?A/+ B CD∆>?AD E DA/ + F?… … … . … … … . . … . . … … . … … … . (6)
Where, Yt is any variable in the model to be tested for stationarity, α is a constant (drift), T is a trend element, k
is the lag length, εt is an error term, and ∆ is the first difference operator. The null hypothesis of ADF is δ=0 against
alternative hypothesis that δ<0. Where δ=γ-1. A rejection of this hypothesis means that the time series is stationary or it does not contains a unit root while not rejecting means that the time series is non stationary (Enders, 1995). The result of unit root test is presented by annex 1. Considering the ADF with drift in the decision of stationarity level of the variables (annex 1), the test result shows that all the variables are covariance stationary at their respective level. The ADF test results proved that the hypothesis of unit root is rejected at 10% for log of domestic revenue and domestic saving. It is also rejected at 1% and 5% critical values for the other variables used in the model. This is confirmed by the calculated t-value which is grater (in absolute terms) than the corresponding critical values in model.
4.2. Results of the Co-integration Test
Before we examine the relationship between foreign resources (aid, grant) and DRM, variables are checked whether they are co-integrating or not. Co-integration means the regressions of one variable over the other is not meaning full. In other words, two variables will be co-integrated if they have a long-term, or equilibrium, relationship between them. Thus testing for co-integration is the same as testing for long run relationship (Gujarati, 2004). In this paper, the residual base approach that uses Engle-granger co integration test and Johansen Co-integration test is used for the determination whether the variables are co-integrated or not.
The Engle-granger co-integration test that uses the residual base approach for testing the co-integration of the variable first predicts the residual r, after OLS regression of the variables on the log of DRM as percent of GDP and tests for the stationarity of the residuals that are predicted from OLS regression. The unit root test of the residuals shows that they are significant at 10% level of significance by ADF test with drift at conventional level of significance. This indicates that, there is a long run relations among the variables of the DRM model. Table 1: Result of ADF unit root test for the residual r, in aid and grant the equations
Variables ADF with
no constant ADF with trend ADF with drift Stationary level
Residual r, of Aid equation -0.399 -1.769 -1.640* I(0)
Residual r, of Grant equation -0.428 -1.790 -1.604* I(0)
Mackinnon Critical value at 1% -2.646 -4.297 -2.449
5% -1.950 -3.564 -1.694
10% -1.604 -3.218 -1.309
Note: * represent variables are significant at 10% Mackinnon CV for rejection of hypothesis of a unit root. Moreover, in order to determine whether or not a long-run equilibrium relationship exists among the unit root variables in a given model, Johanson (1988) maximum likelihood estimation test procedure is used. First the general VAR model of relationship between the variables is formulated as follows:
K?= ɸ/K?A/+ ɸ0K?A0+ ⋯ + ɸNK?AN+ OP?
+ F?… … … . . … … … . … … … . . (7)
Where Xt is a (mx1) vector of stochastic I(1) variables, Wt is a (qx1) vector of deterministic variables (for instance
trend and dummy variables), and each ɸi (i=1….p) and Ψ are (mxm) and (mxq) matrices of parameters. εt is a
(mx1) vector of normally and independently distributed disturbances with zero mean and non-diagonal covariance matrix (vector of white noise disturbance terms), and t=1….T (T is the number of observation). Following the model 7, to identify the number of co-integrating vectors, the Johansen procedure provides n eigen values (λ) characteristic roots whose magnitude measures the degree of correlation of the co-integration relations with the stationary elements in the model. Two test statistics (trace and max) are used to test the number of co-integrating
vectors, based on the characteristic roots. The statistics are calculated from the following formula:
R?STUV= −2 B ɭ"X1 − RYDZ, [ = 0, 1, … . " − 1 \
D]S^/ … … … . . (8)
R`Ta = −2X1 − RYS^/Z … … … . . … … … . . … . . … … … . . … … … … . … . . … … … . (9) Where, T is the sample size, is the estimated eigenvalues. In Johanson procedure, the likelihood ratio (LR)
co-integrating vectors is less than or equal to r against an alternative of (r+1). The λmax statistics, on the other hand,
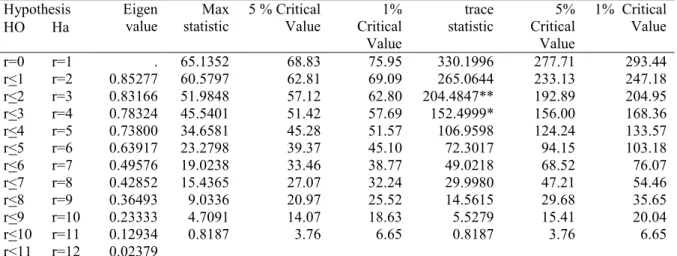
tests the null that the number of co-integrating vectors is r against an alternative of (r+1). The distribution of both test statistics follows chi-square distribution. The diagnostic test result (Table 2) of Johansen Co-integration test of DRM equation results confirms that the null of co-integration is rejected at 1% and 5% significance by max statistics while the alternative hypothesis that at least one co-integrating vector is not rejected by the trace statistics. Thus, the diagnostic tests shows that the model has passed by the two methods of co-integration tests and the confirms that the variables in the model have long run relationships.
Table 2: Johansen co-integration test for the number of co-integrating vectors Hypothesis Eigen value Max statistic 5 % Critical Value 1% Critical Value trace statistic 5% Critical Value 1% Critical Value HO Ha r=0 r=1 . 65.1352 68.83 75.95 330.1996 277.71 293.44 r<1 r=2 0.85277 60.5797 62.81 69.09 265.0644 233.13 247.18 r<2 r=3 0.83166 51.9848 57.12 62.80 204.4847** 192.89 204.95 r<3 r=4 0.78324 45.5401 51.42 57.69 152.4999* 156.00 168.36 r<4 r=5 0.73800 34.6581 45.28 51.57 106.9598 124.24 133.57 r<5 r=6 0.63917 23.2798 39.37 45.10 72.3017 94.15 103.18 r<6 r=7 0.49576 19.0238 33.46 38.77 49.0218 68.52 76.07 r<7 r=8 0.42852 15.4365 27.07 32.24 29.9980 47.21 54.46 r<8 r=9 0.36493 9.0336 20.97 25.52 14.5615 29.68 35.65 r<9 r=10 0.23333 4.7091 14.07 18.63 5.5279 15.41 20.04 r<10 r=11 0.12934 0.8187 3.76 6.65 0.8187 3.76 6.65 r<11 r=12 0.02379
Note: r denotes the number of co-integrating vectors. ** and * denotes rejection of the null hypothesis at 1% and 5% significance level. The number of lag used in the analysis is 2.
The multicolinearity test result shows that there is no such problem as variance inflation factor (vif) result for the model is 7.38 which is less than the normal acceptable standards. Also, the Breusch-Pagan /Cook-Weiberg test for the heteroskedasticity with the hypothesis of constant variance is rejected as the probability of chi2 is
insignificant. Finally, the model specification test that uses hat and hat2 shows that the model has no specification
problem.
4.3. Long Run Econometric Effects
4.3.1. Results of Foreign Aid and Domestic Revenue Function
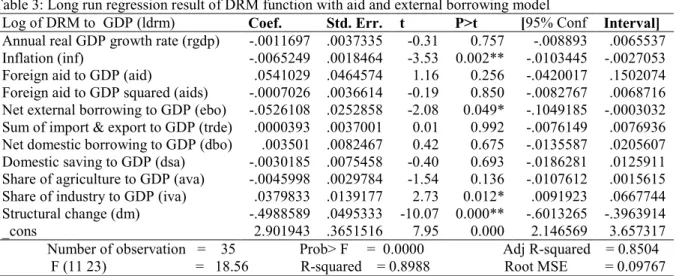
The ordinary least square estimation result in table 3 indicates that the explanatory variables have strong power in describing the variations. The adjusted R2 0.8504 implies that the explanatory variables account for about 85.04%
in the variations level of DRM along with foreign aid and external borrowing in Ethiopia. The F (11 23) = 18.56 with probability of F = 0.000 implies that all the variables are jointly significant in explaining variation in DRM with the foreign aid model.
When the explanatory variables considered, the estimation result shows that an increase in foreign aid as percent of GDP has an positive relationship on DRM in Ethiopia. The estimation result of the this analysis is supported by the study conducted by (Clist & Morrissey, 2011; Cashel-Cordo & Craig, 1990; Pack & Pack, 1990) for the period of 1980 to 2005 and find a positive relationship between aid and taxation. Foreign aid to percentage of GDP shows a non linear effect on DRM since level variable (foreign aid) is positive and the squared variable (foreign aid squared) gives a negative effect on DRM. The result of the study is consistence with the study conducted by (Gupta, Clements, Pivovarsky, & Tiongson, 2003). However, net external borrowing is associated with significant declining effect on DRM at 5% level of significance. The result of the this study is in line with study conducted by (Benedek, Crivelli, Gupta, & Muthoora, 2012) in which they have find negative relationship and significant result for Africa. This is probability due to the fact that external borrowing substitutes for recurrent revenue for deficit financing by the government.
Table 3: Long run regression result of DRM function with aid and external borrowing model
Log of DRM to GDP (ldrm) Coef. Std. Err. t P>t [95% Conf Interval] Annual real GDP growth rate (rgdp) -.0011697 .0037335 -0.31 0.757 -.008893 .0065537 Inflation (inf) -.0065249 .0018464 -3.53 0.002** -.0103445 -.0027053 Foreign aid to GDP (aid) .0541029 .0464574 1.16 0.256 -.0420017 .1502074 Foreign aid to GDP squared (aids) -.0007026 .0036614 -0.19 0.850 -.0082767 .0068716 Net external borrowing to GDP (ebo) -.0526108 .0252858 -2.08 0.049* -.1049185 -.0003032 Sum of import & export to GDP (trde) .0000393 .0037001 0.01 0.992 -.0076149 .0076936 Net domestic borrowing to GDP (dbo) .003501 .0082467 0.42 0.675 -.0135587 .0205607 Domestic saving to GDP (dsa) -.0030185 .0075458 -0.40 0.693 -.0186281 .0125911 Share of agriculture to GDP (ava) -.0045998 .0029784 -1.54 0.136 -.0107612 .0015615 Share of industry to GDP (iva) .0379833 .0139177 2.73 0.012* .0091923 .0667744 Structural change (dm) -.4988589 .0495333 -10.07 0.000** -.6013265 -.3963914
_cons 2.901943 .3651516 7.95 0.000 2.146569 3.657317
Number of observation = 35 Prob> F = 0.0000 Adj R-squared = 0.8504 F (11 23) = 18.56 R-squared = 0.8988 Root MSE = 0.09767 Note: ** and * represent variables are significant at 1%, and 5% level of significance respectively
Also, when we turn to the control variables of the model, the estimation result confirms that the structure of the economy matters in DRM in Ethiopia. The share of agricultural value added to GDP is negatively related to DRM. The share of industry value added to GDP exhibit positive and significant relationship at 5% level of significance. The result of the study was supported by the study conducted by (Benedek, Crivelli, Gupta, & Muthoora, 2012). Openness to trade policy of Ethiopia has also exhibit a positive relationship with DRM. This was also supported by the study conducted (Rodrik, 1998) that finds trade taxes are easier for developing countries to collect and those countries with lower trade openness have positive relationship between trade openness and revenue mobilization. Lastly, shocks in inflation highly depict a negative relationship on DRM significantly at 1% level of significance. The dummy variable that is incorporated to capture the effect of policy actions of Dergue and EPRDF on revenue mobilization shows significant negative relationship on the DRM model of foreign aid to percentage of GDP in Ethiopia. This shows the structural break has a significant enough to cause a major change in DRM in Ethiopia. This may be due to the political ideology that Ethiopia has followed during the Derge regime which was a centralized economic system, where the state played a major role in all spheres of economic activity. During the Derge regime, as the policy is not open to external resources like foreign direct investment, aggressive domestic revenue mobilization which accounts 9% to around 26% of GDP for fulfilling its financial need. But, the domestic revenue mobilization percent of GDP in the EPRDF is relatively less than that of the Derge ideology due to the increase in GDP of the country as well as different tax policy that encourages foreign direct investment by tax relief policy.
4.3.2. Results of Grant and Domestic Revenue Mobilization Function
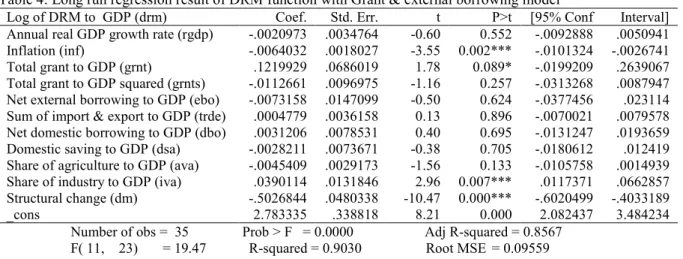
The regression result in table 4 indicates that the explanatory variables power is very strong. The adjusted R2 which
is 0.8567 implies that the explanatory variables account for about 85.67% in the variations level of DRM in Ethiopia. The F (11, 23) = 19.47 with probability of F = 0.000 implies that all the variables are jointly significant in explaining variation in DRM in the model with grant and external borrowing in Ethiopia.
The result of the explanatory variables in DRM with the grant as percentage of GDP model shows that grant has a positive and significant effect at 10% level of significance on DRM in Ethiopia. The result of the study is in line with the study conducted by (Otim, 1996) that finds grant and loan increase tax effort. The foreign grant shows a non linear effect on DRM as the level variable (foreign grant) is positive and the squared variable (foreign grant squared) is negative. This is in line with the study conducted by (Tuffour, 2013) that states doubling of grants as a share of GDP is associated with a decline in revenue in percent of GDP. This shows that DRM initially increases as foreign grant increases but starts to fail after certain point.
Table 4: Long run regression result of DRM function with Grant & external borrowing model
Log of DRM to GDP (drm) Coef. Std. Err. t P>t [95% Conf Interval] Annual real GDP growth rate (rgdp) -.0020973 .0034764 -0.60 0.552 -.0092888 .0050941 Inflation (inf) -.0064032 .0018027 -3.55 0.002*** -.0101324 -.0026741 Total grant to GDP (grnt) .1219929 .0686019 1.78 0.089* -.0199209 .2639067 Total grant to GDP squared (grnts) -.0112661 .0096975 -1.16 0.257 -.0313268 .0087947 Net external borrowing to GDP (ebo) -.0073158 .0147099 -0.50 0.624 -.0377456 .023114 Sum of import & export to GDP (trde) .0004779 .0036158 0.13 0.896 -.0070021 .0079578 Net domestic borrowing to GDP (dbo) .0031206 .0078531 0.40 0.695 -.0131247 .0193659 Domestic saving to GDP (dsa) -.0028211 .0073671 -0.38 0.705 -.0180612 .012419 Share of agriculture to GDP (ava) -.0045409 .0029173 -1.56 0.133 -.0105758 .0014939 Share of industry to GDP (iva) .0390114 .0131846 2.96 0.007*** .0117371 .0662857 Structural change (dm) -.5026844 .0480338 -10.47 0.000*** -.6020499 -.4033189
_cons 2.783335 .338818 8.21 0.000 2.082437 3.484234
Number of obs = 35 Prob > F = 0.0000 Adj R-squared = 0.8567 F( 11, 23) = 19.47 R-squared = 0.9030 Root MSE = 0.09559
Note: ***, ** & * represent variables are significant at 1%, 5% & 10% level of significance respectively
When control variables in the DRM with the grant model are considered, the estimation result confirms that the structure of the economy also matters in DRM along with grant in Ethiopia. The share of agricultural value added to GDP is negatively related to DRM as in the case of foreign aid model. The share of industry value added to GDP also exhibits a positive relationship at 1% level of significance. Econometric result of the two model exhibits existing reality what other researchers such as (Benedek, Crivelli, Gupta, & Muthoora, 2012) have previously reported in their work. Lastly, shocks in inflation highly depict an declining effect on DRM along with grant as the case of model with foreign aid. Inflation affects DRM significantly at 1% level of significance. This means that it is important to curtail inflation in order to avoid its negative and harmful effect on DRM in Ethiopia. Ironically, the magnitude of inflation on DRM is almost the same in case of DRM model of foreign aid and grant but the significance of the effect is highest in the model of DRM of foreign grant. Also, the dummy variable that is incorporated to capture the effect of policy actions of Dergue and EPRDF on DRM shows significant negative relationship on the DRM model of grant to percentage of GDP in Ethiopia. This shows the structural break has a significant enough to cause a major change in DRM in Ethiopia. The magnitude is relative high in case of DRM model of grant as percentage of GDP than that of DRM of foreign aid percentage of GDP model.
4.4. Discussion of Short Run VECM Results
Obtaining long run estimates of co-integration relationships is only the first step for estimating the complete model. The short run structure of the model is also important in terms of the information it conveys on the short run adjustment behavior of economic variables. The analysis of short-run dynamics is often done by first eliminating trends in the variables by differencing that throws away potential valuable information about long run relationships of the variables. Vector error correction model (VECM) enables to capture the short run dynamics of the model which is formulated based on the identified long run relationships. The co-integrating term is known as the error correction term since the deviation from long run equilibrium is corrected gradually through a series of partial short run adjustments. Using the variables of our interest in the model a system of equations is developed that portray the VECM. Hence, the general VECM model for DRM with foreign aid and foreign grant model is specified as follows: ∆+ , = H.+ B H/∆ 7 0 D]/ + B H0∆ 0 D]. + B H1∆ : 0 D]. + B H3∆ ; 0 D]. + B H4∆ + B H5∆ + B H6∆ + B H8∆ 0 D]/ 0 D]/ 0 D]/ 0 D]. + B H9∆2 0 D]. + H/. ,?+ H// c2!?A/ + ?… … … . . … … … … . … … … . . (10)
Using the above ECM specifications, a short run dynamic equation is estimated for aid and grant model at a lag length of two. The optimal lag length is determined using Akakie Information Criteria (AIC). The model can be estimated by least square method since all the variables included in the model are stationary.
4.4.1. Short Run Results of Foreign Aid and Domestic Revenue Function
The result of the study in DRM of aid model reveals that the independent variables explain nearly 98.61% of the change in dynamic model of DRM to aid relationship equation. The test result confirms that the model is well specified and the regression analysis is adequate. The diagnostic tests show that the null of tests are not rejected except for the joint insignificance of the explanatory variables. The DRM and aid model result shows the error
study is similar to earlier study conducted by (Tuffour, 2013) in Ghana. Net external borrowing as percent of GDP has also a negative relationship with DRM as the external borrowing can substitutes the aid in government expenditure.
Table 5: Result of the short run model of DRM with foreign aid at their first difference (d)
Variables in DRM and aid equation Coef. Std. Err. t P>t [95% Conf Interval] Annual real GDP growth rate (drgdp) -.0106011 .0588942 -0.18 0.859 -.1324332 .1112309 Foreign aid to GDP (daid) .2951474 .7653208 0.39 0.703 -1.288039 1.878334 Foreign aid to GDP squared (daids) -.0057553 .0585603 -0.10 0.923 -.1268965 .115386 Sum of import & export to GDP (dtrde) .0309368 .0591893 0.52 0.606 -.0915055 .1533792 Net domestic borrowing to GDP (ddbo) -.0150399 .1321876 -0.11 0.910 -.2884907 .258411 Net external borrowing to GDP (debo) -.1741809 .3977844 -0.44 0.666 -.9970606 .6486988 Domestic saving to GDP (ddsa) .0834493 .1190416 0.70 0.490 -.1628071 .3297056 Share of agriculture to GDP (dava) .0394396 .0447348 0.88 0.387 -.0531015 .1319807 Share of industry to GDP (diva) -.1591129 .2444153 -0.65 0.522 -.6647244 .3464987 Major structural change (dm) -.5527541 2.331565 -0.24 0.815 -5.375963 4.270455
ECT-aid 14.53106 4.524747 3.21 0.004* 5.170904 23.89121
_cons -28.5638 12.88745 -2.22 0.037 -55.22352 -1.904085
Number of obs = 35 Prob > F = 0.0000 Adj R-squared = 0.8566 F( 11, 23) = 19.47 R-squared = 0.9030 Root MSE = 1.5617 Note: * represent variables is significant at 1 % level of significance. The d indicates first difference
When the control variables of the model are considered, openness to trade shows the expected sign of positive relationship with DRM. This indicates that as the Ethiopian policy openness's to external trade (import and exports transactions) is increased, the level of DRM from the external trade also increases. In the short run, net domestic borrowing and DRM shows a negative relationship which is an expected sign. This is implies that as the level of DRM by the country is increases, the level of net domestic borrowing from financial institution by the government for financing recurrent budget declines.
4.4.2. Short Run Results of Grant and Domestic Revenue Function
In the short run, inflation is dropped from the model. The estimation result in table 6 indicates that the explanatory variables power is very strong. The adjusted R2 which is 0.8567 implies that the explanatory variables account for
about 85.57% variations level of DRM along with grant and external borrowing in Ethiopia which is almost the same to the case of long run estimation results. The F (11, 23) =19.47 with probability of F =0.000 implies that all the variables are jointly significant in explaining variation in DRM at their differenced level. In the DRM model with grant model, the result of the error correction variable shows a significant and positive in the model. The foreign grants to GDP have a negative effect on DRM in the short run. The result of the study is in line with earlier study conducted by (Benedek, Crivelli, Gupta, & Muthoora, 2012) who have estimated through disaggregating countries in income groups and by regions.
Table 6: Result of the short run model of domestic revenue with foreign grant
Variables in DRM and grant equation Coef. Std. Err. t P>t [95% Conf Interval] Annual real GDP growth rate (drgdp) -.0009469 .0559029 -0.02 0.987 -.1165909 .1146972 Sum of import & export to GDP (dtrde) .0274121 .0596177 0.46 0.650 -.0959166 .1507407 Net domestic borrowing to GDP (ddbo) -.0069185 .1288205 -0.05 0.958 -.273404 .2595669 Net external borrowing to GDP (debo) .0422172 .2300059 0.18 0.856 -.4335862 .5180206 Domestic saving to GDP (ddsa) .0812114 .1191012 0.68 0.502 -.1651681 .3275909 Foreign grant to GDP (dgrnt) -.2364948 1.246584 -0.19 0.851 -2.815251 2.342261 Foreign grant to GDP squared (dgrnts) .066666 .1676397 0.40 0.695 -.280123 .4134551 Share of agriculture to GDP (dava) .0382737 .0447844 0.85 0.402 -.05437 .1309174 Share of industry to GDP (diva) -.1705991 .2429846 -0.70 0.490 -.6732511 .3320529 Major structural change (dm) -.5982168 2.383158 -0.25 0.804 -5.528155 4.331721 ECT-grant 14.46317 4.613743 3.13 0.005* 4.918917 24.00743
_cons -27.37671 12.79945 -2.14 0.043 -53.85439 -.8990351
Number of obs = 35 Prob > F = 0.0000 Adj R-squared = 0.8557 F( 11, 23) = 19.47 R-squared = 0.9024 Root MSE = 1.5665 Note: * represent variables is significant at 1% level of significance
Also, an increase in the net external borrowing can increases DRM as the resources acquired through loan can complement fiscal performances of the country. Similarly, an increase in foreign grant percent of GDP shows a negative relationship as domestic borrowing substitute grant in case the foreign aid is unpredictable in government expenditure. This econometric estimation results confirms the assumption of government budget constraints in which an increase in aid (as in the form of grant) decreases borrowing. This probably implies that foreign grant can substitute domestic revenue in government deficit financing.
4.5. Granger Causality Analysis
The idea of Granger causality as described in (Granger, 1969) is based on the principle that a cause cannot come after its effect. A test for causality is performed on variables of interest to detect the presence and direction of causality between pair of variables. The pair of the variables of interest are DRM and foreign aid, DRM and foreign grant, DRM and external borrowing, and DRM and real GDP growth variables. The VECM that helps to analyze the causal relationship between DRM and the variable of interest is specified as follows:
∆ , = B -[D∆ ,?A/ E D]/ + B -!D∆ ?AD+ dK?A/+ F?… … … . … … … . . (11 ) e D]. ∆ = B C!D∆ ?A/ E D]/ + B C[D∆ ,?AD+ @>?A/+ f?… … … . . (11 ) e D].
Where (βri, Өri) and (βai, Өai) are coefficients of the differenced (lagged) terms of domestic revenue to
GDP and foreign aid to GDP respectively, (Xt-1, Yt-1) is the one period lagged error correcting term for domestic
revenue to GDP and foreign aid to GDP respectively. And (εt, f?) are white noise error terms. Equation 11A and
11B are used to test all the variable of interest.
Causality inferences among the pairs of variables in the above models are based upon estimating the parameters of the model, subject to the predetermined number of co-integrating vectors in the model. For the domestic revenue to GDP with aid equation (11A), the null hypothesis is that “DRM does not Granger cause foreign aid” whereas “Foreign aid to GDP does not Granger DRM” is the null for the foreign aid equation (11B). Rejection of the null of the equation indicates the presence of causality from DRM to foreign aid, or alternatively foreign aid to DRM. Furthermore, the short run and long run causality can be discriminated for each equation. Absence of causality in the short run implies that the lagged coefficient values of the first difference terms of the relevant causal variable in the VECM are jointly insignificant. The long run causality test is made by imposing zero restriction on the respective adjustment parameters of each equation. The co-integration test result was summarized as follows.
Table 7: Johansen co-integration test for the causality test detection Ho: (null
Hypothesis)
Co-integration test between log DRM and foreign aid Eigen value
(λi)
λmax Statistic
Critical value λtrace Statistic Critical value 5% 1% 5% 1% r= 0 10.3566 14.07 18.63 15.4168 15.41 20.04 r=1 0.26936 5.0602* 3.76 6.65 5.0602* 3.76 6.65 r=2 0.14216
Co-integration test between log DRM and net external borrowing
r= 0 13.2570 14.07 18.63 17.8919 15.41 20.04
r=1 0.33084 4.6349* 3.76 6.65 4.6349* 3.76 6.65
r=2 0.13103
Co-integration test between log DRM and foreign grant
r= 0 7.3493 14.07 18.63 12.8808 15.41 20.04
r=1 0.19965 5.5315* 3.76 6.65 5.5315* 3.76 6.65
r=2 0.15433
Co-integration test between log DRM and real annual GDP growth
r= 0 20.9765 14.07 18.63 27.1392 15.41 20.04
r=1 0.47041 6.1627* 3.76 6.65 6.1627* 3.76 6.65
r=2 0.17035
Note: * denotes the significance of the variables at 5% level of significance
The Johansen co-integration tests for the causality test detection result of log DRM with foreign aid, external borrowing, foreign grant and real GDP growth analysis of variables reveals that the null of no co-integration is rejected at 5% level of significance whereas the alternative hypothesis that at least one co-integrating vector is not rejected by both λmax and λtrace statistics. This suggests that there is a precisely co-integrating vector
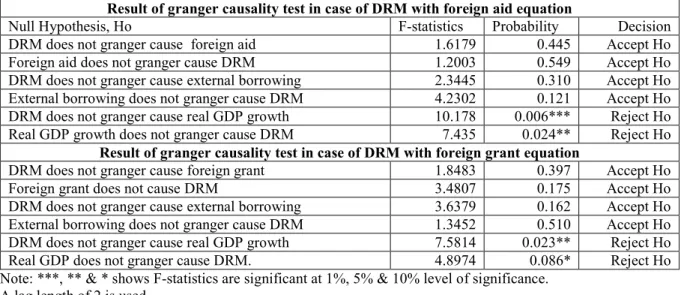
in the estimated model. Based on the estimation result of Granger causality test conducted, the hypotheses that states DRM does not granger cause foreign aid and vice versa; DRM does not granger cause foreign grant and vice versa; and DRM does not granger cause net external borrowing and its vice versa are accepted. Theoretically, DRM is not supposed to influence the follow of foreign resources (foreign aid, foreign grant and net external
borrowing) except under certain condition such as matching funds (Tuffour, 2013). This is confirmed by the Granger causality test results of our analysis.
Table 8: Pair wise Granger causality tests
Result of granger causality test in case of DRM with foreign aid equation
Null Hypothesis, Ho F-statistics Probability Decision
DRM does not granger cause foreign aid 1.6179 0.445 Accept Ho Foreign aid does not granger cause DRM 1.2003 0.549 Accept Ho DRM does not granger cause external borrowing 2.3445 0.310 Accept Ho External borrowing does not granger cause DRM 4.2302 0.121 Accept Ho DRM does not granger cause real GDP growth 10.178 0.006*** Reject Ho Real GDP growth does not granger cause DRM 7.435 0.024** Reject Ho
Result of granger causality test in case of DRM with foreign grant equation
DRM does not granger cause foreign grant 1.8483 0.397 Accept Ho
Foreign grant does not cause DRM 3.4807 0.175 Accept Ho
DRM does not granger cause external borrowing 3.6379 0.162 Accept Ho External borrowing does not granger cause DRM 1.3452 0.510 Accept Ho DRM does not granger cause real GDP growth 7.5814 0.023** Reject Ho Real GDP does not granger cause DRM. 4.8974 0.086* Reject Ho Note: ***, ** & * shows F-statistics are significant at 1%, 5% & 10% level of significance.
A lag length of 2 is used.
The hypothesis of DRM does not granger causes real GDP growth was rejected. The result of the econometric result indicates that DRM seems more significant in determining real GDP growth of Ethiopia relative to foreign aid, foreign grant and net external borrowing. The causal link between DRM and real GDP growth is sensitive. It is observed that there is bidirectional causality between the two variables. In case of DRM with foreign aid model, DRM Granger cause real GDP growth at 1% level significance whereas real GDP growth granger causes DRM at 5% level of significance. However, the sensitivity of causality is less in the analysis of DRM along with foreign grant. That is, DRM Granger causes real GDP growth at 5% level of significance whereas real GDP growth Granger causes DRM at 10% level of significance in Ethiopia. The econometric estimation result of this study shows that DRM is critical for the economic growth that foreign resource inflows. This is supported by the bi-directional causality of DRM and economic growth causation as compared to external resources inflow and economic growth in Ethiopia.
5. CONCLUSION
Foreign resource remained an important source of finance for capital scarce countries and continued to play a significant role in financing their development needs where there are low saving rates, high dependency on foreign aid and week capacity of mobilizing domestic revenue. However, foreign resources are volatile and unpredictable whose volatility growth with the degree of aid dependence. As a result, there has been an increasing emphasis on DRM for financing the sustainable economic development agenda of the country. The paper has tried to examine the impact of foreign aid, foreign grant and external borrowing on DRM. The study makes use of an annual data covering the period 1980 to 2014 using co-integration, vector error correction model and causality analysis.
Since co-integration necessitates the variables to be stationery, the data series is tested for unit root and the result found indicated that all the variables are stationary at level i.e. I(0). We run a test for co-integration by residual approach and Johansen co-integration test for the grant and aid model and the result suffice the presence of long run relationship among the variables in the model. The result from the long run and short run foreign aid equation revealed that aid contributed positively to domestic revenue generation at level and negatively affect when squared. Also, the result of the grant model reveals that foreign grant have positive impact at level and negative impact when the squared on DRM in the long run and the negative in the short run. The net external borrowing is negatively affects DRM both in the short and long run analysis and appeared to be insignificant. Causality tests among pairs of variables of interest are addressed in grant and aid model. The causality test result between real GDP growth and DRM indicates the existence of bi-directional causality between the two variables. The causal relationship of aid and DRM model is stronger when compared to the grant and DRM model.
Foreign aid remained an important source of finance for capital scarce countries & continued in financing development needs as in the case of Ethiopia. The result from the study confirms that aid contributed positively to domestic revenue mobilization both in the short run and in the long run. The causality test result between DRM and real GDP growth indicates the existence of bi-directional causality between the two variables. Also there is no causal relationship between foreign aid, grant and external borrowing with DRM indicating as strong emphasis has to be given for the domestic revenue mobilization than to relay on external resources. This gives some important indication for policy makers and researchers in the areas of foreign resources and DRM providing more
strong emphasis on DRM than foreign resources. This is due to the fact that DRM is indispensible for the economic growth of the country as domestic revenue is more stable and sustainable source of income than foreign resources and can also strengthen the legitimate relationship between citizen of the country and foster good governance in the Ethiopia.
Therefore, there is an implication that there has to be an incentive mechanisms to be designed by government that motivates researchers and policy makers of the country for the creation of a deep insight about the impact of DRM and its importance at all level. Mechanisms that improve efficient and effective utilization of foreign resources (aid, grant and external borrowing) for revenue mobilization and economic growth have to be designed. This may enable the country to finance its expenditure from domestically mobilized resources and hence less dependence on foreign resources to meet the development needs of the country.
References
Arellano, C., Bulíř, A., Lane, T., & Lipschitz, L. (2009). The dynamic implications of foreign aid and its variability. Journal of Development Economics , 88, 87–102.
Bakhtiari, S., Izadkhasti, H., & Tayebi, S. K. (2013). Crowding out Effect of Foreign Aid in Selected Developing Countries: Panel Data Evidence. Iran Economic Revew , 17 (2), 51-64.
Bakoup, F. (2013, January). Promoting Economic Reforms in Developing Countries Rethinking Budgetary Aid? African Development Bank Group Working Paper No. 167 .
Benedek, D., Crivelli, E., Gupta, S., & Muthoora, P. (2012, July). Foreign Aid and Revenue: Still a Crowding Out Effect? International Monetary Fund Working Paper WP/12/186 .
Bhattarai, B. P. (2007). Foreign Aid and Government’s Fiscal Behaviour in Nepal: An Empirical Analysis. Economic Analysis & Policy , 37 (1), 41-60.
Bhushan, A., & Samy, Y. (2010). Enhancing Domestic Resource Mobilization for Effective Development: Role of the Donor Community. Ottawa: The North-South Institute.
Cashel-Cordo, P., & Craig, S. (1990). The Public Sector Impact of International Resource Transfer. Journal of Development Economics , 32 (2), 17-42.
Clist, P., & Morrissey, O. (2011). Aid and Tax Revenue: Signs of a Positive Effect since the 1980s. Journal of International Development , 23, 165–80.
Culpeper, R. (2008). Enhancing Domestic Resource Mobilization: G-24 Policy Brief No. 25. The North-South Institute.
Enders, W. (1995). Applied Econometric Time Series . New York: John Wiley and Sons Inc .
Fjeldstad, O.-H. (2013). Taxation and development:A review of donor support to strengthen tax systems in developing countries. WIDER Working Paper No. 2013/010 .
Granger, C. (1969). Investigating causal relations by econometric models and crossspectral methods. Econometrica , 37 (3), 424–438.
Gujarati, D. (2004). Basic Econometrics (4 ed.). New York: McGraw-Hill Companies.
Gupta, S., Clements, B., Pivovarsky, A., & Tiongson, E. (2003). Foreign Aid and Revenue Response: Does the Composition of Aid matter IMF Working Paper WP/03/176. International Monetary Fund.
Kumler'07, T. J. (2007). The Impact of Foreign Aid on Development and Aggregate Welfare in Developing Countries. Department Honors Projects Paper 19 .
Leeson, P. T. (2008). Escaping Poverty: Foreign Aid, Private Property, and Economic Development. The Journal of Private Enterprise , 23 (2), 39-64.
Lohani'04, S. (2004, April 22). Effect of Foreign Aid on Development: Does More Money Bring More Development? Research Honors Paper Projects Paper 18. Department ofEconomics Illinois Wesleyan University .
NBE. (2014). The Overall Economic Performance of Ethiopia: Annual Report 2013/14. Addis Ababa: National Bank of Ethiopia.
Otim, S. (1996). Foreign aid and Government Fisical behaviour in low income South Asian Countres. Applied Economics , 28, 927-33.
Pack, H., & Pack, J. R. (1990). Is foreign aid fungible? the case of Indonesia. Economic Journal , 100 (399), 188– 194.
Pattillo, C., Polak, J., & Roy, J. (2007). Measuring the Effect of Foreign Aid on Growth and Poverty Reduction or The Pitfalls of Interaction Variables. International Monetary Fund Working Paper WP/ 07/145 . Rodrik, D. (1998). Why Do More Open Economies have Bigger Governments. Journal of Political Economy ,
106 , 997–1032.
Samy, Y., & Bhushan, A. (2012). Aid and Taxation: Is Sub-Saharan Africa Different? Ottawa: The North South Institute.
World Bank. (2013). Africa Development Indicators 2012/13. Washington, DC: World Bank. Annex: Results of ADF unit root test for variables used in the DRM model
Variables ADF with no
constant ADF with trend ADF with drift Stationary level Log of domestic revenue to GDP (lDRM) -0.406 -1.715 -1.486* I(0)
Foreign aid to GDP (AID) -1.066 -3.269* -3.150*** I(0)
Foreign aid to GDP squared (AIDS) -1.864* -3.180 -3.139*** I(0)
Total grant to GDP (GRNT) -1.192 -3.229* -3.353*** I(0)
Total grant to GDP squared (GRNTS) -2.234** -3.828** -3.390*** I(0) Net external borrowing to GDP (EBO) -1.423 -3.504* -3.216*** I(0) Annual real GDP growth rate (RGDP) -2.957*** -5.134*** -4.253*** I(0)
Openness (TRDE) 0.063 -3.087 -2.515*** I(0)
Agricultural value added to GDP (AVA) -0.964 -3.840** -1.924** I(0) Industry value added to GDP (IVA) 0.123 -3.631** -2.284** I(0)
Inflation (INF) -3.196*** -4.951*** -4.514*** I(0)
Net domestic borrowing to GDP (DBO) -2.401** -4.364*** -3.787*** I(0) Domestic saving mobilization to GDP (DSA) 0.027 -2.485 -1.435* I(0) Mackinnon Critical value at 1% -2.646 -4.297 -2.449
5% -1.950 -3.564 -1.694
10% -1.604 -3.218 -1.309
Note: ***, **, and * represent variables are significant at 1%, 5% and 10% Mackinnon critical values for rejection of hypothesis of a unit root respectively.