Integrating Rate Based Models into Multi-Objective
Optimisation of Process Designs using Surrogate Models
Sinan L. Teske a, Ivo Couckuyt b, Tilman J. Schildhauer c, Serge M.A. Biollaz c and François Maréchal d
a Paul Scherrer Institut, Villigen PSI, Switzerland, [email protected], CA b Department of Information Technology, Ghent University-iMinds, Ghent, Belgium,
c Paul Scherrer Institut, Villigen PSI, Switzerland, [email protected], [email protected] d École Polytechnique Fédérale de Lausanne, Lausanne, Switzerland, [email protected] Abstract:
Multi-objective optimisation (MOO) of super-structured process designs are expensive in CPU-time because of the high number of potential configurations and operation conditions to be calculated. Thus single process units are generally represented by simple models like equilibrium based (chemical or phase equilibrium) or specific short cut models. In the development of new processes, kinetic effects or mass transport limitations in certain process units may play an important role, especially in multiphase chemical reactors. Therefore, it is desirable to represent such process unit by experimentally derived RBMs (rate based models) in the process flowsheet simulators used for the extensive MOO. This increases the trust engineers have in the results and allows enriching the process simulations with newest experimental findings. As most RBMs are iteratively solved, a direct incorporation would cause higher CPU-time that penalises the use of MOO. A global surrogate model (SUMO) of a RBM was successfully generated to allow its incorporation into a process design & optimisation (PDO) tool which makes use of an evolutionary MOO. The methodology was applied to a fluidised bed methanation reactor in the process chain from wood to Synthetic Natural Gas (SNG). Two types of surrogate model, an ordinary Kriging interpolation and an artificial neural network, were generated and compared to its underlying rate based model and the chemical equilibrium model. The analysis showed that kinetic limitations have significant influence on the result already for standard bulk gas chemical components. From experimental experience it can be stated that a significant amount of chemical compounds, which are near to complete conversion according the thermodynamic equilibrium, are measured in the gas phase after the reactor. Thus including RBMs in PDO improves the quality of results. This approach allows a significant improvement of information exchange between process design & optimisation workflow and experimental development of PUs in early stages of process development.
Keywords:
Artificial neural networks, Kriging, Multi-objective optimisation of super-structured process designs, Rate based model, Reactive bubbling fluidised bed kinetics, Surrogate modelling.
1. Introduction
Constantly increasing demands in energy and resource efficiency as well as sustainability goals are asking for faster development of more efficient energy conversion processes. Therefore, it is important to be able to compare process concepts with each other and to classify them not only according to their technological, but also to their economic and ecologic performances. In the development of process concepts, the engineers are mostly confronted with a number of alternative technologies for the selected process steps. Generally, flowsheeting software allows to set up and calculate the technology combinations (process designs) separately at one pass. Thus, comparing different sets of technology combinations and operation conditions in a non-automised way is very time consuming or even not realistically applicable.
In contrast, an generic approach has the potential to be less time consuming. Such an generic methodology for process synthesis and optimisation has been developed at EPFL
[1,2]. A so called super-structure is defined that includes all desired technology alternatives and all desired interconnections of the different process steps and is automatically calculated using an evolutionary multi-objective optimisation method which is able to consider thermodynamic, economic and ecological process performance. This methodology allows separate modelling of the thermodynamic conversions and the energy integration of the different predefined process designs. Its integration with cost estimation procedures allows to systematically generate a set of best process designs (flowsheets) to efficiently eliminate solutions that are not worth investigating in detail, and to identify the most promising operation conditions [1].
Multi-objective optimisation of super-structured process designs in energy and process engineering is however expensive in CPU-time since a very large number of potential configurations and operation conditions has to be calculated. The number of process design calculations can easily exceed 100’000. Thus single process units are generally represented by simple models like equilibrium based (chemical or phase equilibrium) or specific short cut models (e.g. for distillation columns).
In this paper we will discuss how to incorporate experimentally validated rate based models of process units by replacing the equilibrium based models while maintaining acceptable CPU time in respect to the evolutionary multi-objective optimisation of process designs. As most rate based models are iteratively solved, a direct incorporation would cause higher CPU-time that penalises the use of evolutionary multi-objective optimisation. Therefore, surrogate modelling is considered for generating appropriate models as it promises high accuracy and low costs of CPU-time.
Surrogate modelling techniques, also known as meta-modelling, are becoming rapidly popular in the engineering community to speed up complex, computationally expensive design problems [3]. Surrogate models, or meta-models, are mathematical approximation models that mimic the behaviour of computationally expensive simulation codes such as mechanical or electrical finite element simulations, computational fluid dynamic simulations, or as in our case rate-based multi-phase chemical reactor computation where kinetic effects or mass transport limitations may play an important role.
The goal is to achieve a process design & optimisation (PDO) tool which allows fast adoption of newest experimentally validated findings and models. Thus, by applying the methodology of surrogate modelling of rate based process units we achieve a stronger and more direct interaction of results in experimental development and process design & optimisation in the course of developing a new process concept.
The method of surrogate modelling and the improvements which have been realised to save time in the adaptive surrogate modelling process will be shown by applying the fluidised bed methanation in the wood to Synthetic Natural Gas (SNG) process as case study. This process unit has been chosen, because kinetic and mass transfer limitations are known to be existent, which was verified by experiments [4]. Additionally, certain improvements are presented that are generally useful to obtain robust rate based models with reliable convergence behaviour. This is notably important for the automated surrogate modelling process with adaptive sampling of the design space.
1.1 Wood to SNG process
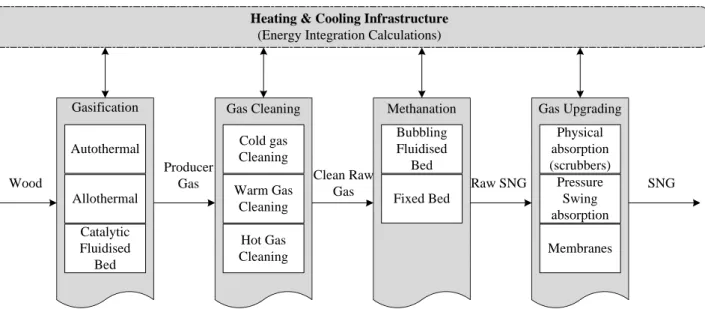
Figure 1 depicts the four general process steps of the wood to SNG process. Depending on the applied gasification technology, wet or dried wood is fed to the gasification unit which converts the wood under addition of a gasification agent (air, oxygen and/or water
steam) into the so called producer gas. This gas consists mainly of H2, CO, CO2, H2O, CH4
and if the gasification agent is air also N2. Additionally, impurities like small amounts of
sulphur compounds, olefins and tars are gasification products. Most of these components harm the catalyst in the subsequent methane synthesis (methanation) step. Therefore, a gas cleaning step is necessary. Well established cold gas cleaning (scrubbers) or more advanced catalytic hot gas cleaning both with additional adsorption beds are possible technology options. In the subsequent synthesis step, CO and H2 form methane, the main
constituent of SNG, in the exothermic methanation reaction over a suite catalyst (usually nickel based). The methanation step considered in this work is an isothermal bubbling fluidised bed methanation reactor. An alternative technology option would be a series of catalytic fixed bed methanation units with intermediate cooling. The last production step is a gas upgrading step which adjusts gas concentrations according the desired gas qualities needed for the injection into the natural gas grid. Here mainly CO2 and H2O are separated
from the gas stream. Additionally, excess hydrogen is recovered and fed back into the methanation or may be used to cover part of the energy demand of the process. For further detailed technology review we refer to Kopyscinski [5]. The list of technology options presented here is exemplary and by no means exhaustive.
Heating & Cooling Infrastructure (Energy Integration Calculations)
Producer
Gas Clean Raw
Gas Raw SNG SNG Autothermal Allothermal Catalytic Fluidised Bed
Gasification Gas Cleaning
Cold gas Cleaning Warm Gas Cleaning Hot Gas Cleaning Methanation Bubbling Fluidised Bed Fixed Bed Gas Upgrading Physical absorption (scrubbers) Pressure Swing absorption Membranes Wood
Figure 1: Process flow diagram of the wood to Synthetic Natural Gas (SNG) process with alternative process unit options.
1.2 Process Design & Optimisation Tool (PDO)
The process design & optimisation methodology, in which the above mentioned concept for the integration of rate based models will be applied, is described in detail in [1,6,7] and has already been applied to study the wood to SNG process [2,6].
This PDO approach, developed by Gassner and Maréchal, allows to apply combined mass and energy integration calculations in an evolutionary multi-objective optimisation based on a general process superstructure. In the process superstructure, all process unit models, which will be considered in the calculation, are defined. This includes heat recovery systems and technologies for external heat and cooling demand. The process design problem is decomposed into the non-linear process unit calculation and a mixed integer linear programming (MILP) which targets the maximum combined production of fuel, heat and power (principle of energy integration) by using the calculated mass and
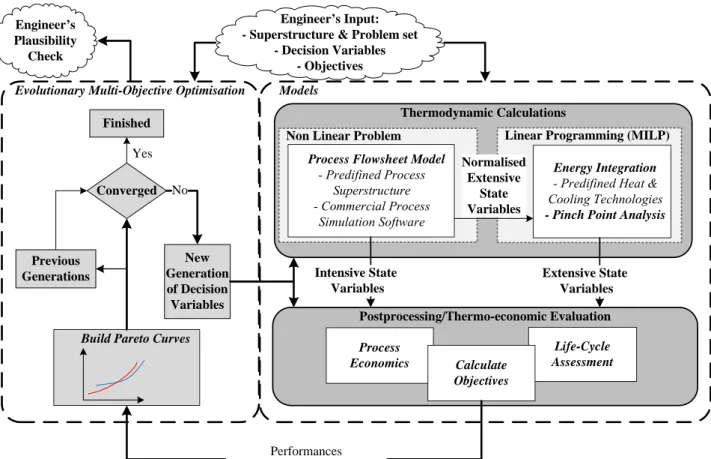
energy balances of the non-linear process calculation as constraints. This MILP includes for example a pinch point analysis. The flowsheet structure and its operating conditions are considered as decision variables in an overall non-linear and non-continuous optimisation problem which is addressed to the evolutionary multi-objective optimisation algorithm. Figure 2 depicts the sequence of computation and the flow of information. It shows that the non-linear flowsheet problem is used to calculate the intensive state variables of the process design while generating normalised extensive state variables which are used as constraints in the MILP for solving the energy integration problem.
The PDO tool distinguishes between intensive process variables, extensive process variables, and decision variables. Decision variables are decisions of the evolutionary multi-objective optimisation and defined before each generation of the evolutionary algorithm. These are the variables which differ from one generation of process designs to another. The remaining intensive and extensive process variables are determined during the thermodynamic calculations by the process flowsheeting software.
Models Evolutionary Multi-Objective Optimisation
Thermodynamic Calculations Non Linear Problem
Engineer’s Input: - Superstructure & Problem set
- Decision Variables - Objectives
Process Flowsheet Model
- Predifined Process Superstructure - Commercial Process
Simulation Software
Linear Programming (MILP)
Energy Integration
- Predifined Heat & Cooling Technologies
- Pinch Point Analysis
New Generation of Decision Variables No Intensive State Variables Normalised Extensive State Variables Converged Postprocessing/Thermo-economic Evaluation Process Economics Life-Cycle Assessment Calculate Objectives Extensive State Variables
Build Pareto Curves
Previous Generations Engineer’s Plausibility Check Finished Yes Performances (Objectives & State Variables)
Figure 2: Computational and information flow diagram of the process design & optimisation tool. As described in [2], the outlet composition of the used methanation reactor model is computed with assuming thermodynamic equilibrium. For the first investigation, this is a reasonable assumption if the amount of catalytic material is sufficient. However, in terms of process design & optimisation which includes the economic properties of all process steps, such an assumption does not allow to optimise the amount of catalyst or the size of the reactor. Therefore, it is desirable to represent the methanation unit, which anyway showed some influence of mass transfer effects etc. on the selectivity [4], by an experimentally derived rate based model in the process flowsheeting software used for the extensive MOO.
1.3 Surrogate Modelling
Surrogate models, or meta-models, are computational cheap mathematical approximation models that mimic the behaviour of computationally expensive simulation codes. It is important to note the difference between local and global surrogate models. Local surrogates involve building small, relatively low fidelity surrogates for use in optimisation where they are used as rough approximates of the (costly) optimisation surface and guide the optimisation algorithm towards good extrema while minimising the number of simulations [8]. Once the optimum is found, the surrogate is discarded. In contrast to that, by applying global surrogate modelling the objective is to construct a high fidelity approximation model that is as accurate as possible over the complete design space of interest using as few simulation points as possible. Once constructed, the global surrogate model is reused in other stages of the computational science and engineering pipeline like in our case the PDO tool.
The software used to create surrogate models is the flexible research platform for surrogate modelling, the SUrrogate MOdeling (SUMO) Toolbox [9] (The SUMO Toolbox can be downloaded from: http://sumo.intec.ugent.be. An AGPL open source license is available for research purposes). This Toolbox is used with MATLAB® R2012b, a software of The MathWorks®, Inc., Natick, Massachusetts 01760 USA. The general workflow of the SUMO toolbox is illustrated in Fig. 3.
Figure 3: Flow chart of the surrogate modelling process [9].
A small initial set of points, e.g., from Design of Experiments (DOE), is specified and evaluated. Subsequently, surrogate models are built to fit this data as good as possible,
according to a set of accuracy measures (e.g., cross validation). The parameters of the surrogate model (hyperparameters) are estimated using an optimisation algorithm. The accuracy of the set of surrogate models is improved until no further improvement can be obtained (or when another stopping criterion, such as a time limit, is met). When the stopping criteria are satisfied, the process is halted and the final, best surrogate model is returned. On the other hand, when no stopping criterion is met, a sequential design strategy, also known as active learning or adaptive sampling, will select new data points to be evaluated, and the surrogate models are updated with this new data.
This paper makes use of the creation and application of global accurate surrogate models representing rate based reactor models to expedite the MOO of super-structured process designs with incorporated rate based process units.
1.4 Rate Based Fluidised Bed Model
This section describes the rate based model of the bubbling fluidised bed reactor, which is object of later surrogate modelling and incorporation into the PDO tool. Furthermore, the necessary adaptations and implementations of the rate based model are discussed here. The applied bubbling fluidised bed methanation model is a two phase model, where bubble phase and dense phase are modelled separately. This model calculates the fluidised bed by discrete slices of the reactor over its height. Figure 4 pictures the model concept of the two phase model.
Figure 4: Scheme of the two phase fluidised bed model from [10].
Equations (1) and (2) show the molar balances of the bubble and dense phase for an infinitesimal small slice of the fluidised bed over its height h.
bi ei
vc bi i G i b K a A c c N x dh n d , , , , , 0 (1)
bi ei
vc bi
b
mf
P i i G i e K a A c c N x A R dh n d 1 1 0 , , , , , (2) Reaction Flow Bulk Transfer Mass 1 2 3 3 3 3 3 3 2 cat bed solid cat dense solid bed dense bed bed s kg mol m m kg m m m m s m mol m mol m m s m s m mol Where KG,i is the mass transfer coefficient and a is the specific mass transfer area
between bubble and dense phase. The free cross sectional area of the reactor is represented by A, ci represents the concentration, and xi represents the molar fraction of
each component i in the gas phase. The subscripts e and b stand for dense (or emulsion) phase and bubble phase, respectively. The symbol ρp, and the terms (1-εb) and (1-εmf) are
representing the catalyst particle density, the volume fraction of dense phase, and the volume fraction of catalyst particles at minimum fluidisation conditions, respectively. The term Nvc describes the total bulk flow from the bubble to the dense phase which occurs due to the volume contracting reaction in the dense phase. It is defined by the sum of the molar losses in the dense phase due to the reaction and mass transfer and is defined in (3).
i i P mf b i i e i b i G vc vc K a A c c A R dh n N , , , 1 1 (3)The numerical model describes the hydrodynamic parameters by applying correlations for the height dependent bubble size db, the bubble velocity ub, the bubble gas hold-up εb, the
specific surface area a, the mass transfer coefficient KG,i, and the minimum fluidisation
velocity umf.
The molar reaction rate per mass of catalyst Riis defined in (4). The methanation reaction (R1) and the water gas shift reaction (R2) are considered; their rate laws are defined in (5) and (6) respectively. wgs wgs i meth meth i i r r R , , (4) with:
cat H O H OH H CO CH H CO meth eq CH O H H CO CH meth s kg mol p p K p p K p p K p p p p K k r 2 5 . 0 5 . 0 5 . 0 3 , 5 . 0 1 2 2 2 2 4 2 2 1 1 (5)
cat H O H OH H CO CH H WGS eq H CO O H CO wgs kg s mol p p K p p K p K p p p p K k r 2 5 . 0 5 . 0 5 . 0 5 . 0 , 2 2 2 2 2 2 2 2 1 (6) O H CH CO H2 4 2 3 (R1) 2 2 2O CO CO H H (R2)For more details according the fluidised bed model refer to [10–12]. The model was programmed using the software Athena Visual Studio, obtained from www.AthenaVisual.com, which currently is only available for Microsoft Windows® operating systems. Further details associated with Athena Visual Studio can be found in [13].
It is important to understand the properties and dependencies in a reactive bubbling fluidised bed for further discussion. Considering a fixed design of a fluidised bed reactor with a given diameter and given mass of catalyst, the total amount of converted gas depends on the total inlet mass flow, its residence time in the catalyst suspension and the quantity of inter- and intra-phase mass transport. The hydrodynamic properties of the fluidised bed are generally strongly dependent on the superficial gas velocity which is the total volumetric flow of gas divided by the cross sectional area of the reactor. A common definition for specifying the hydrodynamic state of a fluidised bed is the ratio U/Umf which is
the ratio between the current superficial gas velocity and the superficial gas velocity at minimum fluidisation conditions. This factor will be called superficial excess gas factor or short excess gas. The superficial gas velocity at minimum fluidisation conditions is the gas velocity at which the bed’s mass will be fully suspended and the pressure drop gets constant. Further increase of the gas velocity will expand the bed and introduce bubble formation whereas the overall pressure drop does not change. The gas velocity strongly influences the residence time of the gas in the catalyst suspension. The larger the difference between U and Umf, the larger the bubble formation, bubble sizes and the phase
separation become. Very large differences can cause gas bypassing the catalyst through the bubble phase. Bubble sizes larger than two thirds of the reactor diameter are causing slugging of the fluidised bed which is an absolutely undesirable state of a reactive bubbling fluidised bed. As the bubble size grows with increasing amount of excess gas and with fluidised bed height, the conditions of the fluidised bed have to be chosen such that no slugging can occur.
For constant inlet mass flow, an increased reactor diameter reduces the gas velocity and therefore changes the hydrodynamic properties. Thereby this influences also the mass transport and total conversion of initial gas. Accordingly, to achieve comparable hydrodynamic properties, either the sizing of the reactor diameter or the operation conditions have to be changed, i.e. the mass flow is changed.
The mass of catalyst in each infinitesimal small slice of the reactor changes with height due to varying bubble gas hold up εb. Thus, the catalyst mass is a variable calculated by
the rate based reactor model. It is determined by integrating the suspension, respectively dense phase, over the given reactor height.
Regarding these properties and their dependencies it is in the nature of things that the reactor diameter is a rarely varied property in experimental set-ups. Most experimental set-ups are limited to a predefined reactor design. Therefore the original input variables of the initial fluidised bed model (reactor diameter, mass flow fed to the reactor, etc.) are appropriate for a fixed reactor design, but in the PDO the reactor size should be a consequence of the decisions made by the multi-objective optimisation. Accordingly, the fluidised bed model has to be adapted.
2. Methodology Concept
The methodology concept integrates three different software respectively modelling solutions: the process design & optimisation tool (PDO), the surrogate modelling toolbox
and the rate based model. The PDO tool is mainly based on MATLAB® and a commercial
process flowsheet software named VALI®, a software of Belsim S.A., Awans, Belgium. The SUMO-Toolbox is a framework written in MATLAB® and Java®. As mentioned above the rate based model was programmed using Athena Visual Studio which generates an executable Fortran code. Each of these modules has its properties and constraints which have to be considered for merging them to an applicable solution. This section will shortly discuss the different requirements which have to be met.
2.1 Requirements on Interfacing Variables
The interfacing variables are predominantly the inputs and outputs of the rate based model and implicitly its surrogate model. Since the interfacing variables have to meet the requirements of the interfacing software and modelling solutions, some basic adaptations and improvements have been applied to the rate based model.
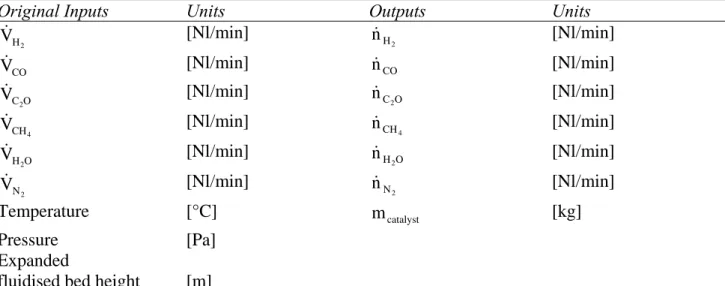
In the original fluidised bed model, basically ten input variables are needed to run the calculation. These inputs are listed in Table 1: the volume flows at standard conditions of each component, the isothermal reaction temperature of the fluidised bed, the initial pressure, the diameter of the reactor and the height of the expanded fluidised bed. The outputs of the original model listed in Table 1 are the component molar flows and the effective catalyst mass.
The interfacing variables for the original model were well suited for the needs the model was developed for. As will be discussed in this section, this set of interfacing variables is, however, not appropriate for the needs of concept described here.
Table 1. Input and output variables of the original fluidised bed model.
Original Inputs Units Outputs Units
2 H V [Nl/min] nH2 [Nl/min] CO V [Nl/min] nCO [Nl/min] O C2 V [Nl/min] nC2O [Nl/min] 4 CH V [Nl/min] nCH4 [Nl/min] O H2 V [Nl/min] nH2O [Nl/min] 2 N V [Nl/min] nN2 [Nl/min] Temperature [°C] mcatalyst [kg] Pressure [Pa] Expanded
fluidised bed height [m] Reactor diameter [m]
To reduce the complexity and to increase the convergence probability of the PDO tool with the incorporated rate based model, the realised concept has to make sure that all mass and energy balances are calculated in the same tool, which is the commercial flowsheeting tool. Furthermore, as many software inherent process unit models of the commercial tool as possible should be applied to realise the incorporation and use of the rate based model. Additionally, the interfacing input variables must either be intensive process variables or decision variables to avoid conflicts with the separability of extensive and intensive process variables which is required by the PDO tool.
Therefore it was chosen to make use of a built-in reactor model from the commercial process flowsheeting software which accounts for the methanation and water gas shift reaction as contributing reactions. This process unit model is able to either calculate using equilibrium calculations or using reaction extent variables for each predefined reaction. The reaction extent variables are calculated within the adapted rate based models by iterative integration over the effective height of the reactor.
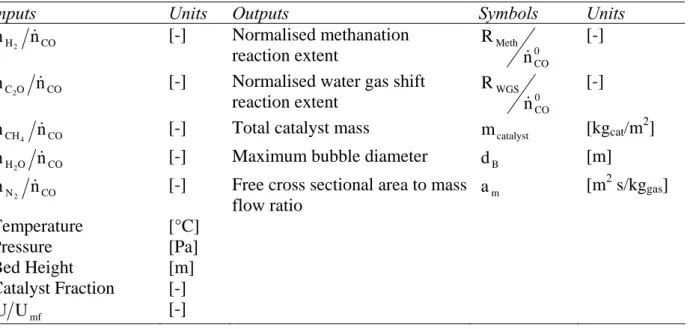
Table 2. Input and output variables of the adapted rate based fluidised bed model respectively its surrogate model.
Inputs Units Outputs Symbols Units
CO H n n 2 [-] Normalised methanation reaction extent 0 CO Meth n R [-] CO O C n n 2
[-] Normalised water gas shift
reaction extent 0 CO WGS n R [-] CO CH n n 4
[-] Total catalyst mass mcatalyst [kgcat/m2]
CO O H n n
2
[-] Maximum bubble diameter dB [m]
CO N n n
2
[-] Free cross sectional area to mass flow ratio m a [m2 s/kggas] Temperature [°C] Pressure [Pa] Bed Height [m] Catalyst Fraction [-] mf U U [-]
The reaction extent is generally an extensive variable and therefore directly dependent on the total mass flow entering the reactor. Using the value directly would violate the requirement of the separability of extensive and intensive process variables in the PDO tool. To avoid this, the rate based model is adapted to calculate the reaction extent of each reaction normalised by the total molar flow of initial carbon monoxide. This is suitable since carbon monoxide is the key component in both reactions as (R1) and (R2) show. Thus the extensive characteristic of the reaction extent is eliminated and the input of each compound is independently adjustable without influencing the other input values. The input and output variables of the adapted rate based model are shown in Table 2. The later discussed surrogate model will approximate the mentioned reaction extents to supply the PDO tool with these values. This implementation and the use of the normalised reaction extents as interfacing variables assigns the mass balance to the commercial process flowsheeting software. Thus it is avoided that the mass balance has to be solved in two different software solutions which makes convergence of the PDO tool more robust.
As mentioned above, the PDO tool also accounts for economic performance of the process designs. Reactor design, i.e. reactor diameter, reactor height, reactor pressure, and catalyst mass, are essential properties for evaluating the economic performance of the fluidised bed methanation reactor. Thus information about the reactor dimension and the catalyst mass are selected to be output variables of the adapted rate based model.
Additionally, the bubble size in the fluidised bed methanation reactor is selected as indicator to eliminate the process designs with conditions leading to bubble sizes larger than 2/3 of the reactor diameter. Larger bubbles would change the hydrodynamic state of the reactor (onset of slugging which is detrimental for mass transfer). Since the maximum
bubble size is mainly influenced by decision variables, the calculated process designs during the multi-objective optimisation are filtered and the violating calculations are excluded.
For better understanding of the adapted input variables of the rate based model, it is important to understand, which requirements the surrogate modelling procedure imposes on the interfacing variables.
In the SUMO toolbox, every input variable defines one input dimension with predefined range of validity. In combination, they span a design space which has the dimension of total number of input variables. This design space is going to be sampled. That means, different selected combinations of input variable values are sent to the underlying rate based model which will calculate the predefined output values. An mathematical transformation function will be fitted on the sample results. This function approximates the influences of each input on a respective output variable. As the surrogate modelling technique needs to treat the rate based model as a black box, the model inputs have to be independently controllable and orthogonal to each other. The latter means that one has to be able to define arbitrary combinations of all inputs. For the set of the original input variables listed in Table 1 the orthogonality is satisfied but the independency not, since the results would be obviously strongly correlated because the total volume flow can not kept constant without changing another model input.
As mentioned above, the hydrodynamic properties of a fluidised bed are strongly dependent on the superficial gas velocities and therefore on the total volumetric flow of gas. It is desired to use an input variable which defines respectively fixes the hydrodynamic state of the fluidised bed such that the hydrodynamic conditions do not change even if the total mass flow through the reactor changes. The superficial excess gas factor U/Umf is such a variable and has thus been selected as interfacing input
variable.
Changing the mass flow without changing the hydrodynamic conditions is necessary for solving the linear problem in the PDO tool which calculates the energy integration and therefore has to be able to change the mass flows independently of the intensive process variables.
The gas velocities are defined by the total mass flow and the reactor diameter. Thus one of these variables had to be eliminated in contrast to the original rate based model. To do so, the rate based model has been changed to calculate the fluidised bed based on 1 m2 reactor cross sectional area. This implicates the last output variable of the rate based model, which is the area to mass flow ratio am.
2.2 Improvements to gain Model Convergence and Robustness
In the course of surrogate modelling, convergence problems of the underlying rate based model were observed. The vulnerability of the model was mainly found in the definition and implementation of the reaction kinetics defined by the Langmuir-Hinshelwood approach in (5) and (6).
The implementation of the above presented Langmuir-Hinshelwood kinetic had to be improved for making it numerically robust. The convergence problems occurred especially in cases where the carbon monoxide partial pressure got very small. Very large bed height
and high hydrogen to carbon monoxide ratio are an example for such conditions. All possibilities of a numerically critical division by zero were eliminated.
Further investigation showed that the absolute values of the reaction extent where very large even at very small partial pressure of the carbon monoxide. This situation was enforced with increasing temperature or pressure and high hydrogen to carbon monoxide ratio. The high gradients combined with very small partial pressure caused the equation solver to reduce the solver step size such that it may find a solution for the partial pressure which is non-negative. In many situations this caused the rate based model not to converge. Detailed information about the corresponding solver which is used by the Athena Visual Studio software is given in [13]. As in reality, mass transfer limitations can be expected in such situation (small concentration gradient for reactant), calculation of external mass transport limitations for the catalyst particles was implemented in the model to avoid unrealistically high values of the reaction extent at low carbon monoxide concentrations during modelling.
The calculated reaction rate according (5) can be defined as the maximum possible reaction rate at bulk fluid conditions. The Damköhler number for a certain component i then can be calculated directly by applying (7). For the calculation of the mass transfer coefficient βp,i defined in (8) the Sherwood number defined in (9) is needed. Detailed
information about the definition of the Sherwood number can be found in [14].
The Damköhler number used here is defined as
i e i p i i c a R Da , , , 0 rate transfer mass maximum conditions fluid bulk at rate reaction , (7) with p i p i p d D Sh , , (8) and 13 5 . 0 Re 7 0 20 ε . Sc Sh mf mf mf p , (9) and g p mf g mf d u Re , (10) and g g D Sc . (11)
Cassiere and Carberry [15] presented the external isothermal effectiveness factor whose definition is given in (12). The external isothermal effectiveness factor will be used to calculated the inhibited reaction extent.
i i eff ext R R , conditions fluid bulk at rate reaction surface catalyst at rate reaction effective (12)
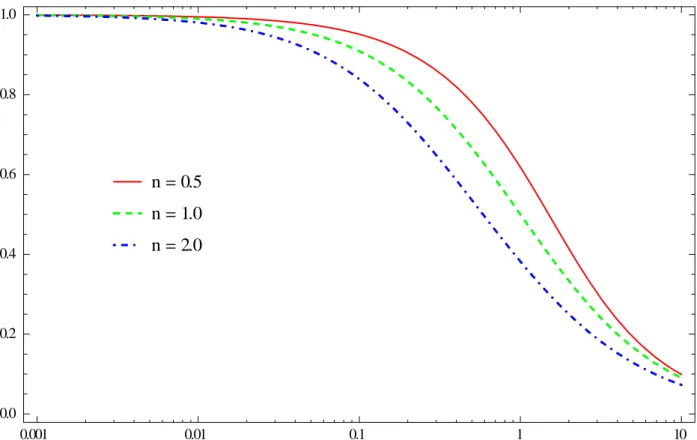
The definition of the external isothermal effectiveness factor for the reaction order of n=1 is given in (13). For the definition of the external isothermal effectiveness factor for reaction order n≠1, see [15]. In Fig. 5 the external effectiveness factor for different reaction order is plotted against the value of the Damköhler number.
i i ext Da , 0 , 1 1 (13)
In certain circumstances, the Damköhler number exceeded the value of 800 in the simulated fluidised bed reactors, leading to very small values of the external effectiveness factor for all reaction orders. Figure 5 shows that the difference between the effectiveness factor of reaction order 0.5, 1, and 2 are very small for Damköhler values greater than 10 and smaller than 0.01. For these conditions, the actual value of the reaction order is not significant. n=0.5 n=1.0 n=2.0 0.001 0.01 0.1 1 10 0.0 0.2 0.4 0.6 0.8 1.0 DaII hex t
Fig. 5. External effectiveness factor plotted against the Damköhler number in dependence of the reaction order n.
Therefore, this approach could be chosen to calculate the effective reaction rates at the catalyst surface to significantly improve the convergence behaviour and robustness of the rate based fluidised bed model. For situations with very high fluidised beds and low gas load, it was chosen to implement an additional abort criteria which stops the iteration
process if the total conversion exceeds 99.95% or the first derivative of the total conversion gets very small.
With these improvements, it was possible to reduce the calculation time of the fluidised bed model even in the worst case to less than three minutes. This is a suitable time for the surrogate modelling toolbox.
2.3 Surrogate Modelling Set-up
The surrogate modelling was conducted using a high performance PC with 2 CPUs with 6 cores (2.8 Ghz) each. The total valuable memory was 48 GB. The use of such a PC instead of a linux cluster was necessary because as mentioned above the software which is used to program the rate based model is only available for Windows machines at this time.
The surrogate model types applied here are an ordinary Kriging interpolation and a genetic artificial neural network (ANN). Kriging interpolation is a popular surrogate model to approximate deterministic noise-free data, and has proven to be very useful for tasks such as optimisation [16], design space exploration, visualisation, prototyping, and sensitivity analysis [3]. It is known to generate relatively smooth surfaces advantageous for derivative driven solver algorithms [17]. The surrogate models presented here were fitted on a design space sample set with about 6000 samples in ten dimensions. Unfortunately, the computational complexity of constructing a Kriging model increases rapidly with the number of design space samples. Hence, Kriging modelling will be compared to the artificial neural network modelling since this is able to handle more design space samples in the fitting routine.
To utilise the full capabilities of modern multi-core PCs, an extension introduced to the SUMO toolbox allows the construction of Kriging surrogate models in parallel, which significantly reduces the computation time. Unfortunately, the parallelisation of constructing artificial neural networks was not realised yet.
The SUMO toolbox generates the Kriging model as follows. An initial set of 20 samples is generated by a near-optimal maximin Latin Hypercube Design [18]. After evaluation, five Kriging surrogate models are constructed in parallel based on these data. Each Kriging model is configured to use the Matérn correlation function [17] with ν = 3/2 and a constant regression function. The hyperparameters of the Kriging models are optimised using
SQPLab (https://who.rocq.inria.fr/ Jean-Charles.Gilbert/modulopt/optimization-routines/sqplab/sqplab.html) [19], utilising
likelihood derivative information. Afterwards, additional samples are selected in batches of 1500 using the density sample selector which is a space-filling sampling algorithm. It uses an approximation of the Voronoi tessellation of the design space. More details are given in [20]. The Kriging models are updated with this new information. This process repeats until the total number of samples exceeds 6000.
The set-up of the artificial neural network is simpler. As the generated sample set of the Kriging modelling set-up is independent of the surrogate model type, it can be reused to fit an artificial neural network. Thus there is no need to apply the adaptive sampling method again. The optimal topology (number of layers and neurons) of the artificial neural network is automatically selected using a genetic algorithm.
The accuracy of both surrogate model types are measured using the well-known cross-validation re-sampling strategy, using the mean squared error function. While being
a popular and trusted accuracy measure, cross-validation is still just an approximation and it is always advisable to check the accuracy (e.g., synoptic analysis of the final surrogate model) as will be shown later.
In Table 3 the ten dimensions of the design space are presented with their maximum and minimum values.
Table 3. Design space definition for the surrogate modelling set-up.
Inputs Units Min Value Max Value
CO H n n 2 [-] 2 11 CO O C n n 2 [-] 0 2 CO CH n n 4 [-] 0 1 CO O H n n 2 [-] 0 3 CO N n n 2 [-] 0 5 Temperature [°C] 280 400 Pressure [Pa] 1.25*105 1.0*106 Bed Height [m] 0.01 5 Catalyst Fraction [-] 0.1 1 U/Umf [-] 4 15
3. Results
The accuracy of the surrogate model in representing the underlying rate based model is very important for its later application. The presented results cover only a small region of the total design space, but still give an indication of the overall accuracy for the total design space. It will be shown, that results have to be investigated in detail, even if the cross-validation algorithm suggests a good agreement with sampled data.
Table 4 lists the tested design space region. The design space is spanned by the initial water content, which was varied from 0.25 to 3 times the carbon monoxide amount, and the temperature, which was varied from 280°C to 400°C.
Table 4. Tested values of the design space for comparison of the surrogate models against the rate based model and the equilibrium model.
Inputs Units Lowest Value Highest Value
CO H n n 2 [-] 2 2 CO CO n n 2 [-] 0 0 CO CH n n 4 [-] 0 0 CO O H n n 2 [-] 0.25 3 CO N n n 2 [-] 0 0 Temperature [°C] 280 400 Pressure [Pa] 3*105 3*105 Bed Height [m] 0.5 0.5 Catalyst Fraction [-] 1 1 U/Umf [-] 8 8
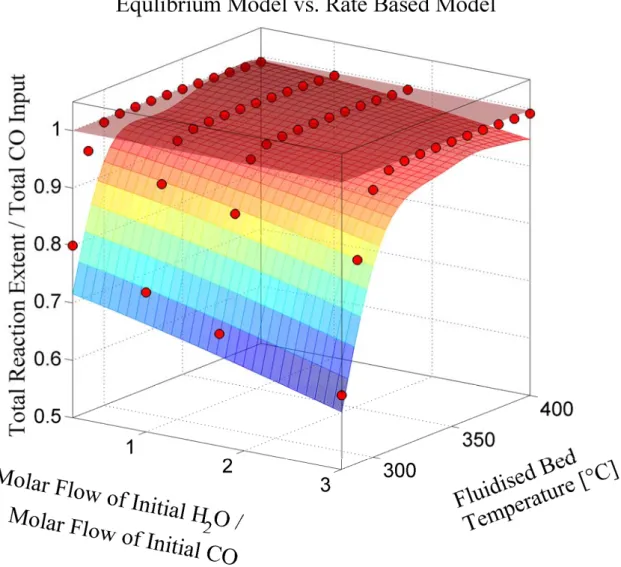
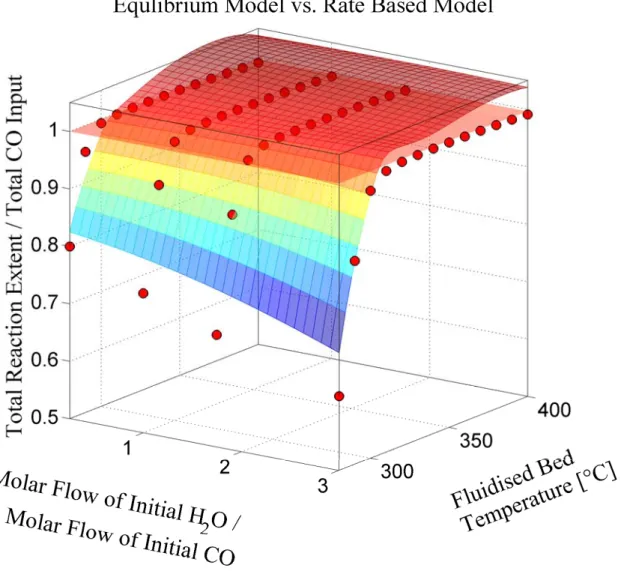
Figure 6 shows the resulting total reaction extents of the initial carbon monoxide and carbon dioxide amount plotted over the initial H2O/CO ratio and the temperature. In the
following, the combination of the initial carbon monoxide and carbon dioxide amount will be called the reactive carbon. In Fig. 6, the results of the Kriging surrogate model are represented by the surface with illustrated grid lines. It is compared to the equilibrium model which is represented by the more transparent surface without grid lines and the direct calculations of the rate based model represented by the plotted points. The rate based model was calculated for selected points (temperature at 280, 290, 300, 320 or 400°C, initial water content of 0.25, 1, 1.75 or 3 times the carbon monoxide amount).
Figure 6: Comparison of the calculated sum of reaction extents of both reactions (total reaction extent) normalised by the total initial CO amount for the ordinary Kriging surrogate model (surface with grid lines), the equilibrium model (transparent surface without grid lines) and the rate based fluidised bed model (represented by the points at 280°C to 400°C in steps of 10°C and the initial H2O/CO ratio at values of 0.25, 1, 1.75, and 3)
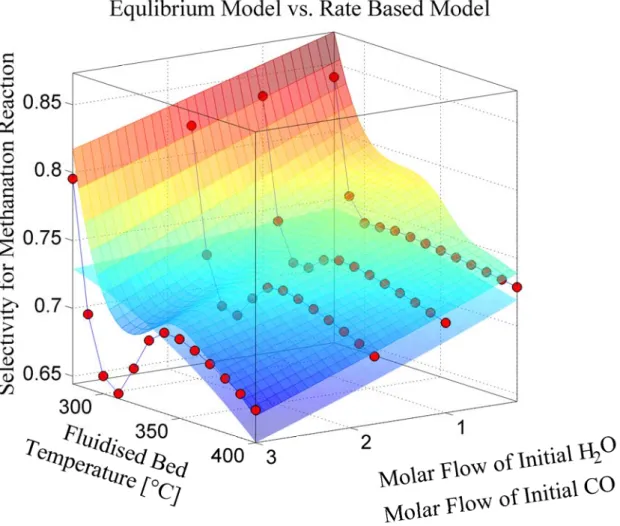
Figure 6 illustrates that both, the initial water content and the isothermal reaction temperature, have a significant superimposing effect on the total conversion of the reactive
carbon for a temperatures lower than 320°C. The influence of the initial water content increases with decreasing temperature. Both, high water content and temperatures lower than 300°C result in a lower total CO conversion. From the perspective of catalyst utilisation in the simulated 0.5 m high reactor, this combination may be considered as undesired operation condition. Regarding the methanation selectivity plotted in Fig. 7, the highest selectivity is observed at low temperatures. Thus, if bigger reactors can be accepted, it might be a better choice to operate the reactor at low temperatures and increased bed height to maximise conversion of carbon monoxide to the desired product methane.
The Kriging model is able to qualitatively represent the behaviour of the total reaction extent of the rate based model although it is not as good as it is desired to be and needs further development. Intuitively, the lack of accuracy is due to the Kriging interpolation which extrapolates the non-linear behaviour towards the flat regions in the design space where total conversion is nearly reached, see Fig. 6. This is, because the widely used configuration of a stationary correlation function for the Kriging interpolation assumes the degree of (non-)linearity to be constant across the design space [17]. This issue may be compensated by changing to a non-stationary correlation function; however, this type of Kriging model is still experimental and more research is needed [21]. Another solution is to switch to a more complex regression function of the Kriging interpolation, e.g. linear or polynomial instead of constant, which basically transforms the problem to one which can be approximated more easily by stationary Kriging. However, the correct choice of regression function is essential and may be difficult to make a priori, this may justify the application of algorithms which are selecting the regression function automatically, e.g. blind Kriging [22].
Other options are a revision of the problem statement to avoid the hard change of non-linearity or the reduction of dimension of the design space. But generally, the amount of 6000 samples is still very small for a ten dimensional design space of corresponding size and one or two dimensions less may not change this significantly. This has to be considered when judging the results. Important to notice is that the rate based model (and the Kriging model) deviates considerably from the equilibrium model with respect to CO conversion and selectivity. This results show that at lower temperatures, both reactions are kinetically limited, but that this effect is stronger for the water gas shift reaction than for the methanation, even at high water contents. This is an important information for the optimisation of the reaction conditions and for the cost calculation of the process unit which would not be available if the equilibrium model would be used. Obviously, there will be a trade-off between higher selectivity and higher costs for a bigger reactor. This shows that a rate based model is very useful if not necessary for generating optimised process designs.
Moreover such an synoptic analysis of broader ranges of operation conditions by means of the surrogate model allows to identify promising configurations and operation conditions. These might be validated by additional experiments which then can further support and strengthen the process development in early phases.
Figure 7:Comparison of the calculated selectivity of the methanation reaction for the ordinary Kriging surrogate model (surface with grid lines), the equilibrium model (transparent surface without grid lines) and the rate based fluidised bed model (represented by the points at 280°C to 400°C in steps of 10°C and the initial H2O/CO ratio at values of 0.25, 1, 1.75, and 3)
Figure 8 shows the total reaction extent of reactive carbon plotted over the initial H2O/CO
ratio and the temperature based on the artificial neural network surrogate model in the same ranges as for the Kriging model in Fig. 6. It is obvious that ANN fits the main trends (lower conversion at low temperature and high initial water content), however in comparison to the Kriging model, the ANN prediction shows a systematic deviation and gives results in the physical infeasible region, i.e. values which are larger than one.
Figure 8: Comparison of the calculated sum of reaction extents of both reactions (total reaction extent) normalised by the total initial CO amount for the artificial neural network surrogate model (surface with grid lines), the equilibrium model (transparent surface without grid lines) and the rate based fluidised bed model (represented by the points at 280°C to 400°C in steps of 10°C and the initial H2O/CO ratio at values of 0.25, 1, 1.75, and-3)
Comparing the plot of the methanation selectivity in Fig. 9 for the ANN surrogate model with the corresponding plot for the Kriging model in Fig. 7, it can be stated that the ANN performs better in the non-linear regions of the model as the minimum at about 300°C for all values of the initial water content indicates. It has to be pointed out that the five ANN (one for each output variable, cf. Table 2) were fitted for only three days in a serial computation manner while the five Kriging models were fitted in parallel for seven days.
Figure 9: Comparison of the calculated selectivity of the methanation reaction for the artificial neural network surrogate model (surface with grid lines), the equilibrium model (transparent surface without grid lines) and the rate based fluidised bed model (represented by the points at 280°C to 400°C in steps of 10°C and the initial H2O/CO ratio at values of 0.25, 1, 1.75, and 3) While the generated surrogate models have generally good accuracy for design space exploration and identifying interesting parts of the design space, they are not accurate enough to fully replace the computational expensive simulation code. Strangely, the cross-validation accuracy scores of the surrogate models estimate a very good accuracy. After further investigation it is found that this is due to the use of the mean squared error function. By taking the mean of the errors across the input space, small regions with a larger error value are effectively neglected. However for a global surrogate model a deviation in just a small part of the design space is not acceptable. Using different error functions may provide a better representation of the actual accuracy of the surrogate model.
4. Conclusions
A global surrogate model of a rate based model (RBM) was successfully generated to allow its incorporation into a process design & optimisation tool (PDO). The methodology was applied to a fluidised bed methanation reactor in the process chain from wood to SNG. Two types of surrogate model, an ordinary Kriging interpolation and an artificial neural network, were generated and compared to its underlying original model and the chemical equilibrium model. Significant differences between the rate based model and the equilibrium model especially at low temperatures and high initial water content were observed, which is due to kinetic limitations of the methanation and water gas shift reaction. This emphasises the need to represent kinetically limited process units, like the fluidised bed methanation reactor, by rate based surrogate models in PDO tools. This is even more important, if one considers that in real processes several chemical species can be measured which would not be expected in the outlet of the reactor based on thermodynamic equilibrium.
By means of a synoptic analysis, the surrogate model allows to identify promising configurations and operation conditions which might be validated by additional experiments. These can support and strengthen the process development in early phases. Although the differences between surrogate model and rate based model are qualitatively well represented by both surrogate model types, a better quantitative representation is desired. Since the integrated accuracy measure in the surrogate modelling toolbox states good fit of both model types on the sampled data, a reliable performance indicator has to be found to measure at which non sampled point a sufficient fit of a global surrogate model has been reached. In cases of insufficient fit, a redefined problem statement may solve it. Additionally reducing the number of design space dimensions can help to improve the calculation time and thus gives more time for the model fit.
It was found that in the course of surrogate modelling the characteristics of the rate based model has to be investigated to identify appropriate surrogate model types, to discover bottle necks in the modelling routine, and to revise the initial problem statements or interfacing variables. However, already this investigation and the surrogate modelling allows visualisation of dependencies within a broad range of operation conditions. In consequence, experimental work can be focused on more promising operation conditions with respect to overall system efficiency. This allows cost reduction of process development and supports technology transfer to industry as process simulations can be conducted more reliably with respect to efficiency and economics.
Generally, this methodology is applicable for all process units where RBMs are needed to represent satisfactorily the process units for thermo-economic optimisation. This approach allows a significant improvement of information exchange between process design optimisation workflow and experimental development of process units, like the bubbling fluidised bed methanation reactor, in early stages of process development.
Nomenclature
a specific mass transfer area, m2/m3
am Free cross sectional area to mass flow ratio, m2/(kg/s)initial gas
A Free cross sectional area, m2
ci concentration of component i, mol/m3 h fluidised bed height, m
KG,i mass transfer coefficient, m · s-1 p partial pressure, Pa
pi partial pressure of component i, Pa
rj reaction extent of reaction j, mol/(s · kgcat)
Ri cumulative reaction extent of component i, mol/(s · kgcat)
xi molar fraction of component i, -
Greek symbols
β mass transfer coefficient, m · s-1 ε volume fraction, -
ηeff external effectiveness factor, - η dynamic viscosity, Pa · s ν stoichiometric coefficient, - ρ density, kg/m3
Subscripts and superscripts
b bubble phase
e emulsion phase (equivalent term to dense phase)
g gas
i index for chemical component meth methanation reaction
mf minimum fluidisation condition p catalyst particle
References
[1] Gassner M, Marechal F. Methodology for the optimal thermo-economic, multi-objective design of thermochemical fuel production from biomass. Computers & Chemical Engineering [Internet]. 2009 Mar [cited 2010 Oct 23];33(3):769–81. Available from: http://linkinghub.elsevier.com/retrieve/pii/S0098135408001981 [2] Gassner M. Process Design Methodology for Thermochemical Production of Fuels
from Biomass. Application to the Production of Synthetic Natural Gas from
Lignocellulosic Resources [Internet]. EPFL. ÉCOLE POLYTECHNIQUE FÉDÉRALE DE LAUSANNE; 2010 [cited 2011 Mar 3]. Available from:
http://biblion.epfl.ch/EPFL/theses/2010/4693/4693_abs.pdf
[3] Wang GG, Shan S. Review of Metamodeling Techniques in Support of Engineering Design Optimization. Journal of Mechanical Design [Internet]. 2007 [cited 2013 Feb 17];129(4):370. Available from:
http://link.aip.org/link/JMDEDB/v129/i4/p370/s1&Agg=doi
[4] Teske SL, Kopyscinski J, Schildhauer TJ, Biollaz SMA. Validating a Rate Based Model of a Fluidised Bed Methanation Reactor. Manuscript in preparation. [5] Kopyscinski J, Schildhauer TJ, Biollaz SMA. Production of synthetic natural gas
(SNG) from coal and dry biomass – A technology review from 1950 to 2009. Fuel [Internet]. Elsevier Ltd; 2010 Aug [cited 2010 Oct 13];89(8):1763–83. Available from: http://linkinghub.elsevier.com/retrieve/pii/S0016236110000359
[6] Gassner M, Maréchal F. Thermo-economic process model for thermochemical production of Synthetic Natural Gas (SNG) from lignocellulosic biomass. Biomass and Bioenergy [Internet]. 2009 Nov [cited 2013 Feb 11];33(11):1587–604. Available from: http://linkinghub.elsevier.com/retrieve/pii/S0961953409001639
[7] Gassner M, Maréchal F. Thermodynamic comparison of the FICFB and Viking gasification concepts. Energy [Internet]. 2009 Oct [cited 2011 May 27];34(10):1744– 53. Available from: http://linkinghub.elsevier.com/retrieve/pii/S0360544209001856 [8] Ong Y-S, Nair PB, Lum KY. Max-min surrogate-assisted evolutionary algorithm for
robust design. Evolutionary Computation, IEEE Transactions on. 2006;10(4):392– 404.
[9] Gorissen D, Couckuyt I. A surrogate modeling and adaptive sampling toolbox for computer based design. The Journal of Machine … [Internet]. 2010 [cited 2013 Feb 28];11:2051–5. Available from: http://dl.acm.org/citation.cfm?id=1859919
[10] Kopyscinski J. Production of synthetic natural gas in a fluidized bed reactor [Internet]. 2010 [cited 2011 Mar 25]. Available from:
http://e-collection.ethbib.ethz.ch/eserv/eth:1059/eth-1059-01.pdf
[11] Kopyscinski J, Schildhauer TJ, Biollaz SMA. Methanation in a fluidized bed reactor with high initial CO partial pressure Part II Modeling and sensitivity study. Chemical Engineering Science [Internet]. Elsevier; 2011 Dec [cited 2011 Jan 24];66(8):1612– 21. Available from: http://linkinghub.elsevier.com/retrieve/pii/S0009250910007426
[12] Kopyscinski J, Schildhauer TJ, Biollaz SMA. Fluidized-Bed Methanation: Interaction between Kinetics and Mass Transfer. Industrial & Engineering Chemistry Research [Internet]. 2011 Mar 2;50(5):2781–90. Available from:
http://pubs.acs.org/doi/abs/10.1021/ie100629k
[13] Stewart W, Caracotsios M. Computer-aided modeling of reactive systems [Internet]. John Wiley & Sons, Inc.; 2008 [cited 2013 Feb 28]. Available from:
http://dl.acm.org/citation.cfm?id=1370956
[14] Scala F. Mass Transfer around Active Particles in Fluidized Beds. cdn.intechweb.org [Internet]. [cited 2013 Feb 11]; Available from:
http://cdn.intechweb.org/pdfs/13550.pdf
[15] Cassiere G, Carberry J. The interphase catalytic effectiveness factor-activity, yield and non-isothermality. Chem. Eng. Educ [Internet]. 1973 [cited 2013 Feb 21]; Available from:
http://scholar.google.com/scholar?hl=en&btnG=Search&q=intitle:The+interphase+ca talytic+effectiveness+factor:+activity,+yield+and+Non-isothermality#0
[16] Jones D, Schonlau M, Welch W. Efficient global optimization of expensive black-box functions. Journal of Global optimization [Internet]. 1998 [cited 2013 Feb 22];455–92. Available from: http://www.springerlink.com/index/M5878111M101017P.pdf
[17] Rasmussen CE, Williams C. Gaussian Processes for Machine Learning [Internet]. Gaussian Processes for Machine Learning. The MIT Press; 2006. Available from: http://www.gaussianprocess.org/gpml/
[18] Van Dam ER, Husslage B, Den Hertog D, Melissen H. Maximin Latin Hypercube Designs in Two Dimensions. Operations Research [Internet]. 2007 Jan 1 [cited 2013 Feb 28];55(1):158–69. Available from:
http://or.journal.informs.org/content/55/1/158.short
[19] Bonnans JF, Gilbert, Lemaréchal C, Sagastizábal C. Numerical Optimization -- Theoretical and Practical Aspects. Springer Verlag, Berlin; 2006.
[20] Crombecq K, Gorissen D, Deschrijver D, Dhaene T. A Novel Hybrid Sequential Design Strategy for Global Surrogate Modeling of Computer Experiments. SIAM Journal on Scientific Computing [Internet]. 2011 Jan [cited 2013 Feb 21];33(4):1948– 74. Available from: http://epubs.siam.org/doi/abs/10.1137/090761811
[21] Toal DJJ, Keane AJ. Non-stationary kriging for design optimization. Engineering Optimization [Internet]. 2012 Jun [cited 2013 Feb 28];44(6):741–65. Available from: http://www.tandfonline.com/doi/abs/10.1080/0305215X.2011.607816
[22] Couckuyt I, Forrester a., Gorissen D, De Turck F, Dhaene T. Blind Kriging: Implementation and performance analysis. Advances in Engineering Software [Internet]. Elsevier Ltd; 2012 Jul [cited 2013 Feb 27];49:1–13. Available from: http://linkinghub.elsevier.com/retrieve/pii/S0965997812000476
![Figure 3: Flow chart of the surrogate modelling process [9].](https://thumb-us.123doks.com/thumbv2/123dok_us/806464.2601948/5.892.88.806.535.1082/figure-flow-chart-surrogate-modelling-process.webp)
![Figure 4: Scheme of the two phase fluidised bed model from [10].](https://thumb-us.123doks.com/thumbv2/123dok_us/806464.2601948/6.892.97.806.572.983/figure-scheme-phase-fluidised-bed-model.webp)