effects on the composition
and properties of lipids in
wheat flour
Byoung-hyun Min
This copy of the thesis has been supplied on condition that anyone who consults it is understood to recognise that its copyright rests with the author and that use of any information derived there from must be in accordance with current UK Copyright Law. In addition, any quotation or extract
must include full attribution
Rothamsted Research / Quadram Institute Bioscience
September 2017
A thesis submitted for the degree of Doctor of Philosophy to the
University of East Anglia
i | P a g e
ABSTRACT
Being valued at £3.4 billion per annum and producing 4 billion loaves a year, the UK breadmaking industry is vast. Due to this, much research has focused on improving breadmaking quality.
Breadmaking quality is significantly affected by flour lipids which play a crucial role at various stages of breadmaking. For example, during the initial stages of dough development, lipids can adsorb to the surface of gas bubbles, stabilizing them, allowing air retention in the dough. This stability helps provide the loaf volume, crumb structure and quality associated with UK bread.
Despite the importance of lipids in breadmaking, limited research has been carried out on grain and flour lipids. No evidence of significant genetic control of wheat grain lipids had been reported, and wheat lipids were not considered a suitable target for improving breadmaking quality.
Therefore, in this project, six wheat lines grown under three nitrogen conditions in 2012-13 were milled and analysed using a ‘lipodomics platform.’ This provided flour lipid profiles, allowing the use of multivariate statistics to identify the effects of genotype, environment or GxE effects on individual lipid species.
A previous project identified QTL (Quantitative Trait Loci) for milling and baking quality parameters using a doubled haploid (DH) population from a cross between two UK breadmaking cultivars, Malacca and Hereward. Four robust QTLs for gas cell number and loaf volume located on chromosomes 1B, 4D, 6A and 7A were selected, and near isogenic lines (NILs) with a good or poor quality allele in the Malacca background were obtained. Lipidomic analysis across two years identified lipids associated with these alleles, allowing the correlation of the lipid profile with the good or poor quality alleles at the four loci. The functional significance of any differences in lipid composition was explored by extracting dough liquor and analysing their surface properties.
ii | P a g e
Contents
ABSTRACT ... i
Contents ... ii
List of Figures ... viii
List of Tables ... xi Abbreviations ... xii Acknowledgements ... xvi Introduction ... 1 Chapter 1 1.1 Wheat ... 1 1.1.1 A Brief History ... 1
1.1.2 The development of wheat as a modern crop ... 1
1.2 Introduction to UK wheat breeding ... 4
1.2.1 Wheat in the United Kingdom ... 4
1.2.2 Brief introduction to breeding in the UK (Yield) ... 5
1.2.3 Breeding for quality in the UK ... 8
1.3 The Wheat Grain ... 9
1.3.1 Pericarp ... 9
1.3.2 Aleurone Layer ... 10
1.3.3 Starchy Endosperm ... 10
1.3.4 The Embryo (Germ) ... 11
1.3.5 Wheat Flour and Milling ... 11
1.4 The significance of improving wheat quality ... 12
1.5 Breadmaking and Quality ... 14
1.5.1 Historical perceptions of bread quality in the West ... 15
1.5.2 Breadmaking: an overview ... 16
1.5.3 CBP (Chorleywood Breadmaking Process) ... 16
1.5.4 Importance of various stages of breadmaking on final loaf quality ... 18
1.6 Wheat Proteins ... 19
1.6.1 The classification of wheat proteins ... 19
1.6.2 The Gluten Proteins ... 20
1.6.3 HMW glutenin subunits and their role in breadmaking ... 21
iii | P a g e 1.7 Starch ... 25 1.7.1 Summary ... 25 1.7.2 Starch crystals ... 27 1.7.3 Starch granules ... 27 1.7.4 Wheat starch ... 29 1.7.5 Importance of Starch ... 30
1.7.6 Factors affecting starch and its impact on breadmaking quality ... 31
1.7.7 Enzyme activity on starch and the Hagberg Falling Number ... 32
1.7.8 Impact of starch damage through milling ... 32
1.8 Enzymes ... 32 1.8.1 Amylases ... 32 1.8.2 Proteases ... 33 1.8.3 Other enzymes ... 34 1.8.4 Lipases ... 35 1.8.5 Lipases in breadmaking ... 36 1.9 Lipids ... 37 1.9.1 Classification of lipids ... 37 1.9.2 Lipid biosynthesis ... 40
1.9.2.1 Fatty Acid Synthesis ... 40
1.9.2.2 Triacylglycerol synthesis ... 44
1.9.2.3 Biosynthesis of other Lipids ... 46
1.9.3 Introduction to the lipid classes in wheat ... 48
1.9.4 Effects of Saturations ... 51
1.9.5 The Key to Gas Cell Stability ... 52
1.9.6 Effects on Loaf Volume ... 52
1.10 Environmental effects on wheat grain lipids ... 54
1.11 Wheat genetics ... 54
1.11.1 Summary ... 54
1.11.2 Breadmaking quality QTLs ... 56
1.12 Final Remarks and Thesis Aims ... 56
Materials and Methods ... 59
Chapter 2 2.1 Materials ... 59
2.1.1 Wheat cultivars ... 59
iv | P a g e
2.1.3 Analytical standards ... 61
2.2 Methods... 61
2.2.1 Sample preparation, growth and storage ... 61
2.2.1.1 Milling and Storage ... 61
2.2.1.2 Six UK cultivars ... 62
2.2.1.3 Malacca xHereward Near Isogenic Lines (NILs) ... 63
2.2.1.4 Malacca x Hereward Double Haploid (DH) population ... 63
2.2.1.5 Dough Liquor Preparation ... 64
2.2.2 Lipidomic Analysis ... 64
2.2.2.1 Lipid Extraction from Flour ... 64
2.2.2.2 Lipid extraction from dough liquor ... 64
2.2.2.3 Principles of acid catalysed esterification of fatty acids ... 65
2.2.2.4 Fatty acid esterification ... 67
2.2.2.5 Fatty Acid Methyl Esters (FAMEs) Gas Chromatography-Flame Ionization Detector (GC-FID)... 67
2.2.2.6 Electrospray Ionization-tandem triple quadrupole Mass Spectrometry (ESI-MS/MS) . 67 2.2.2.7 Quantitative Lipid Analysis ... 69
2.2.3 Quality control of lipidomic data ... 70
2.2.3.1 Determination of Calibration Factors for Lipid Groups... 70
2.2.3.2 TLC-GC-FID ... 70
2.2.3.3 Fitting a predictive model ... 71
2.2.3.4 Fitted models for WGIN lipids (Chapter 3) ... 72
2.2.3.5 Fitted models for MxH NIL lipids (Chapter 4) ... 73
2.2.3.6 Determination of starch damage ... 76
2.2.4 Biophysical Analysis... 76
2.2.4.1 First Ten Angstrom (FTA) Pendant drop ... 76
2.2.4.2 Measuring Surface Tension ... 77
2.2.4.3 Reducing contamination ... 78
2.2.4.4 Dough Liquor interfacial properties ... 78
2.2.5 Sodium Dodecyl Sulphate-Polyacrylmide Gel Electrophoresis (SDS-PAGE) ... 79
2.2.5.1 SDS-PAGE of Flour MxH DH population ... 79
2.2.6 Data Processing and Statistics ... 80
2.2.6.1 Multivariate Statistics ... 80
2.2.6.2 Procrustes Analysis ... 80
v | P a g e
Genetic and Environmental effects on intrinsic wheat lipids ... 82
Chapter 3 3.1 Introduction ... 82
3.1.1 A short description of each cultivar ... 82
3.1.2 Nitrogen treatments ... 85
3.1.3 Project Aims ... 85
3.2 Results ... 86
3.2.1 FAMEs analysis ... 86
3.2.2 Effects of genotype and environment on specific lipid classes ... 88
3.2.3 Effects of Genotype and Nitrogen on Lipid Classes ... 90
3.2.4 ANOVA on lipid class totals ... 91
3.2.5 Effects of Genotype and Nitrogen on Lipid Species ... 93
3.2.6 Multivariate Statistical analysis ... 97
3.2.7 Sample Description and Starch Damage ... 99
3.2.8 The effects of genotype and environment on the levels of saturated lipids ... 100
3.3 Discussion ... 102
3.3.1 Impact on PLs ... 102
3.3.2 Impacts on NLs ... 103
3.3.3 Effects of Environment and potential GxE effects ... 104
3.3.4 Differences between the cultivars ... 105
3.4 Concluding Remarks ... 106
Investigating the genetic effects of the MxH NILs on the lipid profile of wheat flour Chapter 4 ... 108
4.1 Introduction ... 108
4.1.1 Brief Introduction to the Malacca x Hereward Doubled Haploid Population ... 108
4.1.2 Generation of the NILs ... 109
4.1.3 Relating gas cell stability to cell number and loaf volume ... 111
4.2 Results and Discussion ... 113
4.2.1 Proportions of lipid classes across the two years ... 113
4.2.2 Univariate ANOVA analysis of data ... 116
4.2.3 Independent QTL effects on the lipid composition of the NILs ... 116
4.2.4 Allelic effects on PLs in Years 1 and 2 ... 118
4.2.5 Effect of QTLs and alleles on GL in Year 1 and Year 2………124
vi | P a g e
4.2.7 Multivariate Statistical Analysis ... 127
4.2.8 CVA for full lipid datasets in Years 1 & 2... 128
4.2.9 CVA for phospholipids ... 130
4.2.10 CVA for Galactolipids ... 132
4.2.11 CVA on Neutral lipids ... 136
4.2.12 Effect of year x QTL x allelic effects... 139
4.2.13 CVA of the full dataset over the two years ... 140
4.2.14 Procrustes Analysis of the full dataset ... 143
4.3 Discussion ... 145
4.3.1 Degradation of PC-LPC ... 145
4.3.2 Impact of QTL x allele effects on the PL composition of the NIL population ... 145
4.3.3 Impact of QTL x allele effects on the NL composition of the NIL population ... 146
4.3.4 Impact of QTL x allele effects on the GL composition of the NIL population ... 147
4.3.5 Environmental effects ... 147
4.3.6 Conclusions ... 148
Investigating the Functionality of the MxH NILs ... 150
Chapter 5 5.1 Introduction ... 150
5.1.1 Bubble and Foam formation and stability ... 150
5.1.1.1 Drainage ... 151
5.1.1.2 Coalescence ... 151
5.1.1.3 Disproportionation ... 152
5.1.2 Bubble formation and stability in breadmaking ... 153
5.1.3 Studying the aqueous phase of dough ... 155
5.2 Development of a diluted DL extraction method ... 156
5.2.1 Diluted Dough liquor Preparation ... 156
5.2.2 Surface properties of diluted dough liquor... 158
5.2.3 DL MS analysis of the various dilutions ... 160
5.3 Results ... 162
5.3.1 Dough Liquor surface properties of the MxH NILs in year 1 ... 162
5.3.2 Surface Tension of Year 1 (2013) Material ... 163
5.3.3 Surface tension of Year 2 (2015) material ... 167
5.3.4 Elasticity Modulus of Year 2 (2015) material ... 170
5.3.5 Lipidomic analysis of diluted dough liquor fractions in Year 1 ... 172
vii | P a g e
5.3.7 The enrichment of specific lipid classes in the diluted dough liquor fraction ... 174
5.4 Discussion ... 177
FAMEs analysis of the MxH DH population ... 180
Chapter 6 6.1 Introduction ... 180
6.1.1 DH production ... 180
6.1.2 The MxH doubled haploid population ... 181
6.1.2.1 Simple Sequence Repeats (SSR) ... 183
6.1.2.2 Diversity Arrays Technology (DArT) ... 183
6.1.3 SDS-PAGE analysis ... 184
6.2 Results ... 185
6.2.1 FAMEs-GC analysis ... 185
6.2.2 QTL mapping of the fatty acids in wheat flour ... 186
6.3 Summary and Discussion ... 188
Overall Discussion and Future Work ... 189
Chapter 7 7.1 Discussion and Conclusions... 189
7.2 Improvements and Future Work ... 191
Appendix ... 194 Chapter 8 References ... 225 Chapter 9 Publication ... 238 Chapter 10
viii | P a g e
List of Figures
Figure 1.1. The routes of expansion of wheat across Eurasia and Africa. ... 2
Figure 1.2 The pedigree of selected important wheat varieties in the development of modern wheat cultivars in the UK. ... 6
Figure 1.3 Simplified pedigrees of the key semi-dwarf varieties developed by Plant Breeding Institute in the mid-1980s. ... 7
Figure 1.4 Structure of wheat kernel……….…….12
Figure 1.5 2014 UK wheat crop by end-use category ... 13
Figure 1.6 Diagram displaying the different steps involved in the Chorleywood breadmaking process ... 18
Figure 1.7 SDS-PAGE of HMW subunits from a range of genotypes of wheat.. ... 22
Figure 1.8 The effects of proteins, protein + lipid, added PINA, PINB and protein on the foam stability. Taken from Dubreil et al., 1997 ... 24
Figure 1.9 Structural sections of amylose and amylopectin, shown in Haworth representation. ... 26
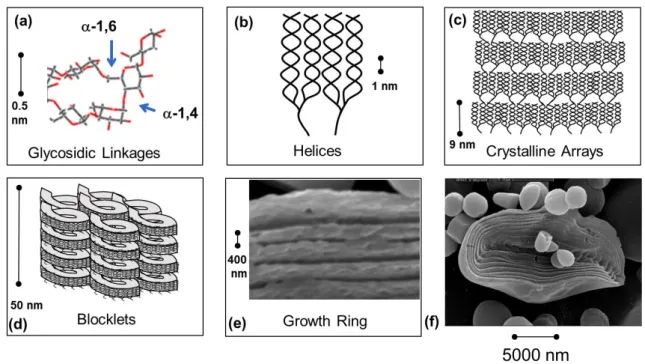
Figure 1.10 Structure of various starch components ... 29
Figure 1.11 The oxidative deterioration of carotenoids by lipoxygenases. ... 36
Figure 1.12 The subdivision of wheat flour lipid classes and their proportions ... 37
Figure 1.13 Structures of the primary phospholipids present within the wheat grain. ... 39
Figure 1.14 Structures of the galactolipids and neutral lipids present within wheat ... 40
Figure 1.15 The overall reaction of fatty acid synthase ... 43
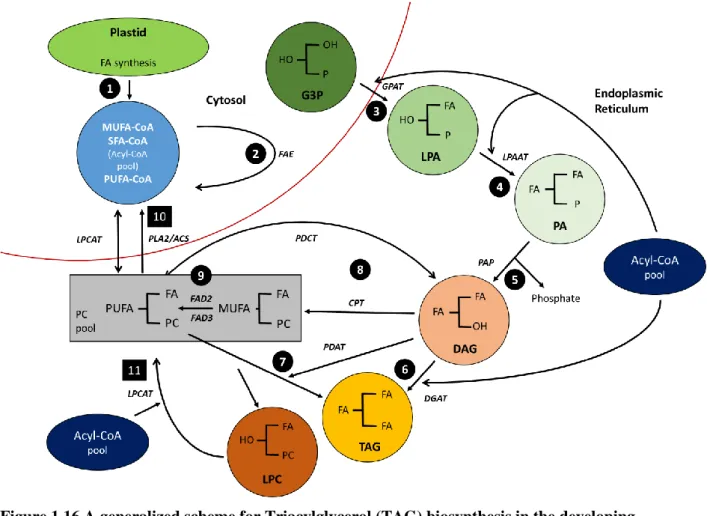
Figure 1.16 A generalized scheme for Triacylglycerol (TAG) biosynthesis in the developing seeds of oilseeds. ... 45
Figure 1.17 The prokaryotic and eukaryotic pathways of glycerolipid synthesis. A- Prokaryotic pathway, B- Eukaryotic pathway ... 47
Figure 1.18 Gas cell formation and development during various stages of the breadmaking process . 53 Figure 1.19 The chromosomes of the wheat genome ... 55
Figure 2.1 Aerial image of the WGIN variety trial using over 25 cultivars. ... 62
Figure 2.2 Field plots of the Malacca x Hereward Near Isogenic Lines grown by the John Innes Centre, Norwich ... 63
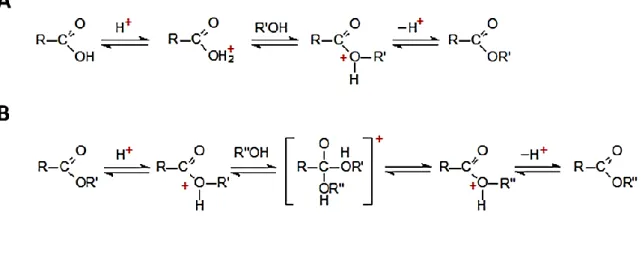
Figure 2.3 Schematic for the acid catalysed esterification (A) and transesterification of lipids (B) .... 66
Figure 2.4 Reaction of dimethoxypropane as a water scavenger. ... 66
Figure 2.5 Diagram of electrospray ionization. ... 68
Figure 2.6 Schematic of the ESI triple quadrupole mass spectrometer ... 68
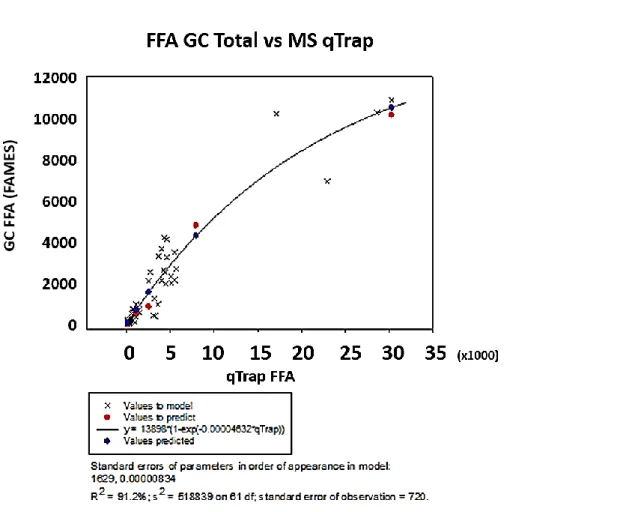
Figure 2.7 The fitted asymptotic exponential curve for the FFA data from the ESI-MS/MS and GC-FID for the WGIN lipids 2013. ... 72
Figure 2.8- The fitted asymptotic exponential curve for the TAG data from the ESI-MS/MS and GC-FID for the WGIN lines in 2013 ... 73
Figure 2.9 Fitted curve for the FFA data from the ESI-MS/MS and GC-FID for the MxH NILs in 2013 and 2015 ... 74
Figure 2.10 Fitted curve for the TAG data from the ESI-MS/MS and GC-FID for the MxH NILs in 2013 and 2015 ... 75
ix | P a g e
Figure 2.11 (A) Diagram of FTA pendant drop (B) Droplet image taken using FTA pendant drop to
measure the surface tension of dough liquor fraction. ... 77
Figure 3.1 Dry weights of fatty acids present in the wheat flour of six cultivars grown in three nitrogen conditions. ... 87
Figure 3.2. Lipid profile (mol% of total lipids analysed) of the six UK wheat varieties grown under three different nitrogen conditions 100, 200 and 350kg/N/Ha, excluding galactolipids ... 90
Figure 3.3 Comparison of selected phospholipids (mol% of total lipids) between the six cultivars. ... 94
Figure 3.4 Comparison of LPC and PE (mol % of total lipids) between the six cultivars ... 95
Figure 3.5 Lipid compositions of selected neutral lipids between the three nitrogen conditions ... 96
Figure 3.6 Canonical Variates Analysis (CVA) for the six cultivars in three nitrogen conditions. ... 98
Figure 3.7 Starch damage analysis of the six cultivars grown in three nitrogen conditions ... 99
Figure 3.8 The % nanomoles of the total FFA and LPC between for Unsaturated and Saturated Fatty Acids. ... 101
Figure 3.9 Summary of the heritability of dietary fibre and other biological components in the wheat grain, based on the HEALTHGRAIN study. ... 105
Figure 4.1 Simplified schematic of the generation of the MxH NILs... 110
Figure 4.2 Proportions of specific classes of lipids present in the four MxH NIL populations in Year 1 ... 113
Figure 4.3 Proportions of specific classes of lipids present in the four MxH NIL populations in Year 2 ... 114
Figure 4.4 Mol% of total lipids accounted by LPC + PC levels in the wheat grain across the two years. ... 115
Figure 4.5 Mol % of total lipids for the six lipid classes across the four bulked QTLs ... 117
Figure 4.6 Comparison of selected minor phospholipids (mol % of total lipids) between M and H NILs among the four QTLs in Year 1 ... 119
Figure 4.7 Comparison of major phospholipids (mol% of total lipids) between M and H NILs among the four QTLs in Year 1 ... 120
Figure 4.8 Comparison of minor phospholipids (mol % of total lipids) between M and H NILs among the four QTLs in Year 2. ... 121
Figure 4.9 Comparison of selected major phospholipids (mol % of total lipids) between M and H NILs among the four QTLs in Year 2 ... 122
Figure 4.10 Galactolipids present on the four QTLs and their allelic combinations in year 1. ... 123
Figure 4.11 Galactolipids present on the four QTLs and their allelic combinations in year 2 ... 124
Figure 4.12 Comparison of selected major neutral lipid species across the four QTLs and their allelic combinations in year 1 ... 125
Figure 4.13 Comparison of major neutral lipid species across the four QTLs and their allelic combinations in year 2 ... 126
Figure 4.14 Canonical Variates Analysis (CVA) for the four QTL and their allelic combinations for the full lipid dataset in year 1. ... 128
Figure 4.15 CVA analyses for the four QTL and their allelic combinations for the full lipid dataset in year 2 ... 129
Figure 4.16 CVA analyses for the four QTL and their allelic combinations for phospholipids in year 1 ... 131
Figure 4.17 CVA analyses for the four QTL and their allelic combinations for phospholipids in year 2 ... 132
x | P a g e
Figure 4.18 CVA analyses for the four QTL and their allelic combinations for galactolipids in year 1
... 134
Figure 4.19 CVA analyses for the four QTL and their allelic combinations for galactolipids in year 2 ... 136
Figure 4.20 CVA analyses for the four QTL and their allelic combinations for neutral lipids in year 1 ... 137
Figure 4.21 CVA analyses for the four QTL and their allelic combinations for neutral lipids in year 2 ... 138
Figure 4.22 CVA analyses for the four QTL and their allelic combinations for the full lipid dataset across the two years……….142
Figure 4.23 CVA analyses for the four QTL and their allelic combinations for the GL dataset across the two years ... 142
Figure 4.24 Procrustes Analysis for the full lipid dataset across the two years ... 144
Figure 5.1 Schematic of bubble disproportionation. ... 153
Figure 5.2 Comparison of the surface tension (ST) of various diluted dough liquor fractions in Hereward flour across two years ... 159
Figure 5.3 Surface elasticity of the various diluted dough liquor samples in Hereward flour across two years. ... 160
Figure 5.4 The profile of selected lipids in various dilutions of dough liquor from Hereward material grown in 2012 and 2013 ... 161
Figure 5.5 Predicted model for surface tension based on the results of the two-stage analysis, using the means of estimated parameter estimates according to the ANOVA on the sets of parameters ... 165
Figure 5.6 Predicted model for elasticity based on the results of the two-stage analysis, using the means of estimated parameter estimates according to the ANOVA on the sets of parameters. ... 167
Figure 5.7 Predicted model for surface tension based on the results of the two-stage analysis, using the means of estimated parameter estimates according to the ANOVA on the sets of parameters. ... 169
Figure 5.8 Predicted model for elasticity based on the results of the two-stage analysis, using the means of estimated parameter estimates according to the ANOVA on the sets of parameters……...173
Figure 5.9 The lipid composition of selected lipids in the diluted dough liquor fractions of the first year MxH NIL material ... 172
Figure 5.10 The lipid composition of selected lipids in the diluted dough liquor fractions of the second year MxH NIL material ... 173
Figure 5.11 proportions of specific lipids present in the diluted dough liquor fraction of the MxH NILs in the year 1 (2013) dataset ... 175
Figure 5.12 proportions of specific lipids present in the diluted dough liquor fraction of the MxH NILs in the year (2015) dataset ... 176
Figure 6.1 Schematic for the generation of the MxH DH populations ... 181
Figure 6.2 Genotype Scores for the MxH DH mapping population ... 182
Figure 6.3 SDS-PAGE of HMW glutenin subunits ... 184
Figure 6.4 FAMEs analysis of the MxH DH population. ... 185
Figure 6.5 FAMEs analysis of the total fatty acids present in the MxH DH population ... 186
xi | P a g e
List of Tables
Table 1.1 Proportions and amino acid compositions (g/100 g of protein of the major protein fraction
of flour. ... 23
Table 1.2 The amylose content, size and shape of starch granules in major plant sources... 28
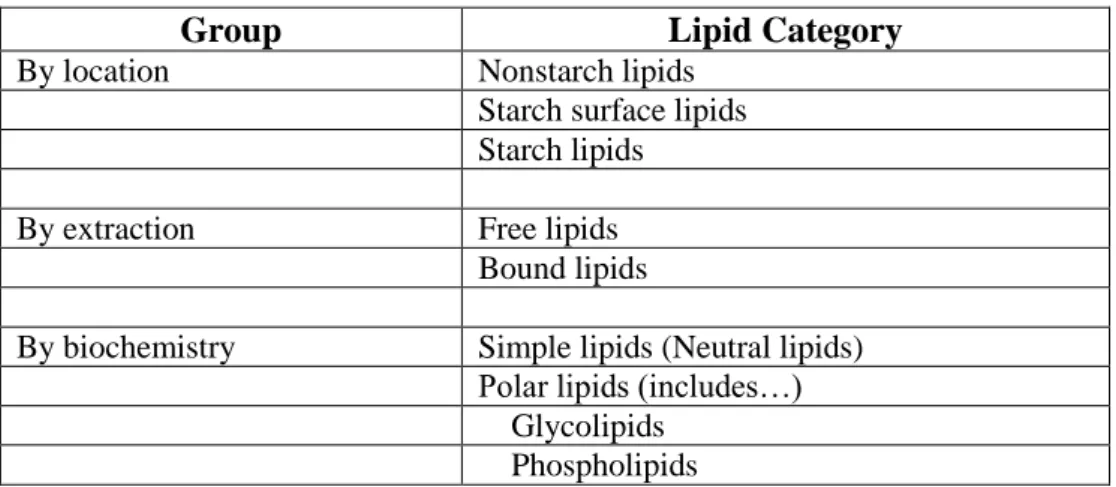
Table 1.3 Grouping of wheat flour lipids by location, extraction and biochemistry. ... 38
Table 1.4 The various common fatty acids present in plants, their systemic, trivial and shorthand name. ... 41
Table 3.1 ANOVA table for the total values of the six lipid classes. ... 91
Table 3.2 A selected list of the p-values for F-test of cultivar, nitrogen and cultivar by nitrogen interactions of all the lipid species analysed in the study ... 92
Table 4.1 Background information on the MxH NILs. ... 111
Table 4.2 Loading vectors for the three CV dimensions for the CVA analysis of GLs in year 1. ... 133
Table 4.3 Loading vectors for the three CV dimensions for the CVA analysis of GLs in year 2. ... 135
Table 5.1 Recipes for various diluted dough liquor extractions for the 2012 and 2013 material. ... 157
Table 5.2 Data on the estimated parameters for the surface tension of the MxH NIL DDL for year 1. ... 164
Table 5.3 Data on the estimated parameters for the elasticity modulus of the MxH NIL DDL in year 1 ... 166
Table 5.4 Data on the estimated parameters for the surface tension of the MxH NIL DDL in year 2 ... ..168
Table 5.5 Data on the estimated parameters for the elasticity modulusof the MxH NIL DDL in year 2 ... 171
xii | P a g e
Abbreviations
ACP Acetyl Carrier Protein
ACS Acyl-CoA synthetase
AFM Atomic Force Microscopy
AHDB Agriculture and Horticulture Development Board
ANOVA Analysis of Variance
ATP Adenosine Triphosphate
AX Arabinoxylan
BFP Bulk Fermentation Process
CBP Chorleywood Breadmaking Process CCA Canonical Correlation Analysis
CDP Cystidine 5’-diphosphate
CMP Cytidine monophosphate
CoA Acetyl Coenzyme A
CTP Cystidine 5’-triphosphate CVA Canonical Variates Analysis DAG Diacylglycerol DArT Diversity Arrays Technology DATEM Diacetyl-tartrate ester of monoglyceride DDL Diluted Dough Liquor DEFRA Department for Environment Food and Rural Affairs
DGAT Diacylglycerol Acyltransferase
DGDG Digalacosyldiglycerol
DH Double Haploid
DL Dough Liquor
DPC Diacyl-phosphatidylcholine ER Endoplasmic Reticulum
xiii | P a g e
ESCA Electron Spectroscopy for Chemical Analysis
ESI Electrospray Ionization
EST Expressed Sequence Tags
FA Fatty Acid
FAD Fatty Acid Desaturase
FAE Fatty Acid Elongase
FAME Fatty Acid Methyl Ester FATA/B Fatty Acyl-ACP Thioesterase A/B
FFA Free Fatty Acid
G3P Glycerol-3-Phosphate
GC-FID Gas Chromatography-Flame Ionization Detector
GL Galactolipid
GOPOD Glucose oxidase peroxidase
GPAT Glycerol-3-phosphate acyltransferase
GxE Genotype x Environment
Ha Hectare
Het Heterozygote
HFN Hagberg Falling Number
HGCA Home Grown Cereals Authority
HMW High Molecular Weight glutenin Hom Homozygote
KAS I/II/III β-ketoacyl-ACP-synthase I/II/III
LC-MS/MS Liquid Chromatography tandem Mass Spectrometry LMW Low Molecular Weight glutenin
LOOH Linoleic Acid hydroperoxide
LPA Lysophosphatidic Acid
LPAAT Lysophosphatidic Acid Acyltransferase
xiv | P a g e
LPCAT Lysophosphatidylcholine acyltransferase LPE Lysophosphatidylethanolamine
LPL Lysophospholipid
MAG Monoacylglycerol
MGDG Monogalactosyldiglycerol
MS Mass Spectrometer
MUFA Monounsaturated Fatty Acid
MxH Malacca x Hereward
NABIM National Association of British and Irish Millers NADPH Nicotineamide adenine dinucleotide phosphate NCBI National Centre for Biological Information NDNS National Diet and Nutrition Survey
NIL Near Isogenic Line
NL Neutral Lipid
nsLTP non-specific Lipid Transfer Protein
ONS Office for National Statistics
PA Procrustes Analysis
PA Phosphatidic Acid
PAGE Polyacrylamide Gel Electrophoresis PAP Phosphatidic Acid Phosphatase PBI Plant Breeding Institute
PC Phosphatidylcholine
PDAT Phospholipid:diacylglycerol acyltransferase PDCT Phosphatidylcholine:diacylglycerol choline phosphotransferase PE Phosphatidylethanolamine
PG Phosphatidylglycerol
PI Phosphatidylinostidol
xv | P a g e
PL Phospholipid
PLA1/2 Phospholipase A1/A2
PS Phosphatidylserine
PUFA Polyunsaturated Fatty Acid QTL Quantitative Trait Loci SEM Scanning Electron Microscopy SGAP Starch Granule Associated Protein
SL Sulfoquinovosyldiacylglycerol
SSL/CSL Stearoyl Lacctylates
SSR Simple Sequence Repeat
ST Surface Tension
TAG Triacylglycerol
TLC Thin Liquid Chromatography
TQMS Triple quadrupole MS
UDP Uridine diphosphate
WE-AX Water Extractable Arabinoxylan
WGIN Wheat Genetic Improvement Network WU-AX Water Unextractable Arabinoxylan
Note: Abbreviations for the chemicals and reagents used in this study can be found in the Materials and Methods (Chapter 2.1.2)
xvi | P a g e
Acknowledgements
First and foremost I would like to thank the LORD my God for his endless blessings during these last four years. Your love and grace has helped me through the difficult times and provided me with the strength to complete this chapter of my life.
I would like to express my gratitude and thanks to Professor Peter Shewry (Rothamsted Research- RRes) for giving me the opportunity to do this PhD, as well as for all the time, effort and help he has provided me throughout the last four years. I would like to sincerely thank the supervisory panel, Dr Richard Haslam (RRes) and Professor Pete Wilde (Quadram Institute Bioscience-QIB) for their expertise, guidance and advice over the last four years. Their skills and organization have made this PhD possible. I would like to thank all three for their valuable comments and corrections especially during the thesis writing. I also offer my thanks to the BBSRC CIRC (Crop Improvement Research Club) for funding this PhD.
My sincerest thanks to Dr Irene Gonzalez-Thuillier (RRes) for her patience and guidance while teaching me to use the lipidomics platform, and Dr Louise Salt (QIB) for her training and advice. I would like to thank both of them for their support both in and out of work! I would also like to thank Dr Stephen Powers (RRes) for his guidance and statistical expertise, Dr Simon Griffiths (JIC) for his advice and provision of the MxH DH population and NILs and Dr Luzie Wingen (JIC) for her help and provision of the genetic maps and marker data. I would also like to thank the many others at Rothamsted Research, Quadram Institute and the John Innes Centre who has helped me over the years. A special thanks to my friends who have made my time both fruitful and enjoyable. Two individuals in particular, Ana Machado and Simone de Chirico, I must specially mention. I could not have asked for better friends and housemates, and I will always cherish the many memories we have together! I also thank Samuel Lee for his prayers and company during the breaks I had in Korea, and Suhyun Park for giving me hope and strength, even in the most difficult of times.
To my family, thank you. Your prayers and support were invaluable. To my grandparents who hold a special place in my heart, my mother in Korea and father in the UK, thank you. My brother Byoung-in, your help and support has been incredible.
1 | P a g e
Introduction
Chapter 1
1.1 Wheat
1.1.1 A Brief History
Throughout history, humankind has achieved some truly remarkable technological advances which have allowed us to survive, multiply and simply live the current lifestyle that we know, enjoy and take for granted. However as remarkable as the telephone, internet and gunpowder have been on shaping our history, the advances made in crop science have possibly been one of the most unrecognized achievements yet. It could be argued that the development of human society was made possible due to the vast improvements made in agricultural technology. Timely developments such as the introduction of fertilizers and the green revolution have allowed us to sustain the massive rise in human population that has occurred over the last two centuries.
Of the many plants that have been domesticated for human consumption, wheat has arguably had the greatest effect on society, its impact ranging from food production to religious significance. Wheat is grown on over 216 million hectares of land, more than any other crop in the world, and over 620 million tonnes of this crop is produced every year (FAOSTAT, 2014).
1.1.2 The development of wheat as a modern crop
Numerous types of wheat have evolved over approximately 10,000 years of cultivation. Early botanists such as Columella, from the classical period, and 16th-17th century herbalists, divided wheat into two groups. These were Triticum, the free-threshing wheats, such as our modern day bread wheat, and Zea, the hulled wheats such as einkorn, emmer and spelt.
Wheats belong to the Poaceae family (grasses) and occur in diploid, tetraploid and hexaploid form. The wild diploid T.boeoticum is the ancestor of domesticated einkorn, T.monococcum (AA genome) while tetraploid wheats include wild emmer (T.dicoccoides) (AABB) which is the ancestor of domesticated emmer (T.turgidum subspecies dicoccon). Durum wheat (T.durum; T.turgidum subsp. durum) mainly used for semolina and pasta was developed by the artificial selection of domesticated emmer wheat strains, which developed into a naked free threshing form. Bread wheat (T.Aestivum) and spelt (T.spelta; T.dicoccum) are both hexaploid (AABBDD).
2 | P a g e
By observing genetic relationships between wild and domesticated einkorn and emmer, it has been suggested that the region west of the Diyarbakir in south-eastern Turkey is where cereal domestication first began approximately 10,000 years ago (Heun et al., 1997, Ozkan et al., 2005 and Luo et al., 2007).
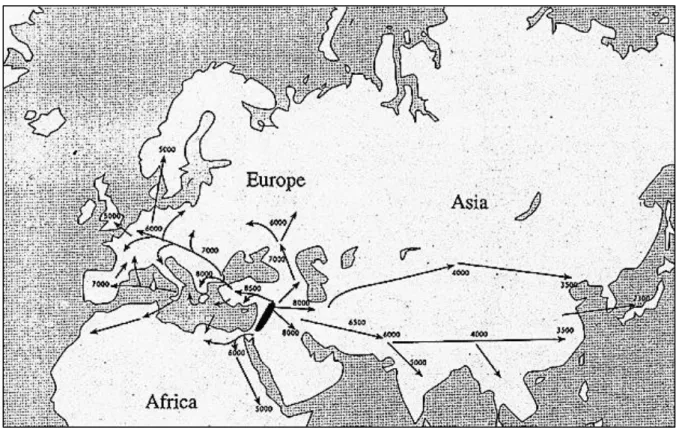
Domesticated einkorn and emmer began its dissemination across Asia, Europe and Africa (Figure 1.1). This spread led to gene exchange between various wild and domesticated emmer species together with wild grasses, notably Aegilops tauschii (genomes DD) leading to the emergence of hexaploid bread wheat (T.aestivum, genomes AABBDD) within the area ranging from Armenia to the south-western coastal areas of the Caspian Sea (Dvorak et al., 1998).
Figure 1.1. The routes of expansion of wheat across Eurasia and Africa. The date of the earliest wheat cultivation in different sites is indicated by years BP (Before Present- Present being 1950) (Taken from Bonjean and Angus, 2011)
Ploidy, the number of sets of chromosomes, can provide advantages to plants as polyploidy brings new genomes into a specie. For bread wheat, the introduction of the DD genome brought with it enhanced cold hardiness and certain distinct morphological features. Ploidy levels can also influence
3 | P a g e
various plant characteristics, for example, plants at higher levels of ploidy tend to have larger cell sizes, while wheats that exist within one ploidy level are more closely related to each other.
The success of bread wheat has largely been attributed to its adaptability to diverse environments and end use properties. This adaptability and diversity is rather surprising considering the genetic bottlenecks wheat has undergone from recent domestication and polyploidy speciation events (Dubcovsky and Dvorak, 2007). Currently approximately 95% of the wheat crop today is hexaploid bread wheat used for bread, cookies and pastries while the other 5% is made up of tetraploid durum wheat, grown for semolina products such as pasta.
Many of the useful qualities associated with wheat arose from the genetic changes associated with what is known as the domestication syndrome (Hammer, 1984). When wheat ripens, spike shattering occurs which scatters the grain. For agriculture this is generally an undesirable process leading to the loss of spike shattering through domestication, facilitating harvest. Also the tough glumes which tightly enveloped the seed to protect it during seed dispersal were lost, converting hulled grain into free-threshing varieties (Nalam et al., 2006; Jantasuriyarat et al., 2004). Other important traits associated with the wheat domestication syndrome include increased seed size, more erect growth and reduced seed dormancy. Various genes were found to be relevant to these traits such as GPC-B1, an early regulator of senescence with pleiotropic effects on grain nutrient content, affecting seed size. A recessive mutation at the Tg (tenacious glume) loci accompanied by the modifying effects of the dominant mutation at the Q locus, and mutations at several other locations are the primary genetic determinants of the free threshing trait (Simons et al., 2006; Uauy et al., 2006). Although many of the genes that played a role in the wheat domestication syndrome have now been investigated, there is still much to uncover. However, it is clear that genetic exchange and variation has played a crucial role in the success of wheat as a modern crop.
Wheat has a remarkably high rate of DNA replacement. In fact, it has been noted that indel polymorphisms (the insertion and deletion of bases in the DNA of an organism) from both chimpanzee and human genomes is less than 4% of the intergenic regions of wheat (Dubcovsky and Dvorak, 2007). There are cases where such genome evolution has led to useful wheat characteristics. For example, vernalisation is highly important in flowering plants where the seed is exposed to cold in order to accelerate the plants flowering process. The need for vernalisation was removed by inserting repetitive elements within the regulatory regions of the wheat VRN1 and VRN3 vernalisation genes, and by four large deletions within the VRN first intron (Yan et al., 2004; Fu et al., 2005). The method characterized different VRN-1 and VRN-3 alleles using markers listed in the publication. The markers amplified sequences in two specific regions, the promoter and first intron, where a series of insertions, deletions and duplications account for the different alleles and their function. Interestingly, there are
4 | P a g e
cases where such deletions have resulted in increased diversity in traits that affect processing properties. For example, deletions of the Puroindoline A and B genes on the A and B genomes of the plant are responsible for the grain hardness of durum wheat. Also, polymorphism such as the Puroindoline A deletion or the point mutation in Puroindoline B in the hexaploid wheat D genome dramatically affects grain hardness. This allows the classification of hexaploid bread wheat into the cultivars with a hard texture for breadmaking, and those with a soft texture for cakes, pastries, livestock feed and alcohol production, bioethanol and distillation (Giroux et al., 1998). Further information or the puroindoline genes can be found in section 1.6.5.
Various genes are known to control aspects of wheat quality and understanding this is important to underpin the improvement of quality by wheat breeding. This will result in benefits to grain processors and consumers and reduce the cost of importing high quality wheats, which usually account for about 15% of the grain used for milling and food processing.
1.2 Introduction to UK wheat breeding
Over thousands of years of breeding and selection, bread wheat has developed to become one of our primary food sources along with rice and maize. Even the bread wheat of merely 100 years ago differs to modern day wheat, as its physical appearance has been modified by the introduction of dwarfing genes.
In the future, the strains and challenges on global agriculture will increase. The continuous demand to sustain a rising population, the stresses of climate change, disease resistance and the demand of developing economies for a more westernized diet, are just some of the challenges wheat breeders need to address in the 21st century. Fortunately, recent developments in molecular biology, bio-informatics and marker technology has allowed us to learn more about the complex genome of wheat. Now, wheat breeding programmes have been provided with the tools to meet these rising challenges.
1.2.1 Wheat in the United Kingdom
In the UK, wheat is the major arable crop (by area) with an annual planting of approximately 1.9 million hectares. The east of England including East Anglia, the south-east and the east midlands together account for more than 58% of the wheat grown in the UK. The UK produces around 11-18 million tonnes of wheat a year, a figure mainly dependent on climatic factors. Most of the wheat grown in the UK is winter wheat, which is planted in the autumn generally between September and
5 | P a g e
November, and accounts for more than 95% of the UK grain used by millers. Spring wheat is planted between January-March and tends to have lower yields. The main source of imported wheat in the UK is the European Union from which over 1 million tonnes of wheat is imported, primarily from France and Germany. Imports from non-EU trading partners accounted for 493,897 tonnes of wheat, mainly from North America (Statista).
Wheat production in the UK is usually highly intensive with high levels of nitrogen fertilizer, fungicide and plant growth regulator input. Yields of over 12 tonnes per hectare are not unusual, and the world record wheat yield came from the UK in Northumberland with a yield of 16.52 tonnes per hectare, until it was very recently broken on the 17th February 2017 by a farmer in New Zealand who achieved a yield of 16.791 tonnes/ha. In addition to intensive farming practices, such yields are possible due to the mild UK climate in both winter and summer. The mild winters allow the crop to continue growing during the short days of winter, and the mild summers bring long grain filling periods and minimal exposure to drought.
1.2.2 Brief introduction to breeding in the UK (Yield)
The introduction of agricultural knowledge to northern Europe is believed to have come as late as 5000 BC (Murray, 1970), significantly later than China in 11,500 BC and the Levant in 9500 BC. Wheat is believed to have been introduced into the UK by Neolithic settlers around 2400 BC. However it was only during the time of the Roman Empire that wheat farming really developed and trading opportunities were established.
Over history, wheat yields rose, which was greatly accelerated after the 19th century due to the introduction of improved practices. In the Middle Ages changes in crop rotational practices with better agricultural equipment led to increases in yield. Although the estimate of yield in this period is inaccurate, wheat yields between 1200-1400 AD is believed to have reached as high as 540-605 kg per Ha (Bennett, 1968). With better rotations and increased stocking, yields are thought to have increased to around 750-1000 kg per Ha around the latter half of the 17th century. The 18th century saw considerable increases as arable management improved. Bennett estimates yields in this period reaching 1.7 t/Ha. By 1914, with agricultural intensification and the development of better varieties, yields rose to around 2 tonnes per hectare.
In the latter part of the 19th century entrepreneurial agriculturists practiced selection in wheat populations to produce superior lines. These were multiplied and sold as new varieties. However, these were small scale operations as there was little reward to incentivise their efforts. However some
6 | P a g e
of these early breeders imported varieties from overseas for commercialization, which would have significant impacts on UK wheat breeding.
The variety Sheriff (1873) started off wheat selection programmes in the UK, being used to develop many new varieties such as Sherriff’s Bearded Red, Sheriff’s Bearded White, Pringle (1875) and Sherriff’s Squarehead (1882). Another variety Biffen was also widespread in the early parts of the 20th century. These newer varieties provided better yields and agronomic traits. Recognising the potential behind wheat breeding, the Plant Breeding Institute (PBI) was developed in 1912, as part of the Cambridge School of Agriculture.
In 1916 the variety Yeoman (Browick x Red Fife) was released. This variety was a significant milestone in UK wheat breeding due to its hard milling grain with high yield potential and superior breadmaking quality. Red Fife was a Canadian variety, more details of which can be found in Chapter 3. The variety Holdfast was a pedigree of Yeoman and White Fife which was released in 1936 with even higher yield potential and good breadmaking quality. Holdfast was an excellent cultivar whose dominance was not really challenged until the release of Maris Widgeon in 1964 over 25 years later.
Figure 1.2 The pedigree of selected important wheat varieties in the development of modern wheat cultivars in the UK. Highlighted are the specific varieties described in this thesis.
The next significant milestone came from the introduction of Maris Huntsman, Maris Beacon and Maris Nimrod in the early 1970s. Maris Huntsman, which the PBI released in 1972, promised 20%
7 | P a g e
higher yields than some other varieties at the time and firmly established the PBI as the most significant wheat breeder for the next 30 years. Maris Huntsman provided excellent yield, as well as good foliar disease resistance, particularly against mildew and yellow rust, which certainly helped its statistics in field trials without fungicide treatment. The pedigree of Maris Huntsman and the other pre-1980 varieties mentioned in this section is displayed in Figure 1.2.
Figure 1.3 Simplified pedigrees of the key semi-dwarf varieties developed by Plant Breeding Institute in the mid-1980s. Notable varieties discussed in the chapter are highlighted in bold.
Relatively safe from commercial pressure, the PBI now had the luxury of developing new germplasm alongside the mainstream breeding programmes. A programme introducing the Rht dwarfing genes from US derived Japanese sources was implemented by Dr FGH Lupton. From this programme, with some difficulties, semi-dwarf lines were eventually developed which completely changed the landscape of UK wheat breeding. Initially released in 1977, the semi dwarf lines, via the variety Hobbit soon dominated UK wheat production covering over 80% of the UK acreage by the late 1980s. The varieties Durin and Bilbo alongside Hobbit, contributed enormously to UK wheat breeding in the 1980s and 1990s becoming the foundation for various semi-dwarf wheat breeding programmes. These three parental lines became the source of all dwarfing genes in wheat (all Rht2) for the next 20 years.
8 | P a g e
Although Hobbit only had short term commercial success due to its poor straw strength and the breakdown of its yellow rust resistance, it was introduced around the same time as better fungicides and plant growth regulators were developed. Combining these inputs and new varieties, farmers realized they could achieve yields of 10 t/Ha (Bonjean and Angus, 2011). New PBI varieties soon overcame the agronomic weaknesses of the initial semi dwarf varieties. These included Norman (1981), Longbow (1983) and Galahad (1983) which dominated the feed wheat market in the UK. PBI varieties covered over 80% of the wheat acreage in the late 1980s, including key breadmaking varieties such as Maris Widgeon, Avalon, Bounty, Mercia, Moulin and most notably Hereward. The pedigree of the semi-dwarf varieties described above is displayed in figure 1.3.
The largest market for wheat in the UK is now animal feed. As wheat yields have risen, the proportion of grain needed for bread, biscuits and other human consumption has decreased. Despite this, bread wheat tends to have a longer market life expectancy and attracts a premium price.
1.2.3 Breeding for quality in the UK
From the introduction of the Chorleywood Breadmaking process (CBP) in the UK in the 1960s (further details of which can be found below), the UK breadmaking industry needed very specific requirements. This process could utilize poorer quality wheat with lower protein content, while still providing relatively good quality loaves of bread. This has allowed the UK to use more home grown cereals, as continental European bread making wheat tends to perform less well in CBP conditions, due to their over-strong, high protein phenotype.
The first focused attempt to breed for breadmaking quality in the UK was through the variety Biffen in the early 1900s. This attempted to use Canadian varieties to introduce breadmaking quality to UK wheats, and reduce the UK reliance on imported wheat at the time. The varieties Holdfast and Yeoman were introduced (as described above) to improve breadmaking quality as well as yield. However, much of the selection at this point was done without any firm understanding of quality trait inheritance.
It was only in the late 1970s and early 1980s when associations between high molecular weight (HMW) glutenin subunits (Payne et al., 1981, 1984) and breadmaking quality were made. With the development of sodium dodecyl sulphate (SDS-PAGE) polyacrylamide gel electrophoresis, it was possible to increase the selection efficiency for breadmaking quality varieties in the lab in a way which was impossible before. Further details on HMW-glutenin subunits, their identification and their impacts on breadmaking quality are given below.
9 | P a g e
The major determinants of breadmaking quality in most varieties are the HMW subunits, with some quality-related alleles being traced all the way back to Red Fife. The first breadmaking variety to obtain a large market share, without possessing good quality HMW-glutenin subunits was Mercia, introduced in 1986. This was followed by Hereward in 1991 and Malacca in 1999. Due to the conservative nature of major UK bread businesses, there tends to be a single dominant variety grown in the UK at any one time.
All the cultivars discussed in this section have some relevance to the varieties used in this thesis. Understanding their pedigree and origin may shed more light on the reasons why certain results were obtained in this study.
1.3 The Wheat Grain
The wheat kernel is a single seeded fruit (caryopsis) which is complex in structure, consisting of several discrete tissues. The caryopsis is ovoid in shape with a longitudinal crease down the centre. The length of the kernel will vary depending on the type of wheat and growth conditions, but generally spans between 4-8 mm.
1.3.1 Pericarp
The outmost layer, the pericarp is around 50 µm thick, surrounds the entire seed and is composed of several layers. From the outside to inside, these layers include the epidermis, hypodermis and layers of cells termed cross cells and tube cells. Firmly joined to the layer of tube cells, the last layer of the pericarp is the seed coat. In white wheat, the seed coat is made up of two layers, a thick outer cuticle, and a thin inner cuticle. The seed coat or testa is around 5-8 µm thick. Beneath the seed coat is the hyaline layer or nucellar epidermis which is around 7 µm thick.
The pericarp makes up round 5% of the wheat kernel and is made up of approximately 6% protein, 2 % ash and 0.5% fat, with the remainder being non-starch polysaccharides. Millers term the outer pericarp (epidermis) as beeswing due to its pale membranous appearance after isolation. The inner portion of the outer pericarp consists of the remnants of thin walled cells. The inner pericarp is made up of cross cell, tube cells and intermediate cells. The cross cells are long and cylindrical being around 125 x 20 µm. They are placed perpendicular to the long axis of the kernel and are tightly packed together with little or no intercellular space. The tube cells are about the same size and have
10 | P a g e
their long axis parallel to the long axis of the kernel. These unlike cross cells are not tightly packed together and therefore have plentiful intercellular space.
1.3.2 Aleurone Layer
Beneath the seed coat is the starch-rich endosperm from which white flour is produced. The endosperm consists of the outer aleurone layer and the starchy endosperm, with the aleurone layer being tightly bound to the nucellar epidermis portion of the seed coat. The aleurone layer is generally one layer thick and completely surrounds the kernel, covering both the starchy endosperm and the germ. The aleurone cells covering the starchy endosperm are thick-walled, essentially cuboid, and free of starch at maturity. The average cell is between 20-75µm in diameter.
The aleurone layer is considered to be part of the bran by millers. The aleurone cell walls are 3-4 µm thick and cell wall sugars account for about 35-40% of the dry weight (Barron et al., 2007) The aleurone cell walls are composed of 29% β-glucan, 65% arabinoxylan and only 2% each of cellulose and glucomannan (Bacic and Stone, 1981). The aleurone layer stores some enzymes and is rich in ash, protein, total phosphorus, phytate phosphorous, and lipids. There is a higher concentration of niacin, thiamine and riboflavin in the aleurone than in other parts of the bran. The aleurone layer surrounding the germ is thin walled. These cells are around 13µm thick which is around a third of the thickness of the aleurone cells surrounding the starchy endosperm.
In total, the bran making up the pericarp, seed coat and aleurone makes up over 8% of the wheat kernel weight, encasing the endosperm and parts of the germ. The bran provides protection for the wheat grain, and ensures the seed will not grow immediately after harvest due to their waterproof properties.
1.3.3 Starchy Endosperm
The starchy endosperm is composed of three types of cells that vary in size, shape and location within the kernel. These are the peripheral, prismatic and central cells. The peripheral starchy endosperm cells are the first row of cells inside the aleurone layer. The prismatic cells are elongated, extend inwards and are about 150x50x50µm in size. The central starchy endosperm cells are more irregular in size and shape than the other cells.
The endosperm makes up 80-85% of the weight of the wheat kernel, containing mostly starch and protein. The storage proteins of wheat, the gliadins, glutenins, albumins and globulins make up about
11 | P a g e
10-14% of the weight of the wheat kernel. Further details on wheat proteins can be found below (Section 1.6).
The wheat endosperm cell walls account for approximately 2-3% of the dry weight of the grain and consist mainly of arabinoxylan (AX) (70%) and (1-3, 1-4)-β-D-glucan (β-glucan) (20%). Also present are small amounts of cellulose (2%) and glucomannan (7%). Arabinoxylans (also called pentosans) can be divided into two classes, water extractable arabinoxylan (WE-AX) and water unextractable arabinoxylan (WU-AX). Starch comprises of approximately 64-75% of the milled endosperm and occurs in the form of large lenticular A granules and the small spherical B granules. Further details on wheat starch can be found below.
1.3.4 The Embryo (Germ)
The germ or embryo is on the lower end of the wheat kernel and the opposite end of the crease. The germ consists of the embryonic axis (rudimentary radicle or root and plumule or shoot) and the scutellum which functions as the storage organ (Grundas, 2003). The scutellum is attached to the plumule which forms the shoot when the seed germinates.
The germ makes up 2.5-3% of the wheat kernel and is rich in proteins (~25%) and lipid (8-13%). The wheat germ has high levels of essential vitamins such as vitamin E (Fulcher et al., 1972), vitamin B and various enzymes. Due to this, there is a demand for the wheat germ which is sometimes sold separately.
The lipid content of the germ is dominated by non-polar lipids which make up 79-85% of the total germ lipid, with low levels of phospholipids and even lower levels of glycolipids (Hargin & Morrison, 1980). The non-polar lipids are typical of spherosome lipids such as TAG and FFA; the phospholipids include PI, PG while the galactolipid DGDG can also be found. There is a high proportion of unsaturated fatty acids of which linoleic acid C18:2 is the most abundant (Mattern, 1991). Further details on the lipids can be found in Chapter 1.10.
1.3.5 Wheat Flour and Milling
The milling of the wheat grain will vary depending on what kind of end product is desired. For general purpose white bread, millers will remove the bran and germ and extract as much of the endosperm as possible for white flour. Bran is generally undesirable due to its colour which contaminates the white flour, and the germ due to its high fat content which reduces the flour keeping quality.
12 | P a g e
High extraction flours contain around 85% of the original grain, with some of the bran and germ being removed. Wholemeal flour is made from the whole wheat grain. Due to the nutritional value of the components outside the starchy endosperm, wholemeal and high extraction flours are more nutritionally beneficial.
Figure 1.4 Structure of wheat kernel. Diagram shows the Pericarp, Seed Coat, Endosperm, Germ, and its components. Image taken from the Nabim website (http://www.nabim.org.uk/wheat-structure)
1.4 The significance of improving wheat quality
Although wheat is an excellent system to explore a range of natural genetic variation, its key importance comes from its economic significance. The global wheat market is vast. Wheat is responsible for one fifth of the calories consumed worldwide, and of the many wheat products that exist; bread is by far the most prevalent. Being the second largest industry in the UK food sector and a worldwide staple, its economic value is clear. The UK bread market alone is worth £3.4 billion per
13 | P a g e
annum and sells just under 4 billion units a year. This corresponds to nearly 12 million loaves sold every single day (www.bakersfederation.org.uk, 2014)
Only 25% of the wheat produced in the UK comprises Nabim (National Association of British and Irish Millers) group 1 and 2 varieties, suitable for breadmaking. Although class 1 breadmaking wheat is produced in much smaller quantities than the lower quality feed wheats (which make up 56% of the UK wheat crop), it attracts a premium and has a longer market life expectancy.
Due to this, breeders continually develop Nabim group 1 varieties and submit them for inclusion on the AHDB (Agriculture and Horticulture Development Board) recommended list. However, to be successful they require high protein content and good resistance to the most common diseases such as fusarium, septoria, mildew and rust. Additionally, they must have high first and second crop yields in various areas of the UK and most importantly show excellent breadmaking quality during their commercial trials.
Figure 1.5 2014 UK wheat crop by end-use category. Group 1 & 2 indicate breadmaking wheat with Group 1 being consistent for milling and baking performance. Group 2 have breadmaking potential but have shown some performance variability. Group 3 is for soft varieties for biscuits and cakes. Group 4 wheat varieties are both hard and soft wheats used mainly for animal feed.
Consequently significant research has been carried out on the various components that determine breadmaking quality. However, breadmaking quality is a complex trait determined by a number of factors, most notably end use parameters such as dough strength and consistency, loaf volume and bread crumb structure.
14 | P a g e
With such large volumes of bread being produced and consumed in the UK on a daily basis, improvements in bread quality can have significant impacts on human health. Analysis of the UK Government’s National Diet and Nutrition Survey (NDNS) in 2012 suggested that bread contributes to over 10 % of the adult daily intake of protein, thiamine, niacin, folate, iron, zinc, copper and magnesium, and around 20% of fibre and calcium intake, and over 25% of manganese intake in adults. Improving the quality of bread, can therefore help target nutritional deficiencies. As a major staple in our diets, small changes in bread quality could make large differences to the health of the general population.
However, bread consumption has been steadily falling over the last few decades with current average consumption being around 2-3 slices of bread a day. Apart from changes in public demand, there has been an increasing misconception about bread by the general public. This is seen very frequently in the UK where mass produced bread through the Chorleywood breadmaking process has become prevalent since the 1960s. Misconceptions include statements such as “mass produced bread is nutritionally different to home baked or artisan bread”, “bread is fattening” and “white bread is bad for health” (FabFlour UK). The increase in public demand for healthier food is reflected on some of these statements. Since 1974 the consumption of white bread has dropped by 75% while the consumption of brown and wholemeal bread has risen by 85% (DEFRA/ONS). Factory produced bread in particular has received a lot of criticism for its ‘bland flavour’ and ‘poor texture’, however more criticism has been levied on the additional components used in the breadmaking industry, such as surfactants and enzymes (The Independent, 2006).
1.5 Breadmaking and Quality
As stated by Cauvain in his introductory chapter in the book “Breadmaking,” quality is a difficult trait to pinpoint, simply due to the fact that quality is a very personal term. It can mean different things for each individual, changed by perceptions as much as our own sense of taste (Cauvain & Young, 2012). Furthermore, with changing times and public perceptions, there have also been changes in the
definition of quality, with different traits for each type of bread. For example, loaf volume is certainly not relevant for Middle Eastern flat breads, while the yellow pigmentation in durum wheat flour which is highly desirable in pasta products is undesirable in our standard white loaves.
15 | P a g e
1.5.1 Historical perceptions of bread quality in the West
Over history public perceptions have also affected our views of quality. For generations, white bread was the highly desired form of bread. Pure white loaves were first made possible by the improvements made in milling technology which brought about the fractionation of wheat grains. This originated from what was known as the French Process, where repeated milling and sifting allowed finer white flour to be produced than ever before. This concept was taken further by Austrian and Hungarian millers who created the mouture en infini (milling to infinity), a complex process involving more than 80 intermediate product streams that were manually conveyed between operations by scores of men. This process would yield over 10 products of various qualities with the finest being a flour whiter than was ever seen previously. Such efforts were driven by public demand at the time when white bread was a symbol of purity and hygiene for the wealthy upper and rising middle classes of European cities during the industrial revolution. Wholemeal bread or even bread made from old varieties was shunned by the upper classes and became commonly known as the bread of the poor. The Victorian phrase, “even beggars refuse rye bread’ was born from this type of public perception.
This demand did not die out, and when white bread became more available in the 1880s and 1900s, demand for industrial white bread exploded. In the book by Aaron Bobrow-Strain, “White Bread: A social history of the store –bought loaf” he claims that industrial bread was a “perfectly shaped, perfectly clean, perfectly white spectacle of modern progress in an age where widespread anxiety about germs, gender roles and immigrants were rife.”
The dominance of factory produced white bread continued. In the US, synthetic enrichment
campaigns, fortifying the nutritionally deficient white breads with vitamins and minerals, championed industrial white loaves for reasons of national security, which gave industrial white bread another added appeal during World War 2. This nationalist pride associated with white bread contributed to the anti-communist movement and witch-hunting of the Red Scare in the early years of the cold war, giving factory produced white bread added appeal.
However, by the 1970s anti-war activists and ecologists started to campaign against white industrial bread as a “plastic” bread that was a “lethal symbol of militaristic hubris and cultural conformity” (Bobrow-Strain, 2012). From this period, public opinions slowly started shifting around the western world. The nutritional value of wholemeal and brown bread became more recognized. In the US, the rise of new elite niche market breads, along with the publicised nutritional deficiencies of the
industrial white bread were significant factors on the decline of white bread in the 21st century. In the US, white industrial loaves gained another racial association, becoming associated with the infamous ‘white trash icon.’ In 2011 for the first time in US history wholemeal bread outsold white bread.
16 | P a g e
This demand for better quality bread has continued along with an increasing negative perception of industrially produced bread products. Rising claims of gluten intolerance, misconceptions on
industrial additives, criticism on white bread’s poor bland flavour and texture has resulted in increased demand for wholemeal as well as bread made from ancient or alternative cereals such as einkorn, spelt and rye. With such changes in public perception and demand, there is an ever increasing challenge on industry to improve breadmaking quality.
In this thesis, quality may be somewhat more simply defined. For the breadmaking industry, quality is a ‘fitness for purpose’ which equates to ‘a product you can make consistently that will always bring back customers.’ For industry, there are various quantifiable, measurable quality traits, such as loaf volume, height and gas cell number.
For the breadmaking process it is ultimately most important to be able to measure wheat quality and to predict the likely breadmaking performance (Cauvain and Young, 2009). While developing tools and decades of research have brought large improvements, that goal is yet to be achieved.
1.5.2 Breadmaking: an overview
The main components of industrial breadmaking are the same as bread baking done on a small scale at home, being a mix of flour, yeast, salt and water. The flour is hydrated, mixed with the other
ingredients which bring the gluten proteins together to form a network. The aeration of the dough is initiated during mixing as the gluten network traps and retains air bubbles. The rheology of the dough is a crucial factor in controlling the initial development of the aerated structure. Overly strong dough will inhibit bubble expansion, while weak doughs will result in a collapse of the dough structure. During the proving stage the dough is incubated at a warm temperature which allows the yeast to ferment sugars and release carbon dioxide. The CO2 enters the air bubbles to form gas cells within the dough structure which expand throughout the dough. After proving, the dough is baked, usually around 230˚C (450 F gas mark 8), which denatures the gluten protein and gelatinizes the starch to form a solid matrix with the aerated crumb structure commonly associated with all forms of leavened bread.
1.5.3 CBP (Chorleywood Breadmaking Process)
The CBP was developed in 1961 by the British Baking Industries Research Association based at Chorleywood and is used to make most of the bread consumed in the UK (80% in 2009). Before the development of the CBP process, the bulk fermentation process (BFP) was commonly used in
17 | P a g e
industry. BFP is a traditional method, where ingredients are mixed together to form a dough and left to ferment for up to three hours. During fermentation the dough changes from a short dense mass into elastic dough.
Compared to bulk fermentation, CBP was able to produce bread within a shorter time, using wheat with lower protein content, which allowed greater use of home grown wheats. The CBP can produce the final sliced and packaged form of bread from flour in approximately three hours and a half. This was possible through the significant reduction in fermentation time, which was decreased from over three hours to less than one. This is achieved through the addition of ascorbic acid (Vitamin C), emulsifiers, yeast, enzymes and intense mechanical kneading by high speed mixers. The high speed mixing generates a high temperature which is cooled through a cooling jacket. Air pressure in the mixer headspace is controlled in order to produce the desired gas bubble size and number. Typical operating regimes are pressure followed by vacuum and atmospheric followed by vacuum. This pressure control during the mixing process is crucial as it affects the crumb texture in the final loaf. The dough is divided in to individual pieces and left to proof for around 5-8 minutes, which is the intermediate proofing stage. Each dough piece is then moulded into tins and moved to a temperature and humidity controlled proofing chamber where it sits for 40-50 minutes, which is the second proofing stage. At this point the dough is baked for around 17-25 minutes at 230˚C, de-panned and then placed in a cooler for around 2 hours. This is the final loaf which can be sliced and packaged as required.
18 | P a g e
Figure 1.6 Diagram displaying the different steps involved in the Chorleywood breadmaking process.
CBP is not exclusive to the UK; it is used for over 80% of the factory produced bread in Australia, New Zealand and India. Contrary to public belief, CBP is not exclusive to white bread or industrial bread. Many smaller bakers also use the CBP process to mix their dough which they later process by hand. Many speciality, crusty and organic loaves are also actually produced through the CBP process. Another breadmaking method mentioned in this study is the spiral white breadmaking procedure. Spiral white is the name for a common breadmaking process using a spiral mixer and white flour. Spiral mixers gently mix bread dough to allow it to develop the proper gluten structure without overworking the dough. This is achieved through the bowl which rotates as the spiral hook is spinning and kneading the dough. The spiral hook makes it so only a portion of the whole dough mass is
kneaded at any given point in time, which keeps friction heat low, providing a more homogenous mix.
1.5.4 Importance of various stages of breadmaking on final loaf quality
Each stage of the breadmaking process can have a significant impact on breadmaking quality. With the amount of mechanical mixing affecting the strength of the gluten matrix, it has even been claimed