Clemson University Clemson University
TigerPrints
TigerPrints
All Dissertations Dissertations
8-2019
Effect of Microstructure on Corrosion of Structural and Advanced
Effect of Microstructure on Corrosion of Structural and Advanced
Alloys
Alloys
Seyedhamidreza Torbatisarraf Clemson University
Follow this and additional works at: https://tigerprints.clemson.edu/all_dissertations
Recommended Citation Recommended Citation
Torbatisarraf, Seyedhamidreza, "Effect of Microstructure on Corrosion of Structural and Advanced Alloys" (2019). All Dissertations. 2652.
https://tigerprints.clemson.edu/all_dissertations/2652
EFFECT OF MICROSTRUCTURE ON CORROSION OF
STRUCTURAL AND ADVANCED ALLOYS
A Dissertation Presented to the Graduate School of
Clemson University
In Partial Fulfillment
of the Requirements for the Degree Doctor of Philosophy Civil Engineering by Seyedhamidreza Torbatisarraf August 2019 Accepted by:
Prof. Amir Poursaee, Committee Chair Prof. Prasad Rangaraju
Prof. Marian S. Kennedy
ABSTRACT
Corrosion science combines the ability to characterize the composition and structure in atomic scale with the experimental and/or computational modeling to enable technological solutions and service life predictions. However, lack of observations restricts the simulation and service life estimations for all alloys. This dissertation work aims to provide literature, observations and discussion on the influence of microstructure on corrosion of both structural (carbon steel) and advanced alloys (ZK60, a Mg based alloy, and AA6061, a Al based alloy) in range of saline solutions. The solutions were chosen to simulate actual envinment of alloys application.
Based on the relevant research area in department of civil enginieering on degradation of cementitious material and embded steel in concrete, the main focus was the corrosion and passivation of reinforcing carbon steel bars in alkaline solution simulating concrete environment. Scanning electrochemical microscopy was exploited to characterize the kinetics of formation of a passive film and the electrochemical activity of the carbon steel in simulated concrete pore solution. The effect of coupling this carbon steel was also studied and probability of galvanic corrosion was examined. The microstructure and distrobutiona of ferrite and pearlite in the carbon steel was altered, using different heat-treatment procedures, and then the susceptibility to corrosion and chloride threshold values of these steels were evaluated. Post corrosion and electrochemical data revealed that restricting and refining pearlite phase improved corrosion performance of regular reinforcing steel bars in chloride contaminated concrete environment. In addition, the surface microstructure of steel was refined through surface
mechanical attrition, i.e. sand blasting. It was found that the dissolution rate of the refined surface was highly dependent on the pH of the environment. Grain refinement provided high defective and energetic zones which preferentially oxidized. Consequently, depending on the environment, the corrosion resistance was improved or exacerbated if the formed oxide component was protective or defective, respectively.
Furthermore, the influence of manufacturing process, and subsequently the microstructure on the corrosion activity of two different alloys, i.e. ZK60 (Mg based alloy) and AA6061 (Al based alloy) were also investigated. Results indicated that uniform microstructure reduced corrosion rate due to formation of integrated and uniform protective oxide film and decreasing galvanic corrosion along the surface.
DEDICATION
To my parents and my brother for their unconditional love.
ACKNOWLEDGMENTS
Technical guidance came from many people during my Ph.D. program. First, I wish to sincerely thank to my advisor, Dr. Amir Poursaee, for his excellent support, invaluable scientific feedback and insights, and constructive guidance. In addition, I would also like to thank my committee members, Dr. Marian Kennedy, Dr. Prasad Rangaraju and Dr. Brandon Ross, for their time to review my work and their critiques that helped improved my research results. Finally, I need to also express my deepest gratitude for collaboration with Professor Terence G. Langdon and my brother Dr. Alireza Torbatisarraf from University of Southern California.
In addition to faculty, I need to highlight support from staff and colleagues. Danny Metz, a staff member at the Clemson Glenn Department of Civil Engineering, provided technical technical support in my experimental research. In addition, I need to thank my my friends, Ling Ding, Mitra Shabani, Iman Khakpour, Saeid Kieh and Younes Moghanlou who were always kind and helped me during my program.
The major part of this dissertation was based upon work supported by the National Science Foundation (NSF) under Grant No. 1552794, entitled: EAGER: Corrosion Reduction in Reinforcing Steel of Concrete Structures through Grain Size Alteration. I would like to acknowledge mentioned foundation and all corresponded committee who supported us financially.
TABLE OF CONTENTS Page TITLE PAGE ... i ABSTRACT ... ii DEDICATION ... iv ACKNOWLEDGMENTS ... v LIST OF TABLES ... ix LIST OF FIGURES ... x CHAPTERS 1 Introduction ... 15
Hierarchy of corrosion challenges ... 17
Objectives and organization of the dissertation ... 20
References ... 21
2 Study of the passivation of carbon steel in simulated concrete pore solution using a scanning electrochemical microscope ... 24
Introduction ... 24
Materials and experimental procedures ... 26
Materials ... 26
SECM preparation ... 27
Electron transfer rate calculation ... ... 27
Results and discussion ... 31
Conclusion ... 34
3 Corrosion improvement of carbon steel in concrete environment through modification of the steel microstructure ... 41
Introduction ... 41
Steel microstructure, heat treatment and grain size refinement ... 42
Specimen preparation ... 44
Electrochemical tests ... 45
Results and discussions ... 47
Conclusions ... 53
References ... 54
4 Corrosion of coupled steels with different microstructures in concrete environment 59 Introduction ... 59
Materials and experimental procedures ... 60
Result and discussion ... 63
Conclusions ... 76
References ... 77
5 Study of effect of phase distribution of reinforcement steel microstructure against chloride ion depassivation in concrete pore solution ... 81
Introduction ... 81
Materials and experimental procedures ... 82
Result and Discussion ... 85
Conclusions ... 95
References ... 96
6 The influence of the sandblasting as a surface mechanical attrition treatment on the electrochemical behavior of carbon steel in different pH solutions... 105
Introduction ... 105
Materials and experimental ... 107
Steel specimens ... 107
Experimental procedures ... 108
Results and discussion ... 111
References ... 126
7 Electrochemical spectroscopic analyses of the influence of the surface nano-crystallization on the passivation of a carbon steel in high pH solution ... 134
Introduction ... 134 Page
Results ... 139
Discussion ... 153
Conclusions ... 155
References ... 156
8 Electrochemical behavior of a magnesium ZK60 alloy processed by high-pressure torsion ... 168
Introduction ... 168
Experimental Procedures and Materials ... 170
Materials ... 170
HPT Processing ... 171
Electron back-scatter diffraction sample preparation ... 171
Electrochemical Testing ... 172
Experimental Results ... 174
Effect of HPT Processing on Microstructural and Textural Evolution ... 174
Electrochemical Testing of HPT-Processed Materials ... 177
Hydrogen Evolution Testing of HPT-Processed Materials ... 189
Post-Exposure Microstructural Observations ... 190
Discussion ... 198
Summary and Conclusions ... 201
References ... 203
9 A comparative study of corrosion behavior of the AA6061-T6 bars, manufactured by the conventional extrusion and selective laser melting additive manufacturing in 0.5 M NaCl solution ... 215
Introduction ... 215
Experimental procedures ... 216
Result and discussion ... 218
Conclusion ... 226
References ... 227
10 Overall conclusions ... ... 226
Page
LIST OF TABLES
Table Page
Table 2-1. Chemical composition of the material used in other literatures and this study. ...26
Table 3-1. The composition of the simulated concrete pore solution. ...46
Table 3-2. Grain size distribution and free ferrite portion of as-received and heat-treated steel rebar. ...48
Table 4-1. The main alloying elements in the steel specimens used in this study...61
Table 4-2. The chemical composition of the concrete simulated pore solution. ...62
Table 5-1. The chemical composition of the concrete simulated pore solution. ...84
Table 5-2. Proeutectoid ferrite ferrite portion of as-received and heat-treated steel rebar. ...88
Table 6-1. The chemical composition of the steel specimens ...107
Table 6-2. The measured mean grain size of the bulk, roughness, and thickness of the affected area. ... 113
Table 6-3. Values of the elements of the equivalent circuit to fit the impedance spectra of Figure 6-10. ...123
Table 7-1. Treatment conditions and average grain size of various samples. ...142
Table 7-2 Values of the equivalent circuit elements for the reference, SB10 and SB30 samples passivated under OCP. ...146
Table 7-3. Calculated parameters of Eq. (6) and Eq. (7) to obtain the diffusion of point defects in the passive film formed on the reference and sandblasted samples in the alkaline solution...153
Table 8-1. Graphically obtained value of EIS. ...184
Table 8-2. EDS results of corresponding areas in Figure 8-13 ...198
LIST OF FIGURES
Figure
Page
Figure 1-1. Economic impact of corrosion compared to direct medical costs and health issues in the U.S.
[3]. Reprinted without permission. ...16
Figure 1-2. Impact of corrosion on aspect of society. In many of these areas [5]. Reprinted without permission. ...17
Figure 1-3. The wide span of different length scales of material, the processes, and the models needed to correctly predict corrosion degradation [1]. Reprinted without permission...19
Figure 2-1. The anodic peaks of 0.5 mm potassium ferrocyanide obtained from 25μm ume in simulated concrete pore solution as a function of the square root of the scan rate...31
Figure 2-2. Experimental z-approach feedback curves recorded for carbon steel specimen at different periods of exposure in simulated concrete pore solution with 0.5 mM Potassium Ferrocyanide ...32
Figure 2-3. Open circuit potential and calculated keff versus time (obtained from fitting curves in Figure 2). ...33
Figure 3-1. Optical microscopic images of the specimens. ...48
Figure 3-2. (a) corrosion potential values and (b) corrosion current densities of the specimens. ...49
Figure 3-3. The calculated average mass loss for the specimens during the entire time of exposure. ...49
Figure 3-4. Cyclic polarization plots from three different microstructures, immersed 42 days in Chloride-contaminated pore solution with 3 wt.% NaCl. ...50
Figure 3-5. Cyclic voltammogram curves from three different microstructures obtained in chloride-contaminated pore solution. ...51
Figure 3-6. The average grain size distribution in different specimens. ...52
Figure 4-1. Schematic illustration of the measurement cells with (a) three specimens made with Steel A bars; (b) three specimens made with Steel B bars; and (c) coupled bars. ...62
Figure 4-2. Images of Steel A: (a) photograph of the cross-section, (b) microstructure of the tempered martensite phase (region 1), (c) microstructure of the bainite-ferrite phase – transition zone (region 2), and (d) ferrite-pearlite phases (region 3)...64
Figure 4-3. Images of Steel B: (a) photograph of the cross-section, and (b) its microstructure (ferrite-pearlite phases). ...65
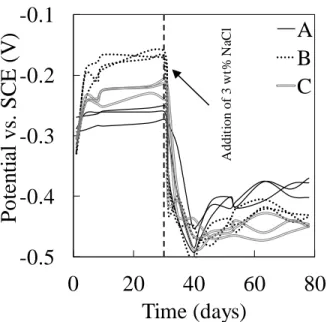
Figure 4-4. Images corrosion potential values of the specimens. Dash line represents the time of addition of the nacl. ...66
Figure 4-5. Corrosion current density values; salt added at 30th day of immersion. Dash line represents the time of addition of the NaCl. ...67
Figure 4-6. Galvanic current vs. Time, obtained from the zra test on coupled specimens in cell m, salt added at 30th day of immersion. Dash line represents the time of addition of the nacl. ...68
Figure 4-7. Polarization diagrams of Steel A and Steel B in after 30 days exposure to chloride-free pore solution. ...69
Figure 4-8. Results of the cyclic polarization tests conducted on one of the specimens in each cell, 21 days after addition of the NaCl to the pore solution. ...71
Figure 4-9. Results of the CP test, 21 days after addition of the NaCl to the pore solution (a) disconnected Steel A and Steel B in the individual cell, (b) disconnected Steel A and Steel B in the individual cell,
and (c) disconnected Steel A, disconnected Steel B, and coupled Steels. ...72
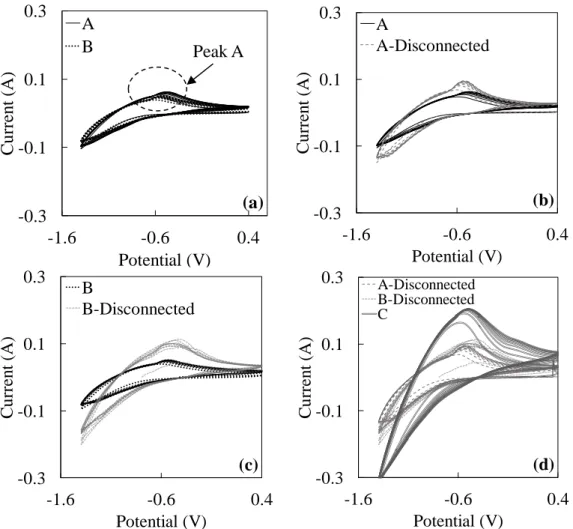
Figure 4-10. CV data from 21st day of adding salt in pore solution from different steel specimens (a) Steel A and Steel B in individual cells (b) Steel a in individual cell and disconcerted Steel A in a coupled cell (c) Steel B in individual cell and disconcerted Steel B in a coupled cell (d) disconnected with coupled specimens. ...73
Figure 4-11. The calculated average mass loss for the specimens during the entire time of exposure. ...74
Figure 4-12. Optical micrograph of corroded surfaces of one of the specimens of (a) Steel A in the individual cell, (b) Steel A in the coupled cell, (c) SEM image of Steel A in the individual, and (d) SEM image from a pit on the surface of Steel A in the coupled cell...75
Figure 4-13. Optical micrograph of corroded surfaces of one of the specimens of (a) Steel B in individual cell, (b) Steel B in coupled cell, (c) SEM image of Steel B in the individual cell, and (d) SEM image from a pit on surface of Steel B in the coupled cell. ...76
Figure 5-1. Heat treatment routes used in the study...83
Figure 5-2. Three-dimensional optical micrograph of examined steel bar. (a) N, (b) C and (c) N series. ...86
Figure 5-3. SEM micrographs of examined steel bar in different magnifications. (a) N, (b) C and (c) R series. ...88
Figure 5-4. Cyclic voltammograms of reference and heat-treated specimens immersed n pore solution for 3 days. ...89
Figure 5-5. (a)Nyquist, (b) bode and (c) bode phase plots of eis results of obtained after one day polarization of specimens at 0.2 V vs SCE in chloride free pore solution. ...91
Figure 5-6. Resultant current density of steel with different microstructures immersed in pore solution and polarized at +0.2 V vs. SCE with respect to chloride concertation. ...92
Figure 5-7. SEM micrographs of the specimens after corrosion initiation. Corrosion products were removed, and specimens were slightly polished and etched. (a) N, (b) C and (c) R series. ...94
Figure 5-8. Schematic on mechanism of pitting growth on passivated reinforcement steel in pore solution (a) N series, (b) C series and (c) R series. ...95
Figure 6-1. An epoxy coated steel specimen. ...108
Figure 6-2. Microscopic images of the surfaces of the sandblasted specimens. ... 112
Figure 6-3. Microscopic images of the cross-section of the sandblasted specimens. ... 112
Figure 6-4. SECM currents obtained from the line scan, and (b) micro-hardness values from the cross-section of the specimens. ... 114
Figure 6-5. Distance from the surface when the current stabilized in the secm experiment... 115
Figure 6-6. Corrosion potential of values all specimens versus time of exposure. Vertical dashed lines represent the date of the addition of chlorides. ... 116
Figure 6-7. Corrosion current densities of all specimen versus time of exposure. The vertical dashed line represents the date of the addition of chlorides.. ... 117
Figure 6-8. Percentage of mass loss of the sandblasted specimens compared to the as-received specimens in different solutions during immersion. ... 119
Figure 6-9. Cyclic polarization curves of one of the specimens in each measurement cell 56 days after exposure to the chloride-contaminated solutions. ...120
Figure 6-10. Nyquist plots for one of the specimens in each measurement cell 8 weeks after exposure to the chloride-contaminated solutions. ...121 Figure 6-11. Electrochemical equivalent circuits used to fit the eis data in this work. ...122 Figure 7-1. Epoxy coated steel sample. ...138 Figure 7-2. Microscopic images of the cross-section of the (a) 10 min. and (b) 30 min. sandblasted samples.
The area above the dashed line indicated the deformed area. ...140 Figure 7-3. Scanning electron microscopy images of the surface of (a) 10 min. and (b) 30 min. sandblasted
samples. ...141 Figure 7-4. XRD patterns of the samples before and after sandblasting. ...142 Figure 7-5. OCP values from three sample measurement of reference and sandblasted condition after 72 h
immersion in pore solution. ...143 Figure 7-6. (a) nyquist, (b) bode and (c) bode phase plots of the steel samples after 72 h immersion in the
solution at their ocp. ...144 Figure 7-7. Physical interpretation of the impedance response of the surface of the carbon steel immersed in high alkaline solution at it ocp. ...145 Figure 7-8. (a) complex-capacitance diagrams obtained from EIS results shown in Figure 6 at high
frequencies, (b) magnified rectangle region in (a). ...148 Figure 7-9. Physical interpretation of carbon steel interface immersed in high alkaline solution in the
passivating potential field. ...151
Figure 7-10. (a) donor and (b) current density (iss) of the passive films formed on all reference and
sandblasted carbon steel in the alkaline solution as a function of anodic polarization potential. Error bars show the max and min values from three measurements for each sample. ...152 Figure 7-11. Evaluation of integrated fe passive film in alkaline solution through grain refinement. ...155 Figure 8-1. Grain size distributions and ebsd orientation micrographs taken from the mid-radius of the rd-td planes of the extruded material and samples processed by one and five turns of hpt. The color coded triangle is reprsentative of the crystalograpic orentation of corresponding colors in the ebsd orentation micrographs. ...176 Figure 8-2.The pole figures of {0001} crystallographic orientation from the mid-radius of the rd-td planes
of the extruded, and hpt processed samples with one and five turns at 298 K. ...177 Figure 8-3.The polarization curves of the ZK60 samples in 0.1 M NaCl solution, processed by extrusion
and various numbers of hpt turns. ...178 Figure 8-4. Nyquist plots of one of the ZK60 Mg samples in 0.1 M NaCl solution, processed by extrusion
and various numbers of turns by HPT. ...181 Figure 8-5. Equivalent circuit constructed based on the interface reactions observed in the eis spectrum for
the extruded and the HPT processed ZK60 samples in 0.1 M NaCl. ...182 Figure 8-6. Cole-cole plots corresponding to eis data at high frequencies presented in Figure 8-4. ...184 Figure 8-7. The Mott–Schottky plots for the ZK60 samples processed by extrusion and various numbers of
turns by HPT, immersed in 0.1 M NaCl for 4 h. ...188 Figure 8-8. Donor density of the ZK60 Mg alloy processed by extrusion and various numbers of turns by
hpt, immersed in 0.1 M NaCl for 4 h. In x axis, the 0 number of HPT turns represents the original extruded material with no HPT process. ...188
NaCl solution for 24 h. ...189 Figure 8-10. Cumulative the optical images of the corroded surfaces of the extruded as well as HPT
proceeded ZK60 samples at different immersion time (the diameter of each disk is ~10 mm). ...191 Figure 8-11. The micrographs from slice of the 4 h corroded surface of disks shown in Figure 10 for (a)
extruded and processed by (b) 1, (c) 2, (d) 5, (e) 10 and (f) 20 turns of HPT. ...193 Figure 8-12. The micrographs of the corroded surfaces of ZK60 Mg alloy samples at exposed in 0.1 M
NaCl for 4 h for (a) extruded and processed by (b) 1, (c) 2, (d) 5, (e) 10 and (f) 20 turns of HPT. ....194
Figure 8-13. SEM of surface morphologies of the ZK60 disks after 24 h immersion in 0.1 M NaCl solution for samples of (a) extruded with point a for eds analysis and processed by (b) one turn of hpt with point b for eds analysis, (c) two turns of hpt with point, (d) five turns of hpt, (e) 10 turns of HPT and (f) 20 turns of hpt with point c for EDS analysis. The corresponding eds results of point a, b and c are compared in Table 8-2. ...197 Figure 9-1. Presentation of extruded and additive manufactured AA6061 materials used in this study. ...217 Figure 9-2. Schematic illustration of one of the samples for the electrochemical test. ...218 Figure 9-3. Optical micrograph from microstructure of (a) AM and (b) ex AA6061 in different
magnifications...219 Figure 9-4. Evaluation of polarization resistances, Rp, with respect to the immersion time for EX and AM
AA6061 samples. ...220 Figure 9-5.EIS results of one of (a) AM and (b) EX samples at different immersion times in 0.5 M NaCl
solution. ...222 Figure 9-6. Schematic repristinating of equivalent circuit for corrosion mechanism of AA6061 in 0.5 M
NaCl. ...223 Figure 9-7. Scanning electrical micrographs of pits in the (a-1) AM and (b-1) EX samples and the
morphology of the surface of the (a-2) AM and (b-2) EX samples after 9 days immersion at the OCP in 0.5 M NaCl solution. ...226
CHAPTER 1
1
INTRODUCTION
Corrosion is a complex and broad subject that is defined as “environmentally induced degradation of a material that involves a chemical reactions” [1]. Published literature currently encompasses a wide spectrum of environments, temperature, metals, alloys, composites and ceramics [2–4]. However, as the complexity and diversity of materials systems continues to increase, there is a need for additional research and sharing data[5].
Premature material degradation due to corrosion in industrialized economies costs approximately 3% of their gross domestic product (GDP) [6]. Figure 1-1, as an example, shows a comparison of the corrosion costs the healthcare direct costs and the costs due to weather and climate disasters [7]. While healthcare and weather disasters are well recognized as major societal challenges and frequently appear in the media, the tremendous economic impact by corrosion receives little attention. In addition, the continuous aging of infrastructures, will exacerbate this situation in the upcoming years. For instance, the age profile of reinforced concrete infrastructures in U.S. shows a peak in construction activities around 1960–1980. Thus, most of the bridges have are 40 or more years old and they were designed for a service life of 50 years. Consequently, in the upcoming decades corrosion costs will be steeply increased resulting from number of bridges beyond their designed life [8].
Figure 1-1. Economic impact of corrosion compared to direct medical costs and health issues in the U.S.
[7]. Reprinted without permission.
However, the real cost of corrosion is even more pervasive for society. National Research Council (NRC) report described less measurable impacts on corrosion such as loss of readiness, that is, the ability of a system to respond to emergencies or situations involving national security [9]. For example, while the costs of replacing deteriorating bridges, as an infrastructure, can be estimated, but the impacts of corrosion on national productivity and security due to failures and traffic congestion during repairs is not well-estimated.
The influence of corrosion on environment, public health, and global sustainability cannot be quantified simply in terms GDP [1]. Figure 1-2 shows the NRC
assessment of the impact of corrosion on many aspects of society. Some examples, leaching of corrosion products and seeping of contaminant due to dissolution of metals or leakage of reservoir into the environment, deterioration of medical devices and implants due to interactions with human body environment, and the weakening of the nation’s energy and transportation infrastructures.
Figure 1-2. Impact of corrosion on aspect of society. In many of these areas [9]. Reprinted without
permission.
Hierarchy of corrosion challenges
Materials design for corrosion resistance relies on knowledge and improvements of well-stablishd compositions and structures. Furthermore, progress in atomic scale science and the ability to synthesize and control precise atomic structures, create new opportunities and challenges for corrosion scientists. The most effective way to reduce
corrosion is to find underlying corrosion mechanisms. For example, passivation and depassivation due to pH changes or ingress of chloride ion [10–12], formation of mirco [13] or macro galvanic cell [14]. This alone would justify increased attention to the science base of corrosion research. While some forms of corrosion are well understood at the macro level, complex interactions among the different forms are yet needed to be fully investigated. There is relatively poor understanding on corrosion mechanisms, at the micro/nano level. Lack of fundamental knowledge in this field of study is directly reflected in the high cost of corrosion.
NRC report prioritized the future challenges for corrosion science as being [1]: I: “Development of cost-effective, environment-friendly, corrosion resistant materials or coatings”;
II: “High-fidelity modeling for the prediction of corrosion degradation in actual service environments”;
III: “Accelerated corrosion testing under controlled laboratory conditions that quantitatively correlates with the long-term behavior observed in service environments”; and
IV: “Accurate forecasting of remaining service time until major repair, replacement, or overhaul becomes necessary”.
These hierarchies are deemed to be the drivers and guiding principles of the framework for prioritizing efforts in corrosion science in decades to come. To address these challenges, the mechanism of corrosion, and the detailed influence of the
metal/alloy microstructure on corrosion should be understand and defined. Corrosion science is an interdisciplinary field of study including different aspects of physics, materials science, surface science, electrochemistry and fracture mechanics. As shown on Figure 1-3, many corrosion processes are now known to be controlled by molecular, sub micrometer, and micrometer-scale phenomena.
Figure 1-3. The wide span of different length scales of material, the processes, and the models needed to correctly predict corrosion degradation [1]. Reprinted without permission.
networks of boundaries and arrays of defects behave under corrosive conditions [1]. Nonetheless, there is a lack of micrometric-scale understanding of the role of various specific chemical species, phases, defects, grain boundaries, etc. in the initiation and propagation of corrosion processes.
Objectives and Organization of the Dissertation
The main objective of all experiements carried out in this disseration to investigate the influence of microstructure on the corrosion activity of alloys. The focus, however, was the corrosion and passivation of reinforcement carbon steel in alkaline solution to simulate concrete environment. In Chapter 2, a criterion for passivation time of steel in simulated concrete pore solution were determined using a novel micro electrochemical technique. This technique provides a novel practical method to study corrosion and related electrochemical phenomena in micro-scale and leads further investigations in future. In Chapter 3, microstructures were changed through heat treatment, and surface nanocrystalization and the consequent corrosion performance were studied. Furthermore, the influence of manufacturing process, and subsequently the microstructure on the corrosion activity of three different systems, i.e. thermomechanically treated (TMT) reinforcement steel, ZK60 (Mg based alloy) and AA6061 (Al based alloy) were also investigated. Literature review of each alloy system, details of the experimental procedures and results are provided and discussed in these chapters.
References
[1] D. Duquette, R. Schafrik, A. Asphahani, G. Bierwagen, D. Butt, G. Grankel, R. Newman, L. Schwartz, J. Scully, P. Tortorreli, D. Trejo, D. Untereker, M. U-Macdonald, Research Opportunities in Corrosion Science and Engineering, The National Academies Press, Washington, DC, 2011.
[2] E. McCafferty, Introduction to corrosion science, 2010.
[3] S. Rashidi, J.P. Choi, J.W. Stevenson, A. Pandey, Effect of Aluminizing on the High-Temperature Oxidation Behavior of an Alumina-Forming Austenitic Stainless Steel, JOM. (2018).
[4] A. Keyvani, M. Saremi, M.H. Sohi, An investigation on oxidation, hot corrosion and mechanical properties of plasma-sprayed conventional and nanostructured YSZ coatings, Surf. Coatings Technol. 206 (2011) 208–216.
[5] X. Li, D. Zhang, Z. Liu, C. Du, C. Dong, Share corrosion data, (2015) 6–7.
[6] H.K. Gerhardus, M.P.H. Brongers, N.G. Thompson, Y.P. Virmani, J.H. Payer, Corrosion costs and preventive strategies in the United States, 2001.
[7] U.M. Angst, Challenges and opportunities in corrosion of steel in concrete, Mater. Struct. 51 (2018) 1–20.
[8] Corrosion Control Plan for Bridges, Houston, 2012.
[9] N.R. Council, Assessment of Corrosion education, The National Academies Press, 2009.
[10] H. Torbati-Sarraf, A. Poursaee, Study of the Passivation of Carbon Steel in Simulated Concrete Pore Solution Using Scanning Electrochemical Microscope (SECM), Materialia. (2018).
[11] L. Ding, H. Torbati-Sarraf, A. Poursaee, The influence of the sandblasting as a surface mechanical attrition treatment on the electrochemical behavior of carbon steel in different pH solutions, Surf. Coatings Technol. 352 (2018) 112–119.
[12] H. Torbati-Sarraf, S.A. Torbati-Sarraf, A. Poursaee, T.G. Langdon, Electrochemical behavior of a magnesium ZK60 alloy processed by high-pressure torsion, Corros. Sci. 154 (2019) 90–100.
[13] D. Ahmadkhaniha, M. Fedel, M. Heydarzadeh Sohi, A. Zarei Hanzaki, F. Deflorian, Corrosion behavior of magnesium and magnesium-hydroxyapatite composite fabricated by friction stir processing in Dulbecco’s phosphate buffered saline, Corros. Sci. 104 (2016) 319–329.
[14] H. Torbati-Sarraf, A. Poursaee, Corrosion of coupled steels with different microstructures in concrete environment, Constr. Build. Mater. 167 (2018) 680–687. [15] A. Poursaee, C.M. Hansson, Reinforcing steel passivation in mortar and pore solution, Cem. Concr. Res. 37 (2007) 1127–1133.
[16] D.D. Macdonald, M. Urquidi-Macdonald, Theory of Steady-State Passive Films, J. Electrochem. Soc. 137 (1990) 2395–2402.
[17] Y. Li, Y.F. Cheng, Passive film growth on carbon steel and its nanoscale features at various passivating potentials, Appl. Surf. Sci. 396 (2017) 144–153.
Met. Semicond. Prop. Thin Oxide Layers. 579 (2006) 311–316..
[19] F.R. Foulkes, P. McGrath, Rapid cyclic voltammetric method for studying cement factors affecting the corrosion of reinforced concrete, Cem. Concr. Res. 29 (1999) 873– 883.
[20] Y. Chen, M.E. Orazem, Impedance analysis of ASTM A416 tendon steel corrosion in alkaline simulated pore solutions, 104 (2016) 26–35.
[21] S. Joiret, M. Keddam, X.R. Nóvoa, M.C. Pérez, C. Rangel, H. Takenouti, Use of EIS, ring-disk electrode, EQCM and Raman spectroscopy to study the film of oxides formed on iron in 1 M NaOH, Cem. Concr. Compos. 24 (2002) 7–15.
[22] M.F. Hurley, J.R. Scully, Threshold chloride concentrations of selected corrosion-resistant rebar materials compared to carbon steel, Corrosion. 62 (2006) 892–904.
CHAPTER 2
2
Study of the passivation of carbon steel in simulated concrete pore solution
using a scanning electrochemical microscope
1Introduction
Conventional electrochemical techniques provide valuable information about the passivation and breakdown of the passive layer of the reinforcing steel in concrete environment [1]. However, these are integral methods, and thus, they lack spatial resolution, which is a disadvantage, especially in studying the early stages of the passivation and depassivation processes. In fact, dynamic sequence of corrosion starts at the nano/microscopic level and macroscopic indication of corrosion is only an expression of the final stages of this complex system [2,3]. To fundamentally study this system, it is imperative to conduct the electrochemical tests at the micro-scale [4,5]. The small-scale electrochemical tests also eliminate many issues associated to the electrochemical reactions such as ohmic drop and charging current. In addition, electron transfer and ion transfer can be distinguished using these methods [6–8].
The scanning electrochemical microscopy (SECM) can be used to collect local measurements and is increasingly being used to study corrosion processes. It consists of
1 H. Torbati-Sarraf, A. Poursaee, Study of the Passivation of Carbon Steel in Simulated Concrete Pore
an ultra-micro-electrode (UME) immersed in a synthetic solution, which is scanned in close proximity to the surface of the specimens to characterize the activity or topography of the solid/liquid interface. Therefore, the SECM can be used to quantitatively detect the reactants and products participating in the corrosion reactions and was used in different application such as corrosion inhibitors, localized corrosion studies [9–15]. Nonetheless, to the best of the authors’ knowledge, there is no study on the passivation of carbon steel in concrete environment that utilizes SECM.
The kinetics of the surface reactions that lead to passivation is not well-understood. The aim of this chapter was to investigate the formation of the passive layer on the carbon steel in alkaline environment of concrete as well as to study the kinetics of the passivation process using SECM. Z-approach curves (feedback mode) were recorded at different times over the surface of steel specimen using a potassium ferrocyanide (K3Fe(CN)6) as the redox mediator in a simulated concrete pore solution. The magnitude
of the feedback response depends upon the rate at substrate regenerates the bulk form of the mediator. When the substrate shows high rates of electron transfer, the SECM current will demonstrate a positive feedback response. An overall negative feedback response will result from a slow or hindered reaction that ultimately could be a pure insulator [6,16].
Then, the effective heterogeneous electron transfer rate, keff, was calculated using
the approach curves and Wittstock's method [17]. keff represents the rate of an electron
parameter with respect to time was used to obtain information about kinetics and the strength of the passive layer formed on the surface of steel. However, using macroscopic techniques such as voltammetry and impedance to calculate this parameter is time consuming and ohmic drop and polarization may perturb estimation [16,19–22].
Materials and Experimental Procedures
Materials
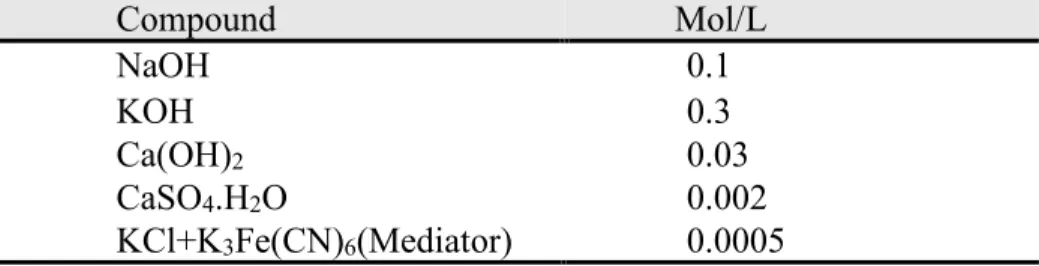
A reinforcing steel bar, No 4 (φ = ~13 mm), with the chemical composition of 0.39wt.% C, 1.3wt.% Mn, 0.15wt.% Si, 0.03wt.% P and 0.011wt.% S and Fe for balance, was used in this study. A specimen with the length of approximately 10 mm was cut from the bar and mounted with two-part cold epoxy. Then, the exposed surface was abraded continuously to finer grades and then polished with 1 μm alumina powder. A small hole was drilled at the bottom of the mounted specimen and a wire was connected to the specimen for electrical connection. A buffered simulated concrete pore solution with the composition shown in Table 2-1 [23], was used (pH=13.6) in experiments.
Table 2-1. Chemical composition of the material used in other literatures and this study.
Compound Mol/L NaOH 0.1 KOH 0.3 Ca(OH)2 0.03 CaSO4.H2O 0.002 KCl+K3Fe(CN)6(Mediator) 0.0005
SECM preparation
An M370-dc-SECM, was used to conduct this study. The specimen was placed horizontally, facing upward, in the cell. Scanning probe was a 25 μm diameter platinum wire inside a capillary glass (RG~10). Ag/AgCl and platinized platinum were used as reference and counter electrodes, respectively. To collect the Z-approach curves, after assembling all components, the probe was slowly lowered until it slightly touched the specimen surface; then pulled back for 10 μm, allowing free traveling in the x-y plane. This distance was set as the point with Z = 0.
The UME was positioned at Z = +250 µm above the surface of the specimen and the feedback mode was started on that point, immediately after addition of the solution. The approach started with the speed of 1 µm/s and stopped at Z = 0 (~10 µm above the steel surface). The UME tip was polarized to +550 mV vs Ag/AgCl and recorded current, whilst the steel specimen was kept unbiased. In order to ensure of reproducibility of obtained approach curves, the experiment was repeated for three times on different similar specimens and each time all the preparation procedure was duplicated.
Electron transfer rate calculation
At potentials and pH levels normally measured in the concrete, a protective passive layer forms on the surface of the carbon steel that decreases the anodic
dissolution rate to negligible levels [24–26]. The kinetics of the surface reactions that lead to passivation, however, is not well-understood. This information can be obtained by calculating the effective rate coefficient, keff, of the regeneration reaction [15, 17]. keff can
be calculated by fitting the experimentally measured Z-approach curves to the numerical/theoretical curves [16,27–29].
In summary, as the UME approaches to the surface, the current is influenced by the normalized distance value of L (the distance/tip diameter). The dimensionless current
𝐼𝑇(𝐿), which is the current at L distance, for the first-order reactions of the mediator can be calculated using Eq. 1:
𝐼𝑇(𝐿) = 𝐼𝑇𝑖𝑛𝑠(𝐿) + 𝐼𝑆(𝐿, 𝜅)(1 −
𝐼𝑇𝑖𝑛𝑠(𝐿)
𝐼𝑇𝑐𝑜𝑛(𝐿)) (1)
where 𝐼𝑆(𝐿, 𝜅) is the kinetically controlled substrate current, and 𝐼𝑇𝑐𝑜𝑛(𝐿) and 𝐼𝑇𝑖𝑛𝑠(𝐿) represent the tip currents for diffusion-controlled regeneration of a redox mediator and for the insulating substrate, respectively. For RG~10, the 𝐼𝑇𝑐𝑜𝑛(𝐿) and 𝐼𝑇𝑖𝑛𝑠(𝐿) can be written as:
𝐼𝑇𝑖𝑛𝑠(𝐿) = 1
(0.15+1.5358
𝐿 +0.58𝑒
(−1.14𝐿)+ 0.0908𝑒
(𝐿−0.631.017𝐿) (3)
𝐼𝑆(𝐿, 𝜅) can be expressed in terms of L using equation 4:
𝐼𝑠(𝐿, 𝜅) = 0.78377 𝐿(1+1 𝜅𝐿) +[0.68+0.3315𝑒 (−1.0672 𝐿 ) 1+( 11 𝜅𝐿)+7.3 110−40𝐿 (4)
where κ is dimensionless first-order rate constant. The ration 𝐼𝑇𝑖𝑛𝑠(𝐿)
𝐼𝑇𝑐𝑜𝑛(𝐿) can be obtained for different values of L from Eq. 2 and 3. Similarly, 𝐼𝑆(𝐿, 𝜅) can be calculated for different L and κ values using Eq. 4. The, keff can be calculated using Eq. 5:
keff = κ ∗D
r (5)
where r is the radius of the Pt UME, and D is the diffusion coefficient of the mediator in thesolution being tested. The keff is estimated by fitting curves from Eq. 1 to real values,
with more than 93% certainty, using least square method.
To obtain the keff, the value of the diffusion coefficient of potassium ferrocyanide
in simulated pore solution was needed. However, this information was not available; thus, this value was calculated through the Randles-Sevcik equation [30,31] which uses the peak current, ip, obtained from the voltammograms, conducted with different sweep rates
i𝑝 = 0.446𝑛𝐹𝐶𝐴√𝑛𝐹𝜈𝐷
𝑅𝑇 (6)
where, n is the number of electrons involved in the reaction (for Fe(CN)63-+1e
-↔Fe(CN)64- it is 1), F is the Faraday constant, C is the concentration of the electroactive
species (0.5 Mm for potassium ferrocyanide), A is the surface area of the working electrode, T is the temperature (ambient temperature, i.e. 23oC), ν is the sweep rate, R is
the gas constant and D is the diffusion coefficient of species.
Several cyclic voltammetry tests were conducted using the 25 μm UME in the pore solution with 0.5 mM potassium ferrocyanide mediator with the scan rates of 1000, 750, 500, 250, 100, 75, 50 and 20 mV/s. The anodic peaks from each voltammogram were obtained, then the value of D was calculated using the slope of the plot of the peak currents, ip, versus the square root of the scan rate (Figure 2-1). The calculated diffusion
coefficient of the oxidation potassium ferrocyanide in the simulated concrete pore solution was D=8.1×10⁻⁷ cm2.s-1.
Figure 2-1. The anodic peaks of 0.5 mM potassium ferrocyanide obtained from 25μm UME in simulated concrete pore solution as a function of the square root of the scan rate.
Results and Discussion
Figure 2-2 shows series of Z-approach curves at different times after exposure of freshly polished cross-section of reinforcement carbon steel to the simulated concrete pore solution, which was kept at open circuit potential. In high alkalinity, it is well known that Fe(OH)2, FeOOH and FeCO3 forms on the surface that can effectively inactive the
surface of steel [32,33]. Therefore, a negative feedback character was predicted; but obtained curves Figure 2-2 implies that the formation of a passive oxide film on a carbon steel surface is a relatively long process as the initial positive feedback curves fade to negative feedback with the passage of time.
R² = 0.9826 0 0.1 0.2 0.3 0 10 20 30 40
Cu
rren
t (
μA)
ν1/2(√mV/s)Figure 2-2. Experimental Z-approach feedback curves recorded for carbon steel specimen at different periods of exposure in simulated concrete pore solution with 0.5 mM potassium ferrocyanide
Figure 2-3 presents the calculated keff (using Eq. 1 through 5) of the potassium
ferrocyanide regeneration reaction on the surface of steel in concrete pore solution versus the time of exposure. keff is a potential dependent parameter [16], but since each feedback
curve was acquired in less than 3 min, after 50 min. immersion (second obtained approach curve in Figure2) free potential was almost constant during this short period, thus it can be assumed keff value is constant for each measurement.
0 1 2 3 0 1 2 3 4 N o rm al iz ed Cu rre n t (IT /IT ,∞ ) Normalized Distance (L=D/r) 2-5 min 50 min 2 hours 4 hours 6 hours 14 hous 24 hours 47 hours insulator
Figure 2-3. Open circuit potential and calculated keff versus time (obtained from fitting curves in figure 2).
As can be seen, upon exposure to the solution open circuit potential increased and keff value decreased drastically. Such behavior can be explained by a change in the
structure of the oxide film on the surface of carbon steel from a conductor to an insulator. This observation was attributed to the fact that the steel initially was kinetically active and the electron transfer occurred easily between the Fe and the electroactive species, i.e. ions in the pore solution and the mediator. Passive layer forms on the surface of steel in concrete pore solution and ratio of Fe2+ to Fe3+ increases across the entire depth of the
passive layer to the steel substrate [5,27,34–38]. Thus, it was hypothesized that within few minutes after exposure to solution, the steel surface behaves as a pure conductive (first feedback curve in Figure 2-2) and UME continuously accumulated current from the
0.04 0.08 0.12 0.16 0.2 0 0.0025 0.005 0.0075 0 10 20 30 40 50 P o te n tia l ( V v s A g /A g C l)
k
eff(C
m
/S
)
surface of the steel due direct oxidation of iron[32]. By passing time, the passive layer grew and the keff decreased continuously; according to point defect model (PDM)[39,40],
Fe2+→ Fe3+ + e- became the dominant oxidation reaction between the mediator and the
oxide film. Decreasing the keff value was attributed to the decrease in the number of
liberated electrons and at the same time, due to the more outward flux of Fe2+ than the
diffusivity of O2-, the oxygen vacancies produced at the interface of steel and the passive
layer [37]. Ultimately, by passing the time the donor density of oxide layer decreased [41] and the keff values approached to a relatively steady state, meaning the complete growth
and protection by the passive layer.
Conclusion
This work explained the application of the SECM to study the kinetics of the formation of the passive layer on the surface of carbon steel exposed to the simulated concrete pore solution. Z-approach curves at different times after exposure in pore solution were obtained and by fitting them to theoretical curves, the mediator regenerating heterogeneous rate coefficients, keff, was calculated. In addition, the
diffusion coefficient of potassium ferrocyanide in simulated concrete pore solution was calculated. It was shown that the formation of a passivate layer on the surface of steel was a time-dependent process. It is hypothesized that kinetics of growth of passive film, was the reason of the decreasing in the keff value. The keff became steady-state
formation of the passive layer.
References
[1] A. Poursaee, ed., Corrosion of Steel in Concrete Structures, 1st ed., Woodhead Publishing Series in Civil and Structural Engineering, n.d. https://www.elsevier.com/books/corrosion-of-steel-in-concrete-structures/poursaee/978-1-78242-381-2.
[2] E. Völker, C.G. Inchauspe, E.J. Calvo, Scanning electrochemical microscopy measurement of ferrous ion fluxes during localized corrosion of steel, Electrochem. Commun. 8 (2006) 179–183.
[3] A. Poursaee, Application of agent-based paradigm to model corrosion of steel in concrete environment, Corros. Eng. Sci. Technol. 0 (2018) 1–6.
[4] S. Mehrazi, M. Saremi, J. Neshati, A probe into low-temperature stress corrosion cracking of 304L stainless steel by scanning vibrating electrode technique, Corros. Eng. Sci. Technol. 51 (2016) 358–364.
[5] H. Nanjo, M. Fujimura, N.J. Laycock, Z. Xia, I. Ishikawa, J. Onagawa, The surface nanostructure of pure iron after combined electrochemical passivation and thermal annealing treatments, Surf. Sci. 601 (2007) 5180–5186.
[6] R. Feeney, Determination of heterogeneous electron transfer rate constants at microfabricated iridium electrodes, Electrochem. Commun. 1 (1999) 453–458.
nano-hardness of alloy 800 in corroding environments, Appl. Surf. Sci. 270 (2013) 755– 762.
[8] M. Zhao, J. Li, G. He, H. Xie, Y. Fu, An investigation of the effect of a magnetic field on the phosphate conversion coating formed on magnesium alloy, Appl. Surf. Sci. 282 (2013) 499–505.
[9] J. Molina, J. Fernández, F. Cases, Scanning electrochemical microscopy for the analysis and patterning of graphene materials: A review, Synth. Met. 222 (2016) 145– 161.
[10] D. Polcari, P. Dauphin-Ducharme, J. Mauzeroll, Scanning Electrochemical Microscopy: A Comprehensive Review of Experimental Parameters from 1989 to 2015, Chem. Rev. 116 (2016) 13234–13278
[11] A.G. Marques, J. Izquierdo, R.M. Souto, A.M. Simões, SECM imaging of the cut edge corrosion of galvanized steel as a function of pH, Electrochim. Acta. 153 (2015) 238–245.
[12] C. Li, L. Li, C. Wang, Study of the inhibitive effect of mixed self-assembled monolayers on copper with SECM, Electrochim. Acta. 115 (2014) 531–536.
[13] E. Salamifar, M.A. Mehrgardi, M.F. Mousavi, Ion transport and degradation studies of a polyaniline-modified electrode using SECM, Electrochim. Acta. 54 (2009) 4638– 4646.
[14] Y. Yuan, L. Li, C. Wang, Y. Zhu, Study of the effects of hydrogen on the pitting processes of X70 carbon steel with SECM, Electrochem. Commun. 12 (2010) 1804– 1807.
[15] A. Davoodi, J. Pan, C. Leygraf, S. Norgren, Probing of local dissolution of Al-alloys in chloride solutions by AFM and SECM, Appl. Surf. Sci. 252 (2006) 5499–5503. [16] S. Bollo, S. Finger, J.C. Sturm, L.J. Núñez-Vergara, J.A. Squella, Cyclic voltammetry and scanning electrochemical microscopy studies of the heterogeneous electron transfer reaction of some nitrosoaromatic compounds, Electrochim. Acta. 52 (2007) 4892–4898.
[17] S.E. Pust, D. Scharnweber, S. Baunack, G. Wittstock, Electron Transfer Kinetics at Oxide Films on Metallic Biomaterials, J. Electrochem. Soc. 154 (2007) C508.
[18] W.R. Fawcett, The role of the metal and the solvent in simple heterogeneous electron transfer reactions, Electrochim. Acta. 42 (1997) 833–839.
[19] A.M. Bond, T.L.E. Henderson, D.R. Mann, T.F. Mann, W. Thormann, C.G. Zoski, A fast electron transfer rate for the oxidation of ferrocene in acetonitrile or dichloromethane at platinum disk ultramicroelectrodes, Anal. Chem. 60 (1988) 1878– 1882.
[20] A.M. Bond, K.B. Oldham, C.G. Zoski, Theory of electrochemical processes at an inlaid disc microelectrode under steady-state conditions, J. Electroanal. Chem. Interfacial Electrochem. 245 (1988) 71–104.
[21] L. V. Protsailo, W.R. Fawcett, Studies of electron transfer through self-assembled monolayers using impedance spectroscopy, Electrochim. Acta. 45 (2000) 3497–3505. [22] O. Fontaine, C. Lagrost, J. Ghilane, P. Martin, G. Trippé, C. Fave, J.C. Lacroix, P. Hapiot, H.N. Randriamahazaka, Mass transport and heterogeneous electron transfer of a ferrocene derivative in a room-temperature ionic liquid, J. Electroanal. Chem. 632 (2009)
88–96.
[23] A. Poursaee, C.M. Hansson, Reinforcing steel passivation in mortar and pore solution, Cem. Concr. Res. 37 (2007) 1127–1133.
[24] T. Zakroczymski, Kinetics and Mechanism of Passive Film Formation on Iron in 0.05M NaOH, J. Electrochem. Soc. 132 (1985) 2862. doi:10.1149/1.2113684.
[25] M.F. Montemor, A.M.P. Simões, M.G.S. Ferreira, Analytical Characterization of the Passive Film Formed on Steel in Solutions Simulating the Concrete Interstitial Electrolyte, Corrosion. 54 (1998) 347–353.
[26] H. Torbati-Sarraf, A. Poursaee, Corrosion of coupled steels with different microstructures in concrete environment, Constr. Build. Mater. 167 (2018) 680–687. [27] C. Wei, A.J. Bard, M. V. Mirkin, Scanning Electrochemical Microscopy. 31. Application of SECM to the Study of Charge Transfer Processes at the Liquid/Liquid Interface, J. Phys. Chem. 99 (1995) 16033–16042.
[28] P. Sun, Z. Liu, H. Yu, M. V Mirkin, Effect of mechanical stress on the kinetics of heterogeneous electron transfer., Langmuir. 24 (2008) 9941–4.
[29] A. Asserghine, D. Filotás, L. Nagy, G. Nagy, Scanning electrochemical microscopy investigation of the rate of formation of a passivating TiO 2 layer on a Ti G4 dental implant, Electrochem. Commun. 83 (2017) 33–35.
[30] Z.O. Ameur, M.M. Husein, Electrochemical Behavior of Potassium Ferricyanide in Aqueous and (w/o) Microemulsion Systems in the Presence of Dispersed Nickel Nanoparticles, Sep. Sci. Technol. 48 (2013) 681–689.
disc electrodes—what electrode size is required for the Cottrell and Randles-Sevcik equations to apply quantitatively?, J. Solid State Electrochem. 18 (2014) 3251–3257. [32] D.D. MacDonald, B. Roberts, The cyclic voltammetry of carbon steel in concentrated sodium hydroxide solution, Electrochim. Acta. 23 (1978) 781–786. doi:10.1016/0013-4686(78)80039-5.
[33] W. Chen, R.G. Du, C.Q. Ye, Y.F. Zhu, C.J. Lin, Study on the corrosion behavior of reinforcing steel in simulated concrete pore solutions using in situ Raman spectroscopy assisted by electrochemical techniques, Electrochim. Acta. 55 (2010) 5677–5682.
[34] M.A. Climent, C. Gutiérrez, Proof by UV-visible modulated reflectance spectroscopy of the breakdown by carbonation of the passivating layer on iron in alkaline solution, Surf. Sci. 330 (1995) 2–7.
[35] C.G. Zoski, M. V. Mirkin, Steady-state limiting currents at finite conical microelectrodes, Anal. Chem. 74 (2002) 1986–1992.
[36] B. Huet, V. L’Hostis, F. Miserque, H. Idrissi, Electrochemical behavior of mild steel in concrete: Influence of pH and carbonate content of concrete pore solution, Electrochim. Acta. 51 (2005) 172–180.
[37] Z.H. Dong, W. Shi, G.A. Zhang, X.P. Guo, The role of inhibitors on the repassivation of pitting corrosion of carbon steel in synthetic carbonated concrete pore solution, Electrochim. Acta. 56 (2011) 5890–5897.
[38] H.B. Gunay, P. Ghods, O.B. Isgor, G.J.C. Carpenter, X. Wu, Characterization of atomic structure of oxide films on carbon steel in simulated concrete pore solutions using EELS, Appl. Surf. Sci. 274 (2013) 195–202.
[39] D.D. Macdonald, The history of the Point Defect Model for the passive state : A brief review of film growth aspects, Electrochim. Acta. 56 (2011) 1761–1772.
[40] Y. Li, Y.F. Cheng, Applied Surface Science Passive film growth on carbon steel and its nanoscale features at various passivating potentials, Appl. Surf. Sci. 396 (2017) 144– 153.
[41] A. Poursaee, Temperature dependence of the formation of the passivation layer on carbon steel in high alkaline environment of concrete pore solution, Electrochem. Commun. 73 (2016) 24–28.
CHAPTER 3
3
Corrosion improvement of carbon steel in concrete environment through
modification of the steel microstructure
2Introduction
Corrosion affects a steel reinforced concrete structure’s integrity. Increasing the corrosion resistance of the reinforcement is the most effective corrosion control method. The first and most reasonable mean for this concept is using alloying element in steel. Addition of a certain amount of Cr, Mo or Ni to steel during its manufacturing process decreases its corrosion rate by formation a corrosion resistance protective oxide layer on the surface that controls or hinders the corrosion in most environments. However, unless in certain applications, exploiting these types of steels, i.e. stainless steel, in the concrete environment does not have economic justification due to their high cost.
The other method that affects the corrosion resistance of steel is the modification of its microstructure, either during steel manufacturing or post-treatment procedure. Any changes in microstructure particularly grain size, grain size distribution and phase properties can affect the electrochemical behavior of steel. Indeed, the microstructure of the steel affects the formation and breakdown of the passive layer [1]. Little analysis has
2 H. Torbati-Sarraf, A. Poursaee, Corrosion Improvement of Carbon Steel in Concrete Environment through
been undertaken on this subject; none of them studied the impact of grain size of carbon steel on its corrosion activity in the high alkaline environment in concrete. The objective of this project was to assess the impact of the steel grain size on the occurrence of corrosion in concrete environments.
Steel microstructure, heat treatment and grain size refinement
Pure iron at temperatures below approximately 910°C has a Body-Centered Cubic structure (BCC). When heated above this temperature, the iron structure changes to a Face-Centered Cubic structure (FCC). When cooled, the change is reversed, and a BCC structure is again formed. Up to 2.0 wt.% carbon can dissolve in FCC iron, forming what is known as a solid solution, whereas in BCC iron no more than 0.02 wt.% carbon can dissolve in this way [2]. The solid solutions of carbon atoms in FCC iron and BCC iron are called austenite (γ) and α-ferrite, respectively. Any piece of steel is made up of a large number of grains, which are regions of regularity or crystallinity and the surfaces between them is called grain boundaries.
Influence of steel microstructure on its corrosion behavior
Little analysis has been undertaken on this subject; to date mostly the surface conditions studied have been at the mill scale on “as-received” steel bars, with the effects of this mill scale emphasizing the corrosion and passivation of the steel [6-8]. Modification of the steel grain size may well positively enhance corrosion resistance, however. In their investigation of the effect of grain size reduction on the
electrochemical corrosion behavior of nano-crystalline Fe in alkaline solution (10 wt.% NaOH), Afshari and Dehghanian concluded that the crystal grain size has important role in the resistance of the passive layer. Specifically, they observed a considerable increase in the corrosion resistance of Fe in weak alkaline solution with a decrease in grain size from the micro- to nano-crystalline [9]. Similarly, in their examination of the effect of grain size on the corrosion of mild steel in seawater, Jizhou et al. concluded that the corrosion rate increase with increasing the grain size [10]. A study by Gollapudi determined the existence of a finer and more compact passive layer within that fine microstructure, unlike the coarse-grained microstructure, which exhibited a more open passive layer [11]. Wang et al. concluded that the uniformity of passive layer on the fine microstructure was the result of the fine distribution of grain boundaries in contrast to the coarse distribution of these defects in a coarse-grained microstructure [12]. Ghosh et al. observed that in corrosive environments, the fine-grained materials corroded more uniformly than the coarse-grained alloys [13]. They suggested that the large volume fraction of grain boundaries combined with the fine grain size in fine materials ensured that the pits formed were shallow and closely connected resulting in uniform corrosion conditions. In contrast, the coarse-grained material with less grain boundary volume underwent localized corrosion which caused the formation of large isolated pits. They concluded that under active conditions, the extent of uniform or localized corrosion was again dependent on the grain size distribution. Poursaee and Saremi found that a surface heat-treatment consisting of carburizing and normalizing significantly improved the corrosion resistance of steel bars in concrete pore solution [14]. They hypothesized that
the more corrosion resistant phase of Fe3C and finer grains formed on the surface
decreased the corrosion rate. As above-mentioned, the impact of steel grain size on formation of the passive layer and the consequent corrosion is an important fact, and has been addressed in many studies, yet gaps in the literature exist. As far as the authors are concerned most of the previous studies, (except [14]), emphasized the impact of the steel microstructure on its corrosion in acidic-to-mild alkaline environment which do not represent the concrete environment.
Materials and experimental procedures
Specimen preparation
#4 (ɸ= ~12.7 mm) reinforcing steel bar was used in the project. To ascertain uniformity, specimens were cut and prepared from one bar. The main alloying elements were 0.39wt.% C, 1.3wt.% Mn, 0.15wt.% Si, 0.03wt.% P and 0.011wt.% S and Fe for balance. Specimens were cut into the length of 10 mm and after the required heat-treatments, they were epoxy mounted. To avoid any undesirable and unplanned microstructural change (including phase transformation, stress relief, etc.) low shrinkage cold epoxy were used for mounting. The surfaces of the epoxy mounted specimens were grounded, using 80 to 1200 grit SiC sandpaper, and then polished to 1μm using alumina slurry. The bottom epoxy portion up to the surface of the specimen bottom of each epoxy mounted specimen was drilled, and a copper wire was attached to the steel specimen to establish electrical connection. Then the hole was filled with epoxy. This procedure of
wire connection obviated the use of high temperature wire soldering that might alter the microstructure.
Heat-treatments were carried out using an electric furnace. Three different microstructures were used in this study: as-received, fine, and coarse. The grain size of the fine specimens was approximately half the size of the grains in the as-received specimens and the grain size of the coarse specimens was approximately two times larger than those in the as-received specimens. For heat-treatment, a benchtop muffle electric furnace with the heating rate of ~3oC/s was used. The fine specimens were prepared, using the method suggested by [15, 16] as the guideline. First, the as-received specimens were kept at 820 °C for 1 h and then air-cooled. Then, they were heated again to 710 °C for 30 min. nd air-cooled. To prepare the coarse specimens, the specimens were heated at 1020 °C for 1 h and then air-cooled. The time and temperature for both heat-treatment were selected based on the several trials. To examine the heat-treated specimens, 4% nital (4 mL of 15 M nitric acid in 96 mL ethanol) solution was used to etch the surface and reveal the microstructure of the specimens exposed to different heat-treatments. Each specimen was etched approximately 4 s and then washed with de-ionized water immediately and sprayed with ethanol and dried using air.
Electrochemical tests
Concrete simulated pore solution, with the composition given in Table 3-1, was used as the electrolyte in each cell to simulate the concrete environment [17].
Table 3-1. The composition of the simulated concrete pore solution. Compound mol/L NaOH 0.1 KOH 0.3 Ca(OH)2 0.03 CaSO4.H2O 0.002
Three identical specimens of each microstructure, i.e. as-received, find and coarse, were used in each measurement cell. The plastic container with the specimens and pore solution was sealed to minimize the carbonation. To keep the pH and oxygen level in the solution constant, the solution in each measurement cell was partially refreshed twice a month. The pH of the solution was periodically measured during the experiment to ascertain the pH remained around 13.2. To ascertain passivation, the specimens were exposed to chloride-free pore solution for 10 days and then 3 wt.% NaCl was added to solution and specimens were immersed in the chloride-contaminated pore solution for 60 days.
A three-electrode measurement setup, including a specimen as the working electrode, an SCE (saturated calomel electrode) as the reference electrode, and a 316L stainless-steel sheet as the counter electrode, were used for the LPR (linear polarization resistance), CP (cyclic polarization) and CV (cyclic voltammetry) and EIS (electrochemical impedance spectroscopy) tests. All electrochemical measurements were conducted at ambient temperature.
immersing the specimens in the solution, using an automated measuring system [18]. To determine the corrosion current densities of the specimens, the LPR within the range of ±10 mV vs. corrosion potential with the scan rate of 0.166 mV/s [19] was conducted on all specimens every 10 days. CP technique was carried out on one of the specimens in each cell to analysis the protectiveness of the passive film and the pitting susceptibility of the specimens. This test started at -100 mV below the corrosion potential to +500 mV vs. SCE and then decreased to -100 mV below the corrosion potential with the scan rate of 0.166 mV/s. CV was conducted to study oxidation and reduction behaviors of each specimen. The voltammograms were obtained between voltage limits of -1.4 V and +0.4 V vs. SCE at a linear sweep rate of 20 mV/s. The conventional EIS with sinusoidal perturbation of ±10mV, the frequency range of 100 kHz to 10 mHz was used to study the electrochemical behavior of the surface in solution.
Results and discussion
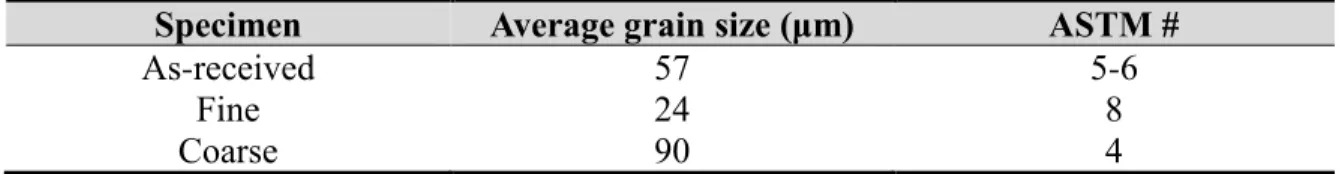
Figure 3-1 shows the microscopic images of the specimens. Phases, grain size distribution, and grain size, were determined using ASTM E112 [20]. Grain size, grain size distribution, and the ASTM number were also calculated which are given in
Figure 3-1. Optical microscopic images of the specimens.
Table 3-2. Grain size distribution and free ferrite portion of as-received and heat-treated steel rebar.
Specimen Average grain size (μm) ASTM #
As-received 57 5-6
Fine 24 8
Coarse 90 4
The results of the corrosion potential and corrosion current density measurements are shown in Figure 3-2. 24 h after addition of 3 wt.% NaCl, the corrosion potential values of the as-received specimens drastically dropped, showing that the passive layer could not protect the as-received specimens. A small drop of the corrosion potential was also observed for the fine specimens, while the potential of the coarse specimens continued to increase. The current density values (
Figure 3-2b) agreed with the trend observed from the corrosion potential measurements. The as-received specimens showed the worst corrosion resistance, followed by the fine and coarse specimens.
Figure 3-2. (a) Corrosion potential values and (b) corrosion current densities of the specimens.
Mass loss during the exposure time was calculated using Faraday’s law [21] and the results are shown in Figure 3-3. As can be seen, the mass loss in coarse and fine specimens compared to the as-received specimens decreased ~91% and ~72%, respectively.
Figure 3-3. The calculated average mass loss for the specimens during the entire time of exposure.
-0.5 -0.4 -0.3 -0.2 -0.1 0 10 20 30 40 50 60 70 P o te n ti al ( V ) v s. S .C .E
Time (days of immersion)
As-received Fine Coarse
-0.5 -0.4 -0.3 -0.2 -0.1 0 10 20 30 40 50 60 70 P o te n ti al ( V ) v s. S .C .E
Time (days of immersion)
0 0.02 0.04 0.06 0.08 0.1 0 10 20 30 40 50 60 70 ico rr (A .m -2)
Figure 3-4 shows the results of the cyclic polarization experiments on one the specimens from each microstructure, 42 days after exposure to the chloride-contaminated pore solution. As can be seen the location of the curves and the size of the cycle loops for both fine and coarse specimens showed more corrosion resistance compared to the as-received specimen.
Figure 3-4. Cyclic polarization plots from three different microstructures, immersed 42 days in chloride-contaminated pore solution with 3 wt.% NaCl.
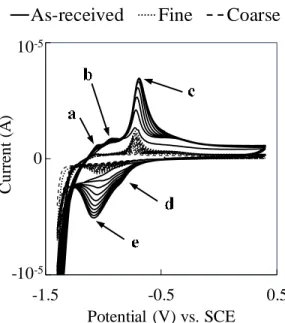
Voltammograms from the results of the cyclic voltammetry tests in chloride-contaminated pore solution for ten cycles perturbation performed at a scan rate of 50 mV/s are given in Figure 3-5. Peak a was attributed to the formation of a layer consisted of Fe(OH)2 and FeO, peak b was ascribed to the transformation of Fe2+ to Fe3+, and Peak
d appeared as the result of the reduction reactions corresponding to the anodic reactions at Peak b. Peak c was attributed to an oxidation within the compact passive layer, due to
the formation of the Fe2O3, Fe3O4, and FeOOH and Peak e was appeared as the result of
the reduction reactions for Peak c [22-23] . These results indicated that the redox reactions on all specimens are similar. However, regardless of the position of the peaks, as-received specimen showed wider hysteresis loop in both oxidation and reduction potentials, which was due to more activity on its surface. In addition, the as-received specimen showed higher current density values for peaks a, b and c compared to the other specimens, indicating more oxidation reactions on that specimen compared to the other specimens.
Figure 3-5. Cyclic voltammogram curves from three different microstructures obtained in
chloride-contaminated pore solution.
The results of all electrochemical tests showed that the corrosion resistance of the heat treatment specimens increased compared to the as-received specimen. In addition, the coarse specimen showed superior performance compared to the fine specimen. It was
-0.5 -0.4 -0.3 -0.2 -0.1 0 10 20 30 40 50 60 70 P o te n ti al ( V ) v s. S .C .E
Time (days of immersion)
As-received Fine Coarse
-1.5 -0.5 0.5 C u rr en t (A ) Potential (V) vs. SCE -10-5 10-5 0
hypothesized that the grain distribution and the proportion of different phases in the grains were the reason for such observation.
To determine the grain distribution within each specimen, I

![Figure 1-2. Impact of corrosion on aspect of society. In many of these areas [9]. Reprinted without permission](https://thumb-us.123doks.com/thumbv2/123dok_us/68848.2507913/17.918.282.634.345.688/figure-impact-corrosion-aspect-society-areas-reprinted-permission.webp)