Eye tracking and studying examples: how novices and advanced
learners study SQL examples
Amir SHAREGHI NAJAR, Antonija MITROVIC & Kourosh NESHATIAN
Department of Computer Science and Software Engineering, University of Canterbury, New Zealand [email protected]
[email protected] [email protected]
Abstract. Eye tracking provides information about a user’s eye gaze movements. For many
years, eye tracking has been used in Human Computer Interaction (HCI) research. Similarly, research on computerised educational systems also relies heavily on students’ interactions with systems, and therefore eye tracking has been used to study and improve learning. We have recently conducted several studies on using worked examples in addition to scaffolded problem solving. The goal of the project reported in this paper was to investigate how novices and advanced students learn from examples. The study was performed in the context of SQL-Tutor, a mature Intelligent Tutoring System (ITS) that teaches SQL. We propose a new technique to analyse eye-gaze patterns named EGPA. In order to comprehend an SQL example, students require the information about tables’ names and their attributes which are available in a database schema. Thus, if students paid attention to the database schema, they would understand SQL examples more easily. We analysed students’ eye movement data from different perspectives, and found that advanced students paid more attention to database schema than novices. In future work, we will use the findings from this study to provide proactive feedback or individualised amounts of information.
Keywords. Worked examples, eye tracking, data mining, eye-gaze behaviour, SQL-Tutor
1. INTRODUCTION
Eye tracking involves determining the point of gaze of a person’s eyes on a visual scene (Goldberg & Helfman, 2010). In recent years, eye tracking has been employed in many areas, ranging from usability studies of graphical user interfaces to marketing and psychology. Eye tracking can also be used instead of other input devices. For example, Wang, Chignell and Ishizuka (2006) used eye movement data to allow students to select a topic to study by simply looking at a portion of the screen for a pre-specified time, or answer questions using eye movements. In psychology, researchers have observed different aspects of human cognition, such as intention or planning, using an eye tracker (Rayner, 1995; 1998). Eye trackers are devices used for measuring eye movements (Duchowski, 2007). Eye tracking has been largely used in laboratory settings; to make this technology available to a wider audience, ordinary webcams have recently been used to track eye gaze movements (San
2 Agustin et al., 2010).
Intelligent Tutoring Systems (ITSs) are computer-based systems that provide individualised feedback to students while they solve problems (Woolf, 2010). The student’s interactions with the ITS interface is of high importance, as they reveal what students pay attention to. Therefore, eye tracking data can be used to improve student modelling and also provide adaptive support (Kardan & Conati, 2012). There are also studies such as (Bull, Cooke, & Mabbott, 2007; Mathews et al., 2012) that investigate how students interpret various presentations of open student models. Eye tracking also enables investigations of successful and unsuccessful student behaviour that lead students to learn or fail to learn. This kind of information can be used to further enhance mechanisms for adaptive provision of feedback. ITSs can alert students to unsuccessful behaviour and encourage productive behaviour (Kardan & Conati, 2012).
Most ITSs support problem solving, but research shows that incorporating examples into ITSs improves learning more than using problems only (McLaren & Isotani, 2011). In early stages of learning, learners benefit more from seeing worked-out examples (i.e. problems with solutions) than attempting to solve problems unaided. Numerous studies have found the worked example effect (Rourke & Sweller, 2009; Schwonke et al., 2009; Sweller, Ayres, & Kalyuga, 2011), when learners learn more from studying worked examples than from unsupported problem solving. Sweller (2006) explains the worked example effect based on the Cognitive Load Theory (CLT). Examples provide step-by-step explanations and knowledge necessary to solve problems and thus decrease the cognitive load on the learner’s working memory. Therefore, the example-based strategy is more helpful for novices who lack the necessary knowledge and have to deal with an enormous amount of cognitive load. In our previous work, (Shareghi Najar & Mitrovic, 2013a; 2013b) we found that students who learnt from alternating examples and tutored problem solving learnt significantly more than students who learnt from examples or problems only. Investigating how novices and advanced students study examples could lead to new approaches for optimizing learning from examples.
Examples can be provided to the student as passive learning exercises (i.e. material to read), but they can also be made interactive by requiring the student to explore the example step-by-step or even provide explanations (Koedinger & Aleven, 2007; Brusilovsky & Yudelson, 2008; McLaren & Isotani, 2011). Eye tracking can be leveraged to observe whether or not students study examples productively. Our hypothesis is that there are important differences in how novices and advanced students study SQL examples. Knowing such differences would enable us to improve the ITS to provide adaptive guidance to students and therefore improve learning from examples. We start by discussing eye tracking in general and the eye tracker we have used in our project, and present a review of related work in Section 3. Section 4 presents the design of our study, followed by the results and discussion.
2. EYE TRACKING
Eye tracking involves monitoring of the user’s eye gaze. The process often contain noise, which can be caused by different factors such as participant’s head movements, inaccurate calibration, or wearing contact lenses and glasses (Bednarik, 2005; Goldberg & Helfman,
2010). As a result, eye trackers are not always able to collect eye-gaze data while tracking a user’s eye (Bednarik, 2005); moreover, eye trackers cannot report samples constantly for a validity check (Kardan & Conati, 2012). Eye trackers report invalid eye gaze data when the user suddenly looks away from the screen. The invalid data can be identified by inspecting a video of the session. Nevertheless, the invalid data should be excluded during the validation of the rest of the data (Kardan & Conati, 2012).
In this project, we used the Tobii TX300 eye tracker (Tobii Technology, 2010) to capture eye movements of students. Tobii allows unobtrusive eye tracking and collects a variety of data that can be analysed using Tobii StudioTM or externally. Before an evaluation session starts, Tobii Studio calibrates the system with the participant’s eye movements. In the calibration phase, the eye tracker asks the participant to follow a red marker over a grid of calibration dots. Next, the eye-tracker shows the calibration results. There are eighteen dots (nine dots for each eye). The offset between the calibration of the centre dot and each gaze point is shown by the marks in the middle of the dots. Experimenters can accept the calibration or repeat the calibration phase.
For each data sample, Tobii provides a validity code, specifying where data has been recorded for both eyes (0), one eye only (1 if it is known which eye, or 2 when such information is not available), or whether the gaze data is corrupted (3) or missing (4). Tobii studio manual recommends removing all data with the validity score of 2 and above. Tobii Studio 3.1.4 calculates the quality of recordings by dividing the number of eye-tracking samples that were correctly identified by the number of attempts (the number of times the eye tracker collects eye movement data points). For instance, 100% samples mean that Tobii has found both eyes throughout the recording; 50% means that both eyes were identified only half of the time, or that one eye was identified during the full recording.
The Tobii eye-tracker collects different data, including horizontal and vertical positions of the gaze point for the left and right eyes, validity codes, and size of the pupils, which will be affected by wearing glasses or contact lenses. Afterward, the data can be analysed using Tobii StudioTM or an external tool. For instance, data can be sent to a web service to be analysed in real time (Steichen et al., 2013). Another external tool is the Eye Movement Data Analysis Toolkit (EMDAT), a library developed for processing eye gaze data (Kardan et al., 2012). In this research, we used Tobii StudioTM to analyse eye gaze data. Tobii StudioTM supports double screens mode, in which an experimenter can monitor the participant’s eye movements on a different screen at the same time.
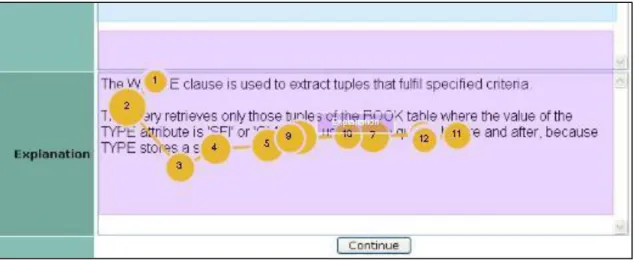
The human eye makes rapid eye movements (saccades) and fixations on some points on the image (Goldberg & Helfman, 2010). A fixation is defined by selecting a Velocity Threshold value. This value specifies the maximum pixel-distance between two consecutive data points required to be considered a part of fixation. The data points above the threshold are called saccade points and are not used in the analysis. We chose the default threshold in Tobii Studio (defined in the I-VT Filter) because, in contrast with pixel locations of gaze points, the I-VT filter uses the angular velocity of the eyes’ movement data; thus, the data is independent of screen size and resolution, and the distance between the participants and what is shown on the screen. Figure 1 shows 13 consecutive fixations captured by Tobii over 3 seconds.
In Tobii StudioTM we can set up Areas Of Interest (AOIs), corresponding to the areas of the system’s interface which provide functionality of relevance (Kardan & Conati, 2012). AOIs
4
could be used to identify scanning sequences and transitions, and also to tally fixations (Goldberg & Helfman, 2010). To minimise misclassification of gaze data, a gap should be used between AOIs where it is possible, otherwise the regions might be too close together (Loboda & Brusilovsky, 2010).
Figure 1. A sample screen with fixations captured over three seconds
3. RELATED WORK
Prior research has employed eye tracking in many areas. In this section, we discuss how eye tracking has been used to investigate students’ interactions with ITSs, as well as learning from ITSs and learning from examples.
3.1.Eye tracking and ITSs
Research shows that eye tracking can improve student modelling. In Sibert, Gokturk and Lavine’s (2000) study, the ITS tracked reading patterns of students and provided support once the patterns showed difficulties in reading a word. The result showed that the system improved the speed and accuracy of reading. Gluck et al. (2000) demonstrated how eye tracking increased user model bandwidth for educational purposes. Students worked with the modified version of Algebra Tutor (Koedinger & Anderson, 1998). Gluck et al. (2000) found that some students ignore algebraic expressions and/or feedback messages; thus, the tutor can prompt them to pay attention to those areas.
Self-explanation is a meta-cognitive activity in which students explain learning materials to themselves (Chi et al., 1994; Chi et al.,, 1989). Conati and Merten (2007) found that eye data provides a more accurate assessment of self-explanation compared to using time data only. The result corroborates the findings of Conati et al.’s (2005) study which concluded that eye tracking is superior to time-based evidence for explanation, because users who self-explain probably look at AOIs, which indicate the effects of users’ exploratory actions. Amershi and Conati (2007) suggested a user-modelling framework for interactive environments. In the model, they used supervised and unsupervised machine learning. First,
common learning behaviours were identified for offline initialisation. Users were clustered using the k-means algorithm (Duda, Hart & Stork, 2012). Clustering was based on feature vectors including eye-tracking data and interface. Then behaviours were labelled as beneficial or detrimental to learning by a human expert. In the online recognition phase, a classifier model used the clusters to categorise students as low achievers or high achievers. Students used the Adaptive Coach for Exploration (ACE), an exploration-based learning environment. ACE allows students to explore mathematical functions (Bunt et al., 2001). The results show that low achievers paused less and made fewer indirect gaze shifts after an action that changes other parts of the interface than high achievers. Later, Amershi and Conati (2009) proposed a data-based user modelling framework. The model used both supervised and unsupervised learning to make student models. They used both logged interface and eye-tracking data. The results showed that the framework could automatically identify meaningful interaction behaviours of students. Moreover, the framework could be used to make student models for the online classification of new student behaviours. Mining of association rules for adaptive actions is a refinement to the framework (Kardan & Conati, 2011).
Kardan and Conati (2012) present two classifiers that identify high and low achievers using students’ eye movements. In this study, participants used the Constraint Satisfaction Problems (CFS) applet, an interactive tool for learning Artificial Intelligence algorithms. Participants were asked to solve two problems while an eye tracker was capturing their eye gaze data. The researchers analysed all captured data and also changes in participants’ eye movements from the first to the second problem. Overall, their classifier achieved a high accuracy (71%) in classifying students as low or high achievers, using only information about patterns of a user’s overall attention. When changes in students’ eye movements between the first and the second problem were provided to the classifier, accuracy improved further (76%). In Kardan and Conati’s (2012) study, data was captured over the whole session; thus, to achieve a high accuracy, the classifier needed complete session data, otherwise the accuracy of decisions would not be high enough, specifically in the early stages of learning. Kardan and Conati (2013) show that the actions from logs plus eye data improve the classifier’s accuracy to 85% by considering 22% of all interaction data.
Tsai et al. (2012) used eye tracking to examine learners’ visual attention while they solved multiple-choice science questions. Students were asked to predict occurrences of landslide hazards from four images illustrating different scenarios. Each scenario showed a combination of four different factors. Researchers investigated the fixation duration between chosen and rejected options and also among the relevant and irrelevant factors. The think-aloud protocol was used in the study; consequently, content analyses were performed to analyse the students’ responses and think-aloud protocols. The authors found that students paid more attention to chosen options than rejected options; moreover, they spent more time checking relevant factors than irrelevant factors. Successful participants paid more attention to relevant factors while unsuccessful students experienced difficulty in recognising relevant factors.
Elmadani et al. (2013) investigate how students interact with tutorial dialogs in EER-Tutor by analysing interaction logs and eye-gaze data. EER-Tutor is a constraint-based tutor which teaches conceptual database design (Zakharov et al., 2005). The authors found that advanced
6
students selected appropriate areas to visually focus on, whereas novices paid attention to irrelevant areas on the screen.
3.2. Eye tracking and learning from examples
Several studies have employed eye tracking to improve learning from examples, mostly focusing on how to guide the user’s attention via experts’ eye movements. Van Gog et al. (2009) showed that when the eye movement guidance was combined with a verbal explanation, it had a detrimental effect on learning. This is surprising since, based on the modality principle in multimedia learning, learners learn more when they use both visual and audio channels for learning (Mayer, 2002).
Jarodzka et al. (2013) investigated a new technique to teach perceptual tasks. They used eye movement modelling examples (EMME) to teach classifying fish locomotion. In modelling examples, the problem solution was demonstrated to learners by a model, which could be an animated agent or a human (van Gog & Rummel, 2010). They had three conditions: EMME with dot display, EMME with spotlight display and a control group. Students in EMME conditions received attention guidance by using dots or a spotlight on the screen to show where the expert was looking. Students who saw the spotlight could not see irrelevant areas as they were opaque on the screen. The control group did not receive attention guidance. Students first watched four videos in which the expert explained how to classify fish locomotion, while students in the EMME conditions could additionally see where the expert was looking on the screen. Next, the students watched four videos for a visual search test and finally took an interpretation test. Overall, the study showed that EMME improves visual searching and enhances interpretation of relevant information. A few contrasts between EMME conditions show that the dot and spotlight displays have different effects on various test features. For instance, the first fixation generally happened earlier in the spotlight group compared to the dot display condition. On the other hand, the dot display group outperformed the spotlight group in an interpretation question which measured the ability of the group in memorising the essential fish parts.
Litchfield et al. (2010) conducted three experiments to observe how guiding attention via other people’s eye movements would improve radiographer performance in reading chest X-rays. In Experiment 1 they found no significant difference between the performance of the groups given eye movements of a novice or an expert radiographer. In Experiment 2, only novices improved when they were provided with the expert’s eye movements. In Experiment 3 they restudied the contribution of image, task and level of models’ expertise. Litchfield et al. (2010) suggest that guiding users’ attention via another person’s eye movements may have a short-lived effect, but it can help novices to scaffold their decision using other people’s search behaviour.
Schwonke et al. (2013) investigated whether or not metacognitive knowledge of how to solve a complex problem improves learning. Metacognitive knowledge was provided in the form of cue cards, encouraging students to strategically use instructional resources in learning environment (i.e., students learnt when to use each facility). Instructional resources were textual/graphical representations and different help facilities, and the learning environment was a Geometry Cognitive Tutor (Koedinger & Anderson, 1993). They recorded learners’ gaze and log files during learning. Schwonke et al. (2013) calculate fixation duration for
non-interactive elements which is the sum of all single fixations on the elements during the learning phase. Results show the metacognitive support is efficient for learning and novices developed deeper conceptual knowledge.
4. EXPERIMENT DESIGN
Eye tracking has been used previously to provide additional information for student modelling and also to guide students while learning from modelling examples. To the best of our knowledge, eye tracking has not been used to study whether there are differences in how novices and advanced students study worked examples. Knowing about such differences could enable us to improve ITSs by providing students with adaptive guidance. Our hypothesis is that there are important differences in how novices and advanced students learn from examples.
We performed an experiment with SQL-Tutor (Mitrovic, 1998; 2003), a constraint-based tutor that teaches Structured Query Language (SQL). SQL is the most widely used query language for relational databases. SQL-Tutor complements traditional lectures; it assumes that the student has already acquired some knowledge via lectures and labs. SQL-Tutor provides numerous problem-solving opportunities to students. We extended the system by adding the worked-example mode (Shareghi Najar & Mitrovic, 2013a). In this study, we focus on how students study examples only.
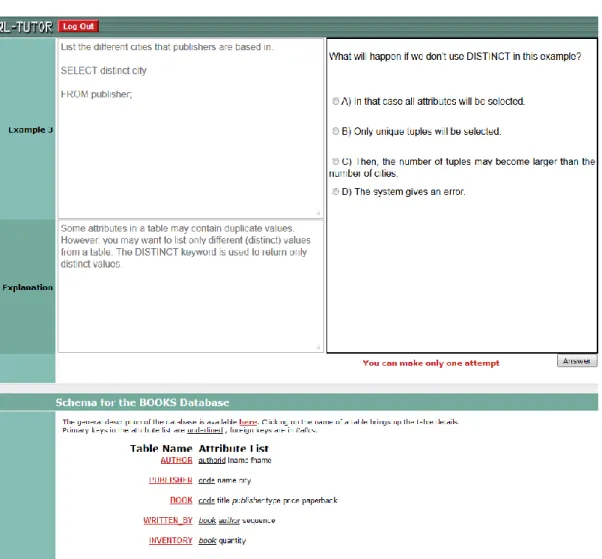
Figure 2 presents the screenshot of the worked-example mode, with a worked example at the top, followed by an explanation. We chose the Books database from thirteen databases available in SQL-Tutor. The schema of the selected database is shown at the bottom of screen; primary keys are underlined, and foreign keys are in italics. Once a student confirms that s/he has finished studying the example (by clicking the button), the system presents a Procedural-focused Self-Explanation (P-SE) prompt (shown in the top right pane in Figure 2). P-SE prompt is a multi-choice question that encourages students to explain solution steps (Shareghi Najar & Mitrovic, 2013a; 2013b). P-SE prompts were added after examples because students acquire more conceptual knowledge than procedural knowledge from examples (Schwonke et al., 2009; Kim et al., 2007), so P-SE fosters student’s procedural knowledge.
All student actions were logged, including a timestamp, the example number, answers to the P-SE prompts, and when students asked for additional information about the schema (such as attribute specifications). In addition to the logs, Tobii saved the screen video of each session; therefore, we have one recording per student.
The participants were 22 students who also participated in our previous experiment in which we used a different database. Thus, the examples used in this study were new to the participants. We first asked students whether they had any vision problems and whether they needed glasses. After obtaining informed consent, we calibrated Tobii with students’ eye gaze. Each student received NZ$20 voucher for participating in the study.
All participants used the same version of SQL-Tutor. The system presented six examples, each followed by a P-SE prompt. The students saw complete examples and their explanations at the same time and they had only one attempt for each P-SE prompt. When the student
8
chose a wrong answer for a P-SE prompt, the system disclosed the correct answer and let the student continue with the following example.
Figure 2. Screenshot of the worked-example mode of SQL-Tutor
5. RESULTS
The preliminary results of this study have previously been published in (Shareghi Najar, Mitrovic & Neshatian, 2014); we present additional findings in this section. As the goal of the study was to identify differences in how novices and advanced students study examples, we do not report on eye-tracking data while students were answering P-SE prompts. We start by presenting the approach used to group students into novices and advanced students, followed by an analysis of time students spent studying examples.
5.1.Grouping the students
A common technique to identify novices and advanced students is to use pre-test scores. For instance, students who scored above the median on the pre-test are considered as advanced
and the other students are considered as novices. However, in the current study we did not give pre/post-tests to the participants, because we needed to keep the sessions short. The participants had taken a pre-test in the study performed immediately before this study (Shareghi Najar & Mitrovic, 2013a) and we considered using those pre-test scores to divide the participants into novices and advanced students. However, the students worked with SQL-Tutor between the two studies; therefore, pre-test scores from the first study are not a precise measure of their incoming knowledge as they undertook additional learning since taking the pre-test.
For that reason, we used the K-Medoids algorithm (Kaufman & Rousseeuw, 1987) in order to cluster students into two groups. The inputs for the clustering algorithm were the pre- and post-test scores from our first study, and the P-SE scores and learning time from the current study. K-Medoids produced two clusters which we labelled Novices and Advanced, summarised in Table 1. The average scores of novices on the pre-test, post-test and P-SE prompts are lower than the average for the whole group (the Total column) and novices also spent less time studying examples. There are significant differences between the two groups on the pre-test, post-test and P-SE scores.
Table 1. Comparisons between the two clusters (standard deviations provided in brackets) Total (22) Novices (12) Advanced (10) p
Pre-test (%) 40 (13) 33 (11) 48 (11) <0.01* Post-test (%) 70 (16) 63 (16) 79 (12) 0.02* P-SE (%) 83 (13) 76 (11) 92 (9) <0.01* Time (min) 21.5 (9) 20 (8.6) 23 (9.8) 0.44
5.2.Time spent studying examples
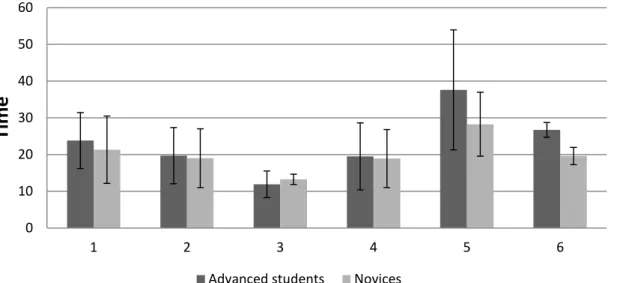
Figure 3 shows that students spent noticeably more time on Example 1 than the following three examples, although the first example is the simplest one. This is because in Example 1 the students needed to learn the interface. That also explains why the time per example gradually reduced until Example 3. Afterwards, the time grew with increasing complexity of examples, except for the last two examples. Although Example 6 (nested queries) had a higher complexity than Example 5, Example 5 contained five clauses (SELECT, FROM, WHERE, GROUP BY, ORDER BY) while Example 6 only contained three clauses (SELECT, FROM, WHERE). Therefore, students needed more time to study Example 5 than Example 6. We compared the times novices and advanced students spent on each example using the Mann-Whitney U test and found no significant differences.
10
Figure 3. Average time (in seconds) spent on each example
5.3. Sample quality
The Tobii studio provides an overall recording quality for the whole session, which was 77% for this study. We divided each recording into segments corresponding to individual examples. We calculated the quality for each segment by dividing the number of valid data samples (validity codes 0 and 1) by the total number of samples in the segment. The data related to one participant was excluded from further analyses due to technical issues and lost information.
The threshold for sample quality was set at 40% as we could not recognise patterns in recordings with lower qualities; thus, two more participants were excluded from further analyses. After excluding low quality data, the overall recording quality for the whole session was 90%. Additionally, one participant studied examples only after s/he received the P-SE prompts, causing very short segments for examples and therefore we excluded data for this participant.
5.4. Eye Gaze Pattern Analysis (EGPA) coding scheme
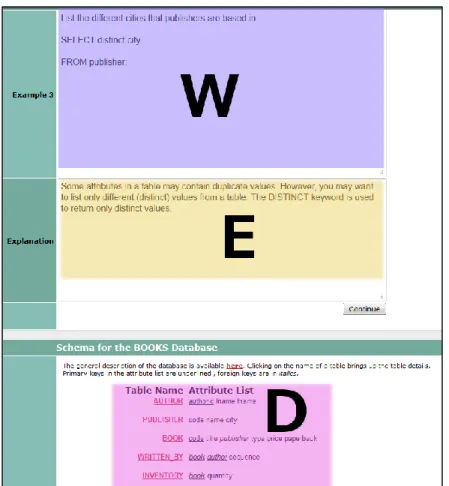
The goal of this study is to investigate how novices and advanced students study examples. In order to identify patterns, we divided the interface into AOIs, as illustrated in Figure 4. Area ‘W’ represents the worked example, ‘E’ is the explanation area and ‘D’ is the database schema. We then developed a new coding scheme named Eye Gaze Pattern Analysis (EGPA) to analyse the data. In EGPA, we define a number of eye-gaze patterns and eye-gaze behaviours. Patterns are actions showing a student’s attention on an AOI or eye gaze movement from one AOI to another. A behaviour is a sequence of patterns.
0 10 20 30 40 50 60 1 2 3 4 5 6
Time
Figure 4. Areas of interest on the screen
Patterns are the smallest elements that explain eye gaze movements over a short time period (1.5s). We examined the sessions, and identified four types of patterns: reading, mixed reading, transferring and scanning. A pure reading pattern represents a situation when the student is paying attention solely to one AOI. If the student glanced at an AOI while reading another area, we labelled such a pattern as a mixed pattern. A transferring pattern shows that the student’s eye gaze moved from one AOI to another. Finally, in a scanning pattern the student scans the screen. This pattern occurs early in the session, when the student looks at the interface in order to become familiar with it. EGPA contains the following types of patterns:
X identifies that the student has only looked at area X. For example, seeing ‘W’ means that the student solely paid attention to the worked example. This pattern is reading.
XyX identifies that the student had a short look at area Y while s/he was reviewing area X. For instance, ‘EdE’ shows that the student read an explanation (E), but s/he had a quick look at the database schema (D) while s/he was reading the explanation. Mixed reading is this type of pattern.
XY shows that the student’s eye gaze moved from area X to area Y; for example, ‘WE’ means that student’s attention changed from the worked example to the explanation. This type of pattern is transferring.
12
S identifies that the student scanned the screen. This normally happens when a student sees the interface for the first time or when they are searching for information. Scanning is the type of this pattern.
As mentioned before, eye-gaze behaviours are combinations of patterns. An example of behaviour is W WE EdE EW WdW: the student first read the worked example, then the explanation. EdE shows that the student had a quick look at the database schema while s/he was reading the explanation. Then, the student’s eye gaze moved from the explanation to the worked example and s/he had a quick look at the database schema while reading the worked example.
5.5. Analysis of patterns
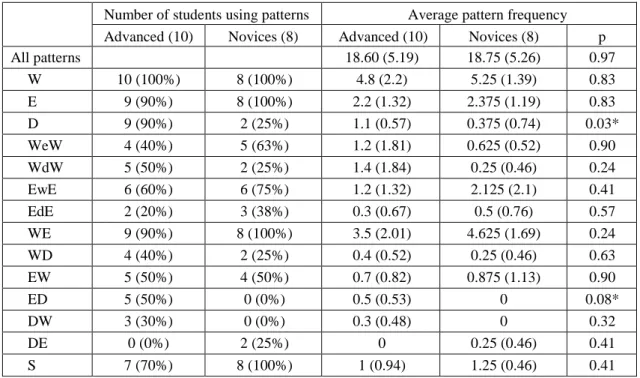
The Mann-Whitney U test revealed no significant difference between the total number of patterns used by novices and advanced students, summarised in Table 2. We also used the Mann-Whitney U test to see whether there are significant differences between the two groups in pattern frequencies. The advanced students used the D and ED patterns significantly and marginally significantly more often than the novices (p = .03 and p = .08 respectively). The D pattern was used by 90% of advanced students compared to only 25% of novices. The ED pattern was not used by novices at all, while half of advanced students have used it.
Table 2 also shows that patterns EdE, WeW, EwE were used by 38%, 63% and 75% of novices compared to 20%, 40% and 60% of advanced students. Moreover, the table shows that 50% of advanced students used WdW compared to 25% of novices.
Table 2. Average pattern frequencies
Number of students using patterns Average pattern frequency Advanced (10) Novices (8) Advanced (10) Novices (8) p
All patterns 18.60 (5.19) 18.75 (5.26) 0.97 W 10 (100%) 8 (100%) 4.8 (2.2) 5.25 (1.39) 0.83 E 9 (90%) 8 (100%) 2.2 (1.32) 2.375 (1.19) 0.83 D 9 (90%) 2 (25%) 1.1 (0.57) 0.375 (0.74) 0.03* WeW 4 (40%) 5 (63%) 1.2 (1.81) 0.625 (0.52) 0.90 WdW 5 (50%) 2 (25%) 1.4 (1.84) 0.25 (0.46) 0.24 EwE 6 (60%) 6 (75%) 1.2 (1.32) 2.125 (2.1) 0.41 EdE 2 (20%) 3 (38%) 0.3 (0.67) 0.5 (0.76) 0.57 WE 9 (90%) 8 (100%) 3.5 (2.01) 4.625 (1.69) 0.24 WD 4 (40%) 2 (25%) 0.4 (0.52) 0.25 (0.46) 0.63 EW 5 (50%) 4 (50%) 0.7 (0.82) 0.875 (1.13) 0.90 ED 5 (50%) 0 (0%) 0.5 (0.53) 0 0.08* DW 3 (30%) 0 (0%) 0.3 (0.48) 0 0.32 DE 0 (0%) 2 (25%) 0 0.25 (0.46) 0.41 S 7 (70%) 8 (100%) 1 (0.94) 1.25 (0.46) 0.41
5.6. Analysis of eye-gaze behaviours
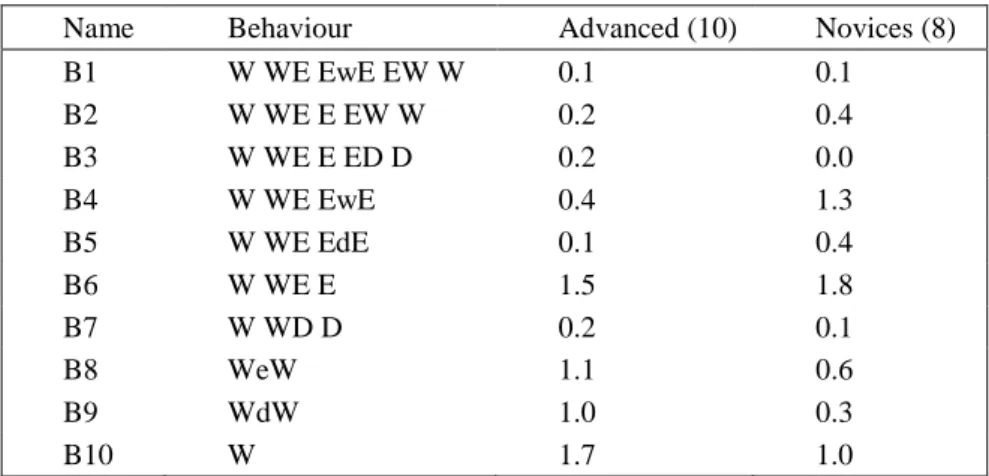
An eye-gaze behaviour consists of an ordered list of patterns. We identified 42 distinct behaviours from 117 segments. We first sorted behaviours by their frequencies; we refer to behaviours which appeared more than once as frequent behaviours, listed in Table 3. Frequent behaviours were sorted by the number of patterns and number of characters they contain, and finally their alphabetic order. Then, we searched for the frequent behaviours within the non-frequent behaviours, and changed the sequence of patterns that matches the frequent behaviour, to the name of the behaviour (e.g. B3). For instance, “WdW WeW” is a non-frequent behaviour, which consists of two frequent behaviours (B9 and B8). As we searched in order, first B8 replaced “WeW” and in the next round B9 replaced “WdW”. Therefore, “WdW WeW” was changed to “B9 B8”. In another example “W W WE E ED D” was changed to “B10 B3”. We then counted the number of times frequent behaviours appeared. We repeated the same procedure for novices and advanced students and computed the averages. Therefore, the frequency is the total number of times advanced students/novices used a behaviour divided by the number of advanced/novices. The result is shown in Table 3. The Mann-Whitney U test showed no significant differences between novices and advanced students in behaviour frequencies.
Table 3. Average behaviour frequencies
Name Behaviour Advanced (10) Novices (8)
B1 W WE EwE EW W 0.1 0.1 B2 W WE E EW W 0.2 0.4 B3 W WE E ED D 0.2 0.0 B4 W WE EwE 0.4 1.3 B5 W WE EdE 0.1 0.4 B6 W WE E 1.5 1.8 B7 W WD D 0.2 0.1 B8 WeW 1.1 0.6 B9 WdW 1.0 0.3 B10 W 1.7 1.0
Among the frequent behaviours, B3 was only used by advanced students. B3 illustrates a top-down procedure in reading: the student first reads the worked example, then the explanation and finally the database schema. B3 is a logical routine that advanced students followed. As the advanced students had prior knowledge about the concepts covered in the examples, they looked at the explanation and database schema to find new information which they have not learnt before. Advanced students used B8, B9 and B10 more often than novices. These three behaviours contain one pattern each; therefore, advanced students used less complex behaviour than novices. Such simple behaviours may be explained by advanced students having more knowledge. On the other hand, novices used B2, B4 and B6 more than advanced students. In B2, students first studied the worked example followed by reading explanation, and finally they restudied the worked example. B4 is similar to B2, but instead of restudying worked example, students had a quick look at the worked example while reading the explanation. B6 shows that students first studied the worked example followed by reviewing explanation, but they did not pay attention to the database schema.
14
5.7. Analyses of eye-tracking data
In order to observe how often participants visited AOIs, we extracted the following metrics from the Tobii Studio:
Fixation duration (seconds): duration of each individual fixation within an AOI.
Total fixation duration (seconds): duration of all fixations within an AOI.
Fixation count: the number of fixation within an AOI.
Visit duration (seconds): duration of each individual visit in an AOI.
Total visit duration (seconds): duration of all visits within an AOI.
Visit count: The number of visits with an AOI.
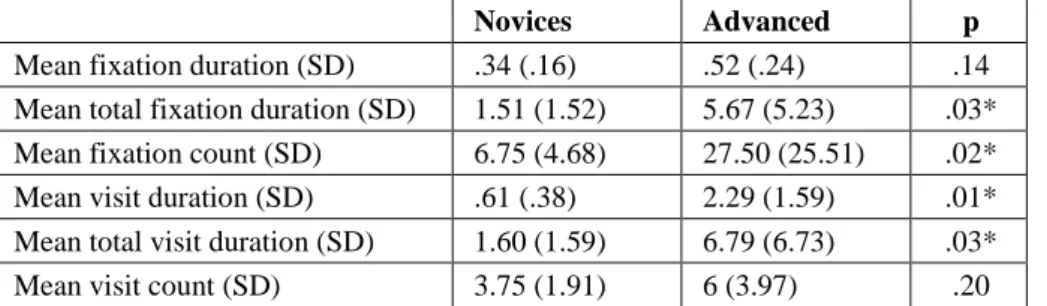
Table 4. Eye-gaze metrics for novices and advanced students in DAOI
Novices Advanced p Mean fixation duration (SD) .34 (.16) .52 (.24) .14 Mean total fixation duration (SD) 1.51 (1.52) 5.67 (5.23) .03* Mean fixation count (SD) 6.75 (4.68) 27.50 (25.51) .02* Mean visit duration (SD) .61 (.38) 2.29 (1.59) .01* Mean total visit duration (SD) 1.60 (1.59) 6.79 (6.73) .03* Mean visit count (SD) 3.75 (1.91) 6 (3.97) .20
We used the Mann-Whitney U test to compare novices and advanced students for the above metrics within the three AOIs: the database schema (D), worked example (W) and explanation (E). Table 4 shows the results for DAOI. There is no significant difference (p = .14) between novices and advanced students on the fixation duration. There are significant differences between the two groups on mean total fixation duration, fixation count, visit duration and total visit duration (p = .03, p = .02, p=.01, p = .03). That is, advanced students fixated more than novices on DAOI; moreover, total visit duration show that advanced students significantly spent more time studying database schema than novices. This result corroborates our previous analyses. Since looking at database schema is necessary to comprehend SQL examples, novices did not know how to study the examples.
Table 5. Eye-gaze metrics for novices and advanced students in WAOI
Novices Advanced p
Mean fixation duration (SD) 1.44 (1.63) 1.42 (1.80) .63 Mean total fixation duration (SD) 56.10 (15.41) 70.00 (40.33) .89 Mean fixation count (SD) 230.75 (46.03) 282.40 (146.21) .76 Mean visit duration (SD) 21.98 (9.49) 17.89 (9.47) .36 Mean total visit duration (SD) 68.80 (21.47) 82.01 (45.88) .96 Mean visit count (SD) 24.38 (8.93) 32.60 (14.84) .15
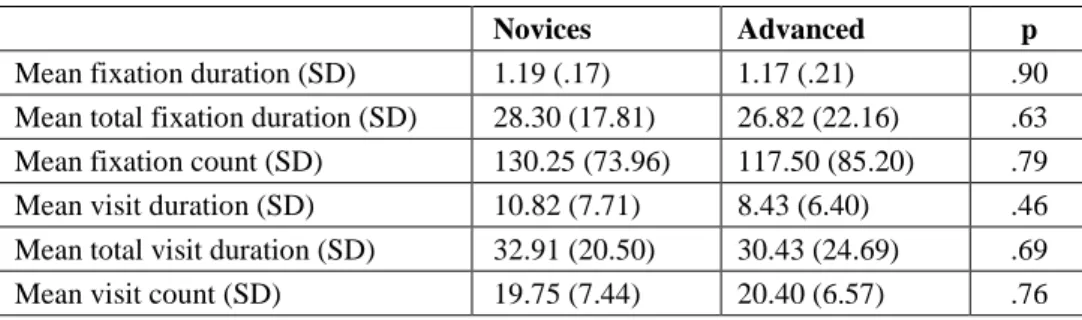
Tables 5 and 6 present the results for the WAOI and the EAOI. There were no significant differences between the distributions of those metrics, showing that both novices and advanced students were aware of the importance of studying WAOI and EAOI.
Table 6. Eye-gaze metrics for novices and advanced students in EAOI Novices Advanced p Mean fixation duration (SD) 1.19 (.17) 1.17 (.21) .90 Mean total fixation duration (SD) 28.30 (17.81) 26.82 (22.16) .63 Mean fixation count (SD) 130.25 (73.96) 117.50 (85.20) .79 Mean visit duration (SD) 10.82 (7.71) 8.43 (6.40) .46 Mean total visit duration (SD) 32.91 (20.50) 30.43 (24.69) .69 Mean visit count (SD) 19.75 (7.44) 20.40 (6.57) .76
5.8. Using machine learning classifiers
We also generated classifiers using several Machine Learning algorithms in order to identify important features which could predict the class of the student (advanced or novice) based on the eye-gaze patterns and behaviours he/she exhibited while studying examples. As discussed earlier, we have excluded data from four participants because of either low-quality data or unusual participant behaviour. In order to generate classifiers, we used WEKA (Hall et al., 2009), and selected the following algorithms: J48, LADTree, BFTree, JRip. We selected al-gorithms that produce decision trees or rules, as such outputs are easy to visualise and inter-pret by humans. Each feature vector specifies frequencies of patterns and behaviours listed in Table 7, for one participant.
The classifiers predict the class label (novice or advanced) using the whole session eye-movement data. We use accuracy to measure the classification performance because we consider correct classification of instances (students) from either of the two classes equally important. Leave-One-Out Cross-Validation (LOOCV) is carried out to estimate the accuracy of different classification schemes. In each LOOCV iteration, an instance is put aside for testing and a new (and possibly different) model is constructed based on the remaining data. This process is repeated until the dataset is exhausted.
Table 7. Features used
Number Feature Number Feature Number Feature
1 WE 10 E 19 B3 2 WeW 11 DW 20 B4 3 WD 12 DwD 21 B5 4 WdW 13 DE 22 B6 5 W 14 DeD 23 B7 6 EW 15 D 24 B8 7 EwE 16 S 25 B9 8 ED 17 B1 26 B10 9 EdE 18 B2
Table 8 shows the estimated accuracies, obtained by testing 18 classifiers in each scheme (equal to the number of iterations in LOOCV). The majority of the classifiers perform
16
reasonably well. This indicates the presence of some good (discriminative) features in the data, which in turn implies that the two student groups have somewhat distinct behaviour patterns in studying examples.
Table 8. Accuracy of classifiers Classifiers Accuracy
J48 61%
JRip 72%
BFTree 83%
LADtree 89%
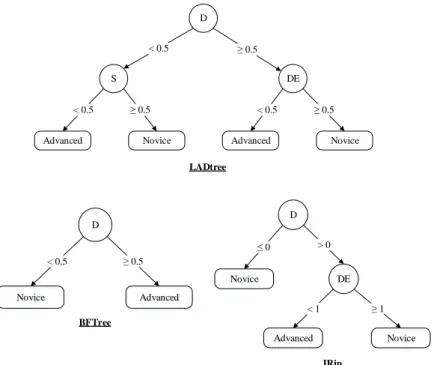
Figure 5 illustrates the top three performing classifiers (LADTree, BFTree and JRip), which all reveal feature D as the most influential one. The LADTree and JRip classifiers both use DE as the second most influential feature. These two features are in agreement with our previous findings about significant differences in pattern usage between the two groups, reported in Table 2. D Advanced Advanced < 0.5 ≥ 0.5 DE Novice < 0.5 ≥ 0.5 S Novice ≥ 0.5 < 0.5 LADtree D Novice Advanced < 0.5 ≥ 0.5 D Novice Advanced ≤ 0 > 0 DE Novice < 1 ≥ 1 BFTree JRip
Figure 5. Three top classifiers
5.9. Heat maps
A heat map provides a graphical representation of eye-tracking data on a screen, in which colours are used to show data values (Bojko, 2009). Humans are familiar with colors representing different temperatures, which make heatmaps easy to interpret: an area where most of eye gazes are fixated is visualized by using the red color, and areas with lower levels of eye gazes range over yellow and green gradually. Figures 6-8 show the heat maps for all participants, for the six examples.
In Examples 1 and 2, students paid more attention to the explanation AOI than the latter examples. Students paid less attention to the explanation AOI in Examples 3 and 4 than in the last two examples. Similarly, students paid more attention to the database schema during Example 1 compared to other examples. However, in Examples 3 and 6, students paid attention to the database schema, but not as much as they did in Example 1. Students did not check the database schema in Example 4.
The heat map for Example 1 shows that when students looked at the database schema, they inspected most tables and their attributes. However, Example 1 is about the BOOK table, so we expected students to pay more attention to that table and its attributes. Example 6 shows the opposite eye-gaze behaviour. This example is about the BOOK and PUBLISHER tables, and the heat map for Example 6 shows that students paid attention to the relevant areas in the database schema.
Figure 6. Heat maps for Example 1 (left) and Example 2 (right)
Overall, the heat maps show that students paid more attention to the AOIs in Example 1 than in the other examples. A simple reason is that students were not familiar with the environment; therefore, they tried to read all the information provided.
18
Figure 7. Heat maps for Example 3 (left) and Example 4 (right)
Figure 8. Heat maps for Example 5 (left) and Example 6 (right)
5.10. Gaze plots
Figures 9 and 10 show gaze patterns of a typical advanced student and a typical novice student on Example 1. The advanced student had a higher number of fixations. The figures show that the advanced student had a comprehensive look at different AOIs, while the novice student did not pay attention to the AOIs as much. The patterns clearly show that the advanced student read the problem statement and then studied the solution. From the
sequence of fixations, we can see that the advanced student looked at the database schema when s/he was reading the problem statement. The information in the database schema helps learners to comprehend worked examples. The advanced student examined all the tables and their attributes; this helped the student to identify the primary keys, foreign keys and all information necessary for the example. The fixation numbers show that the advanced student read the explanation last. The patterns for the novice student show that the student did not completely read the example, the explanation and the database schema. For instance, Example 1 is about the BOOK table, but the novice student did not fixate on any information about the BOOK table in the database schema.
Figure 9. Gaze pattern for an advanced student on Example 1
20
In Example 1, apart from studying examples, students also needed to become familiar with the interface. Figures 11 and 12 show gaze patterns for a typical advanced student and a typical novice student on Example 6. The advanced student paid comprehensive attention to the problem statement and the solution. Although the student did not pay attention to the explanation, s/he had paid attention to the related areas in the database schema (BOOK and PUBLISHER tables). On the contrary, the novice student only looked at the worked example AOI. S/he did not have any fixation on the other AOIs. Even when the novice student studied the worked example, s/he did not pay attention to the AOI of the worked example as much as the advanced student did. There are three possible explanations for the novice eye-gaze behaviour on Example 6. First, the novice had learnt the concept before, so did not need to restudy it. Second, the novice went over the worked example very quickly, although s/he had not learnt enough (illusion of understanding). Third, the student did not know how to study an example of an SQL query; however, the student might know that s/he did not learn enough from studying the worked example.
Figure 12. Gaze pattern for a novice student on Example 6
6. DISCUSSION
Our hypothesis that advanced students and novices study SQL examples differently was confirmed. First, we used the K-Medoids clustering algorithm to divide students into two groups (advanced and novices), based on the participants’ pre- and post-test scores from our previous study, and also learning time and self-explanation scores from the current study. We compared the time novices and advanced students spent studying examples and found there was no significant difference between the two groups. The analyses of the students’ eye gaze patterns show that advanced students used the D and ED patterns significantly and marginally significantly more often than the novices. The D pattern was used by 90% of advanced students compared to only 25% of novices. The ED pattern was not used by novices at all, while half of advanced students have used it. D represents database schema, and studying the database schema is required to comprehend SQL examples. This finding illustrates that advanced students were aware of the importance of the database schema. Behaviour B3 was sometimes used by advanced students, while novices never used this behaviour. B3 indicated that a student started from the worked example area, then read the explanation and finally looked at the database schema. The Machine Learning classifiers also corroborate the pattern analysis and show that advanced students studied the database schema more than novices. We extracted the eye-gaze movement metrics from the eye-tracker software. The results show that advanced students visited the Database AOI more often than novices. Advanced students also spent significantly more time on the database schema than novices.
We also reported the differences between novices and advanced students using heat map and gaze plots. The heat maps show that students paid more attention to the AOIs in Example 1 than in the other examples because students were not familiar with the environment.
22
Therefore, in Example 1, students tried to read all the information on the screen. Students also paid more attention to the database schema in Example 1 than in the other examples. The information in the database schema did not change during the study; thus students checked the schema less after Example 1. The gaze plots showed that typical advanced students and novices studied SQL examples differently.
The main goal of this study was to observe how novices and advanced students would study an SQL example. The analyses suggest that advanced students read SQL examples more strategically than novices. Advanced students inspected the database schema to understand examples. Checking the database schema is crucial for learners to understand SQL examples; therefore, advanced students clearly were one step ahead of novices.
We also found that behaviour B3 was exhibited by advanced students, while novices never used this eye-gaze behaviour. The main difference between novices and advanced students is in the amount of prior knowledge they have; as a consequence, it was possible that advanced students already know aspects that examples were intended to teach. In such situations, they searched for new information by scanning from the top to the bottom of the screen. Therefore, B3 might be a sign of already learnt material. Knowing such information allows us to prevent or manage expertise reversal effect perhaps by changing the complexity level of the next task.
7. CONCLUSION AND FUTURE WORK
The goal of this study was to analyse how novices and advanced students study SQL examples. We conducted our study using the example mode of SQL-Tutor and analysed the data from different perspectives.
Overall, the results emphasise the importance of the database schema for advanced students. In our study, students needed database information, such as names and semantics of tables and attributes, to understand examples. Therefore, looking at the database schema was a sign of learning from SQL examples. In contrast, the database schema is not vital to understand the explanations of examples. The question is, why did novices not pay attention to this crucial area (database schema)? Perhaps novices may not know the basic concepts of primary keys and foreign keys in a database. Therefore, it is interesting to investigate whether or not prompting novices to study database schema while they study examples would improve students’ learning.
It is evident that novices and advanced students use different approaches for studying SQL examples. Such information allows ITSs to be proactive, rather than reactive, to users’ actions (Gertner & VanLehn, 2000). Although analysing existing logs of students’ interactions with a system can provide some of this information; Bednarik (2005) highlighted the potential for using eye-movement tracking as a source of real-time adaptation.
The presented results suggest new research topics to improve the design of examples. An interesting research question is how to design worked examples to indicate the procedure of studying different AOIs. In this study, we assumed that advanced students follow more rational behaviours, but would it be possible to further improve behaviour that advanced
students use?
In future work, we plan to conduct a study to see whether or not drawing students’ attention to the database schema will improve their learning. We hypothesise that novices will learn more from examples with such adaptive guidance. The adaptive guidance is aimed to draw students’ attention to areas that are required to comprehend an SQL example. The optimal goal of such model is to provide guidance based on students’ eye-gaze behaviour. For instance, if the student’s behaviour shows that the student does not know the purpose of the FROM clause (perhaps by having a very long fixation on the FROM clause), the system could then provide an explanation.
In a more advanced adaptive model, a system can provide adaptive explanation once eye-gaze behaviour shows that the student is lacking knowledge. Further research is required to observe what behaviour or patterns provide such information. The adaptive model is useful in making interactive examples (Brusilovsky & Yudelson, 2008); for instance, an educational system can provide an adaptive amount of information to the student, depending on how s/he studies an example. Therefore, the system avoids expertise reversal effect which is a drawback to example-based learning strategies (Salden, Aleven, Schwonke, & Renkl, 2009). One of the limitations of our study is the small sample size. We plan to conduct larger studies, and also studies in areas other than SQL. Furthermore, all the analyses performed were based on data captured over the whole session; therefore, the results may change when using data from a fragment of a session. It would also be interesting to observe how patterns and behaviours change as students become more knowledgeable.
REFERENCES
Amershi, S., Conati, C. (2007). Unsupervised and supervised machine learning in user modeling for intelligent learning environments. In Proc.12th Int. Conf. on Intelligent user interfaces (pp. 72–81). Honolulu, Hawaii, USA: ACM.
Amershi, S., Conati, C. (2009). Combining Unsupervised and Supervised Classification to Build User Models for Exploratory Learning Environments. Educational Data Mining, 1(1), 18–71.
Bednarik, R. (2005). Potentials of eye-movement tracking in adaptive systems. In Proc. 4th Workshop on the Evaluation of Adaptive Systems (pp. 1–8).
Bojko, A. (2009). Informative or misleading? heatmaps deconstructed. Human-Computer Interaction. New Trends, 30–39.
Brusilovsky, P., Yudelson, M. V. (2008). From WebEx to NavEx: Interactive Access to Annotated Program Examples. Proceedings of the IEEE, 96(6), 990–999. doi:10.1109/JPROC.2008.921611
Bull, S., Cooke, N., Mabbott, A. (2007). Visual attention in open learner model presentations: An eye-tracking investigation. In C. Conati, K. McCoy, & G. Paliouras (Eds.), Proc. Int. Conf. on User Modeling (pp. 187–196). Springer.
Bunt, A., Conati, C., Huggett, M., Muldner, K. (2001). On improving the effectiveness of open learning environments through tailored support for exploration. In Proc.10th Int. Conf. on Artificial Intelligence in Education (pp. 365–376). San Antonio, Texas.
Chi, M., De Leeuw, N., Chiu, M. H., LaVancher, C. (1994). Eliciting self-explanations improves understanding. Cognitive Science, 18(3), 439–477.
Chi, M. T. H., Bassok, M., Lewis, M. W., Reimann, P., Glaser, R. (1989). Self-explanations: How students study and use examples in learning to solve problems. Cognitive Science, 13(2), 145–182.
Conati, C., Merten, C. (2007). Eye-tracking for user modeling in exploratory learning environments: An empirical evaluation. Knowledge-Based Systems, 20(6), 557–574.
24
Conati, C., Merten, C., Muldner, K., Ternes, D. (2005). Exploring eye tracking to increase bandwidth in user modeling. In L. Ardissono, P. Brna, & A. Mitrovic (Eds.), Proc. 10th Int. Conf. User Modeling (Vol. 3538, pp. 357–366). Edinburgh, Scotland, UK: Springer Berlin Heidelberg.
Duchowski, A. (2007). Eye tracking methodology: Theory and practice (Vol. 373). Springer. Duda, R. O., Hart, P. E., Stork, D. G. (2012). Pattern classification. John Wiley & Sons.
Elmadani, M., Mitrovic, A., Weerasinghe, A. (2013). Understanding Student Interactions with Tutorial Dialogues in EER-Tutor. In L. H. Wong, C.-C. Liu, T. Hirashima, P. Sumedi, & M. Lukman (Eds.), Proc. 21st Int. Conf. on Computers in Education (pp. 30–40). Bali: Asia-Pacific Society for Computers in Education.
Gertner, A. S., VanLehn, K. (2000). Andes: A coached problem solving environment for physics. In G. Gauthier, C. Frasson, & K. VanLehn (Eds.), Proc. Int. Conf. on Intelligent Tutoring Systems (Vol. 1839, pp. 133–142). Montreal, Canada: Springer Berlin Heidelberg.
Gluck, K. A., Anderson, J. R., Douglass, S. A. (2000). Broader Bandwidth in Student Modeling: What if ITS Were “Eye” TS? In G. Gauthier, C. Frasson, & K. VanLehn (Eds.), Proceedings of Int. Conf. on Intelligent Tutoring Systems (Vol. 1839, pp. 504–513). Montreal, Canada: Springer Berlin Heidelberg. Goldberg, J. H., Helfman, J. I. (2010). Comparing information graphics: a critical look at eye tracking. In Proc.
3rd BELIV’10 Workshop: Beyond time and errors: novel evaluation methods for Information Visualization (pp. 71–78).
Hall, M., Frank, E., Holmes, G., Pfahringer, B., Reutemann, P., Witten, I. H. (2009). The WEKA data mining software: an update. ACM SIGKDD Explorations Newsletter, 11(1), 10–18.
Jarodzka, H., van Gog, T., Dorr, M., Scheiter, K., Gerjets, P. (2013). Learning to see: Guiding students’ attention via a Model's eye movements fosters learning. Learning and Instruction, 25, 62–70.
Kardan, S., Conati, C. (2011). A Framework for Capturing Distinguishing User Interaction Behaviors in Novel Interfaces. In M. Pechenizkiy, T. Calders, C. Conati, S. Ventura, C. Romero, & J. C. Stamper (Eds.), Proc. 10th Int. Conf on Educational Data Mining (pp. 159–168).
Kardan, S., Conati, C. (2012). Exploring gaze data for determining user learning with an interactive simulation. In J. Masthoff, B. Mobasher, M. Desmarais, & R. Nkambou (Eds.), Proc. Int. Conf. User Modeling, Adaptation, and Personalization (pp. 126–138). Montreal, Canada.
Kardan, S., Conati, C. (2013). Comparing and Combining Eye Gaze and Interface Actions for Determining User Learning with an Interactive Simulation. In S. Carberry, S. Weibelzahl, A. Micarelli, & G. Semeraro (Eds.), Proc. Int. Conf. User Modeling, Adaptation, and Personalization (pp. 215–227). Rome, Italy: Springer.
Kardan, S., FitzGerald, N., Conati, C. (2012). Eye Movement Data Analysis Toolkit (EMDAT) User Manual. University of British Columbia.
Kaufman, L., Rousseeuw, P. (1987). Clustering by means of Medoids. In Y. Dodge (Ed.), Statistical Data Analysis Based on the L_1–Norm and Related Methods (pp. 405–416). North-Holland, Amsterdam. Kim, R. S., Weitz, R., Heffernan, N. T., Krach, N. (2007). Tutored Problem Solving vs. “Pure” Worked
Examples. In Proc. 31st Annual Conf. of the Cognitive Science Society. Austin, TX: Cognitive Science Society (pp. 3121–3126).
Koedinger, K., Aleven, V. (2007). Exploring the Assistance Dilemma in Experiments with Cognitive Tutors. Educational Psychology Review, 19(3), 239–264.
Koedinger, K. R., Anderson, J. R. (1993). Effective use of intelligent software in high school math classrooms. In Proc. Int. Conf. on Artificial Intelligence in Education (pp. 241–248). Charlottesville, VA: Association for the Advancement of Computing in Education.
Koedinger, K. R., Anderson, J. R. (1998). Illustrating principled design: The early evolution of a cognitive tutor for algebra symbolization. Interactive Learning Environments, 5(1), 161–179.
Litchfield, D., Ball, L. J., Donovan, T., Manning, D. J., Crawford, T. (2010). Viewing another person’s eye movements improves identification of pulmonary nodules in chest x-ray inspection. Experimental Psychology: Applied, 16(3), 251–262.
Loboda, T. D., Brusilovsky, P. (2010). User-adaptive explanatory program visualization: evaluation and insights from eye movements. User Modeling and User-Adapted Interaction, 20(3), 191–226.
Mathews, M., Mitrovic, A., Lin, B., Holland, J., Churcher, N. (2012). Do your eyes give it away? Using eye tracking data to understand students’ attitudes towards open student model representations. In S. Cerri, W.
Clancey, G. Papadourakis, & K. Panourgia (Eds.), Proc.11th Int. Conf. on Intelligent Tutoring Systems (pp. 422–427). Chania, Greece: Springer Berlin Heidelberg.
Mayer, R. E. (2002). Multimedia Learning (second.). New York, NY, USA: Cambridge University Press. McLaren, B., Isotani, S. (2011). When Is It Best to Learn with All Worked Examples? In G. Biswas, S. Bull, J.
Kay, & A. Mitrovic (Eds.), Proc. 15th Int. Conf. on Artificial Intelligence in Education (pp. 222–229). Springer Berlin / Heidelberg.
Mitrovic, A. (1998). Experiences in implementing constraint-based modeling in SQL-Tutor. In B. Goettl, H. Halff, C. Redfield, & V. Shute (Eds.), Proc. Int. Conf. on Intelligent Tutoring Systems (pp. 414–423). Mitrovic, A. (2003). An Intelligent SQL Tutor on the Web. Artificial Intelligence in Education, 13(2-4), 173–
197.
Rayner, K. (1995). Eye movements and cognitive processes in reading, visual search, and scene perception. Studies in Visual Information Processing, 6, 3–22.
Rayner, K. (1998). Eye movements in reading and information processing: 20 years of research. Psychological Bulletin, 124(3), 372–422.
Rourke, A., Sweller, J. (2009). The worked-example effect using ill-defined problems: Learning to recognise designers’ styles. Learning and Instruction, 19(2), 185–199.
Salden, R. J. C. M., Aleven, V., Schwonke, R., Renkl, A. (2009). The expertise reversal effect and worked examples in tutored problem solving. Instructional Science, 38(3), 289–307.
San Agustin, J., Skovsgaard, H., Mollenbach, E., Barret, M., Tall, M., Hansen, D. W., Hansen, J. P. (2010). Evaluation of a low-cost open-source gaze tracker. In Proc. Symposium on Eye-Tracking Research & Applications (pp. 77–80). Austin, Texas: ACM.
Schwonke, R., Ertelt, A., Otieno, C., Renkl, A., Aleven, V., Salden, R. J. C. M. (2013). Metacognitive support promotes an effective use of instructional resources in intelligent tutoring. Learning and Instruction, 23, 136–150.
Schwonke, R., Renkl, A., Krieg, C., Wittwer, J., Aleven, V., Salden, R. (2009). The worked-example effect: Not an artefact of lousy control conditions. Computers in Human Behavior, 25, 258–266.
Shareghi Najar, A., & Mitrovic, A. (2013a). Do novices and advanced students benefit differently from worked examples and ITS? In L. H. Wong, C.-C. Liu, T. Hirashima, P. Sumedi, & M. Lukman (Eds.), Proc. 21st
Int. Conf. on Computers in Education (pp. 20–29). Indonesia, Bali: Asia-Pacific Society for Computers in
Education.
Shareghi Najar, A., & Mitrovic, A. (2013b). Examples and Tutored Problems: How can Self-Explanation Make a Difference to Learning? In H. C. Lane, K. Yacef, J. Mostow, & P. Pavlik (Eds.), Proceedings of 16th
Int. Conf. on Artificial Intelligence in Education (Vol. 7926, pp. 339–348). Memphis, USA: Springer,
Heidelberg.
Shareghi Najar, A., Mitrovic, A., & Neshatian, K. (2014). Utilizing Eye Tracking to Improve Learning from Examples. In Universal Access in Human-Computer Interaction. Universal Access to Information and Knowledge (pp. 410-418). Springer International Publishing.
Sibert, J. L., Gokturk, M., Lavine, R. A. (2000). The reading assistant: eye gaze triggered auditory prompting for reading remediation. In Proceedings of the 13th annual ACM symposium on User interface software and technology (pp. 101–107). ACM Press.
Steichen, B., Schmid, O., Conati, C., Carenini, G. (2013). Seeing how you’re looking-Using Real-Time Eye Gaze Data for User-Adaptive Visualization. In Proc. 21st Int. Conf. on User Modeling, Adaptation and Personalization. Girona, Spain.
Sweller, J. (2006). The worked example effect and human cognition. Learning and Instruction, 16(2), 165–169. Tobii Technology. Tobii TX300 eye tracker product description, 2010, (2010).
Tsai, M.-J., Hou, H.-T., Lai, M.-L., Liu, W.-Y., Yang, F.-Y. (2012). Visual attention for solving multiple-choice science problem: An eye-tracking analysis. Computers & Education, 58(1), 375–385.
Van Gog, T., Jarodzka, H., Scheiter, K., Gerjets, P., Paas, F. (2009). Attention guidance during example study via the model’s eye movements. Computers in Human Behavior, 25(3), 785–791.
Van Gog, T., Rummel, N. (2010). Example-Based Learning: Integrating Cognitive and Social-Cognitive Research Perspectives. Educational Psychology Review, 22(2), 155–174.
Wang, H., Chignell, M., Ishizuka, M. (2006). Empathic tutoring software agents using real-time eye tracking. In Proc. Int. Conf. on Eye tracking research & applications (pp. 73–78).
26
Woolf, B. P. (2010). Building intelligent interactive tutors: Student-centered strategies for revolutionizing e-learning. Morgan Kaufmann.
Zakharov, K., Mitrovic, A., Ohlsson, S. (2005). Feedback micro-engineering in EER-Tutor. In Proc. Int. Conf. on Artificial Intelligence in Education (pp. 718–725). Amsterdam, The Netherlands.