ContentslistsavailableatScienceDirect
Energy
and
AI
journalhomepage:www.elsevier.com/locate/egyai
Genetic
algorithm-determined
deep
feedforward
neural
network
architecture
for
predicting
electricity
consumption
in
real
buildings
X.J.
Luo
a,
Lukumon
O.
Oyedele
a ,∗,
Anuoluwapo
O.
Ajayi
a,
Olugbenga
O.
Akinade
a,
Juan
Manuel
Davila
Delgado
a,
Hakeem
A.
Owolabi
a,
Ashraf
Ahmed
baBigDataEnterpriseandArtificialIntelligenceLaboratory(Big-DEAL),UniversityoftheWestofEngland(UWE),FrenchayCampus,Bristol,UnitedKingdom bDepartmentofCivilandEnvironmentalEngineering,BrunelUniversityLondon,London,UnitedKindom
h
i
g
h
l
i
g
h
t
s
g
r
a
p
h
i
c
a
l
a
b
s
t
r
a
c
t
•A GA-determined DFNN architecture forreal building electricity consumption. •Genetic algorithm to determine the op-
timal architecture of DFNN model. •Both day-ahead hourly and week-ahead
daily electricity consumption are consid- ered.
•One year and six months of measure- ment data from a real campus building is used for training and testing the pro- posed GA-DFNN model.
•The proposed model has better perfor- mance than ANN, LSTM and TCN.
a
r
t
i
c
l
e
i
n
f
o
Articlehistory: Received 30 April 2020
Received in revised form 16 June 2020 Accepted 30 June 2020
Available online 7 July 2020 Keywords:
Prediction Deep learning
Feedforward neural network Genetic algorithm Electricity consumption
a
b
s
t
r
a
c
t
A genetic algorithm-determined deep feedforward neural network architecture (GA-DFNN) is proposed for both day-ahead hourly and week-ahead daily electricity consumption of a real-world campus building in the United Kingdom. Due to the comprehensive relationship between affecting factors and real-world building electricity consumption, the adoption of multiple hidden layers in the deep neural network (DFNN) algorithm would improve its prediction accuracy. The architecture of a DFNN model mainly refers to its quantity of hidden layers, quantity of neurons in the hidden layers, activation function in each layer and learning process to obtain the connecting weights. The optimal architecture of DFNN model was generally determined through a trial-and-error process, which is an exponential combinatorial problem and a tedious task. To address this problem, genetic algorithm (GA) is adopted to automatically design an optimal architecture with improved generalization ability. One year and six months of measurement data from a campus building is used for training and testing the proposed GA- DFNN model, respectively. To demonstrate the effectiveness of the proposed GA-DFNN prediction model, its prediction performance, including mean absolute percentage error, coefficient of determination, root mean square error and mean absolute error, was compared to the reference feedforward neural network models with single hidden layer, DFNN models with other architecture, random search determined DFNN model, long-short-term- memory model and temporal convolutional network model. The comparison results show that the proposed GA-DFNN predictive model has superior performance than all the reference prediction models, demonstrating the optimization effectiveness of GA and the prediction effectiveness of DFNN model with multiple hidden layers and optimal architecture.
∗Corresponding author.
E-mailaddresses:[email protected](X.J. Luo)., [email protected], [email protected](L.O. Oyedele).. https://doi.org/10.1016/j.egyai.2020.100015
2666-5468/© 2020 The Author(s). Published by Elsevier Ltd. This is an open access article under the CC BY-NC-ND license. ( http://creativecommons.org/licenses/by-nc-nd/4.0/)
Nomenclature
d Dayoftheweek
E Electricityconsumption
f Activationfunction
h Houroftheday
m Monthoftheyear
MAPE Meanabsolutepercentageerror
MPE Meanpercentageerror
n Quantityofhiddenlayer
N Quantity
R2 Coefficientofdetermination RMSE Rootmeansquareerror
T Totaltrainingsamplesortemperature
W Setofweightingfactors
x Neuronintheinputlayer
X Inputdataset
Y Neuroninthehiddenlayer
z Neuronintheoutputlayer ̂
𝑍 EstimatedoutputthroughtheDFNNmodel
Z Outputdataset
Subscripts
d Daily
db Dry-bulb
dew Dew-point
i Numberofneuronsintheinputlayer
j Numberofneuronsinthehiddenlayer
k Numberofhiddenlayers
h Hourly
H Hiddenlayer
IN Inputlayer
O Outputlayer
t Numberofsamples,i.e.timestep
Abbreviations
ADAM Adaptivemomentestimation ANN Artificialneuronnetwork elu Exponentiallinearfunction DFNN Deepfeedforwardneuralnetwork FNN Feedforwardneuralnetwork
GA Geneticalgorithm
GA-DFNN Geneticalgorithmdetermineddeepfeedforward neu-ralnetworkarchitecture
LSTM Long-term-short-memory
NADAM Nesterov-acceleratedAdaptiveMomentEstimation PSO Particleswarmoptimization
relu Rectifiedlinearunitfunction SGD Stochasticgradientdescentapproach TCN Temporalconvolutionalnetworks
1. Introduction
Therapideconomicandpopulationgrowthareacceleratingthe con-sumptionofelectricalenergy[1] .AsindicatedbyWorldEnergyOutlook 2017,theprimaryenergyconsumptionallovertheworldwasprojected togrowatacompoundannualgrowthrateof1.0%over2016–2040 [2] .Duetoitsphysicalcharacteristics,electricalenergymustbe con-sumedassoonasitisgeneratedinthepowerplant.Therefore,accurate predictionofelectricitydemandisessentialforstablepowersupply.On theotherhand,duetothefactthatpeoplespendasubstantialfraction oftimeinbuildings,electricityconsumptioninbuildingsisincreasing rapidly[3 ,4] .Asaresult,itisofsignificantimportancetoaccurately predictelectricityconsumptionandfacilitatethebuildingenergy sys-temmanagement.
1.1. Literaturereview
Withtheadventoftheeraofbigdata,buildingshavebecomenot onlyenergy-intensivebutalsodata-intensive.Data-miningtechnologies havebeenwidelyutilisedtoinvestigatethevaluesofmassiveamounts ofbuildingoperationdatawiththeaimofimprovingtheoperating per-formanceofbuildingenergysystems[5] .Asrevealedbythereview pa-pers[6–9] ,variousartificialintelligencetechniqueshavebeenapplied inforecastingbuildingenergyconsumption,includingmultiplelinear regression,statisticalregression,decisiontree,autoregressiveintegrated movingaveragemodel,supportvectorregression,neuralnetworkand theirensemblemodels.Duetoitsabilitytoapproximatethecomplicated nonlinearrelationshipbetweentheinputandtheoutputdatasetsofa complicatedsystemwitharbitraryandprecision,neuralnetworkshave beenwidelyadoptedtoinvestigatetheperformanceofbuildingenergy. Theneuralnetworkmodelsmainlyincludefeedforwardneural net-work(FNN),convolutionneuralnetworkandrecurrentneuralnetwork. TheFNNwithsinglehiddenlayeristhemostpopulartypeofneural networks inbuildingenergyanalysis.Luoetal.[10 ,11] proposed an FNNpredictionmodelforbuildingheatingandcoolingdemands.The quantityofneuronsinthehiddenlayerwaschosenthroughsensitivity analysisintherangeof60–80whilerectifiedlinearunitwasadoptedas theactivationfunctioninboththehiddenandoutputlayer.Singhetal. [12] proposedanFNNpredictivemodelwithsinglehiddenlayerfor electricityconsumptioninurbanarea.Inthehiddenlayer,therewere20 neuronswhilethesigmoidactivationfunctionwasadopted.Menaetal. [13] proposedtwoFNNpredictivemodelsforelectricityconsumption predictioninabioclimaticbuilding.Thequantityofneuronsintheinput andhiddenlayerwas17and10inthecompleteFNNmodel,while6and 15intheparticularFNNmodel.Thehyperbolictangentwasadoptedas activationfunctioninbothFNNmodels.Kusiaketal.[14] evaluated theperformanceof anFNNpredictivemodelforbuildingsteamload predictionwithdifferentarchitecture.Thequantityof neuronsin the singlehiddenlayerwastestedintherangebetween4and9.Asfor acti-vationfunctions,logistic,hyperbolictangentandexponentialfunctions weretestedinthehiddenlayerwhilesine,identityandlogistic func-tionsweretestedattheoutputlayer,respectively.Debetal.[15] pro-posedaneuralnetworkpredictivemodelforcoolingenergy consump-tionin aninstitutional buildingusingthefeedforwardstructure.The optimalquantityofneuronsinthehiddenlayer,20,wasdetermined throughatrial-and-errorprocess.Thesigmoidactivationfunctionwas adoptedinboththehiddenandoutputlayers.Ahmadetal.[16] pro-posedthreeFNNpredictivemodelsusingthemultiplelinearregression, GaussianprocessregressionandLevenberg–Marquardtbackpropagation approach,respectively.TherewasonlyonehiddenlayerineachANN model,whilethedifferentquantitiesofneuronsinthehiddenlayerwere testedat10,15and20.Yangetal.[17] proposedanFNNmodelfor en-ergyconsumptionpredictioninanofficebuildinginCanada.The quan-tityofneuronsinthehiddenlayerwasdeterminedusingtheempirical equationin[18] ,whichisonemorethantwicethequantityofinput neurons.Sigmoidandlinearactivationfunctionwasadoptedinthe hid-denandoutputlayer,respectively.Wangetal.[19] proposedanFNN modelforcoolingloadinahigh-riseofficebuildinginHongKong.The quantityofneuronsinthehiddenlayerwasdecidedthroughthe em-piricalequationin[20] ,whichisthetotalvalueofquantityof input andoutputneuronsandthesquarerootoftrainingsamples.Hyperbolic tangentandlinearactivationfunctionwereadoptedinthehiddenand outputlayer,respectively.Bagnascoetal.[21] proposedanFNNmodel forpredictingelectricityconsumptioninahospitalbuilding.Tofindout theoptimalquantityofneuronsinthehiddenlayer,itwastestedinthe rangeof6–33,whilethebestvaluewasfoundtobe10and30intwo differentcases.Moreover,differentactivationfunctionsweretestedin thehiddenandoutputlayers,withthecombinationof logsig/tansig, tansig/purelin,logsig/purelinandtansig/tansig.Thetansigactivation functionwasfoundtobeoptimalinboththehiddenandoutputlayers. Muhammadetal.[22] comparedthepredictionperformancebetween
anFNNandarandomforestmodelforenergyconsumptionofair con-ditioningsysteminahotel.SensitivityanalysisoftheFNNmodelwas conductedfordifferentquantityofneuronsinthehiddenlayerinthe rangeof10–15.Meanwhile,sigmoidactivationfunctionwasadoptedin bothhiddenandoutputlayers.
Intheabove-mentionedFNNpredictivemodelswithsinglehidden layer,Levenberg–Marquardt backpropagationwas adopted toobtain theweighting factorsin most of thestudies. Toachieve faster con-vergenceandhigherefficiency,evolutionaryoptimizationalgorithms, suchasteaching-learningalgorithm[23] ,particleswarmoptimization (PSO)[24–26] andgeneticalgorithm(GA)[26] ,wereadoptedto au-tomaticallyadjustweightingfactorsandthresholdvaluesofFNN mod-els.Lietal.[23] proposed aFNNpredictive modelforbuilding en-ergyconsumptionandadopteditintwocampusbuildingslocatedin theUSAandChina,respectively.Thequantityofneuronsinthe hid-denlayerwasfixedat20whilehyperbolictangentactivationfunction wasadoptedinboththehiddenandoutputlayers.Toevaluatethe ef-fectsofchannellength,depth,widthandairmassflowrateonenergetic performanceofabuildingintegratedphotovoltaic/thermalsystem, Al-naqietal.[24] proposedaFNNmodel.SensitivityanalysisoftheFNN modelwasconductedfordifferentquantityofneuronsin thehidden layerwithintherangeof1–8,while8wasfoundtobetheoptimalone. Hyperbolictangentandsigmoidactivationfunctionweretestedinboth thehiddenandoutputlayers,respectively.PSOwasadoptedtoadjust theweightingfactorsintheFNNtoaccelerateitsconvergence.Lietal. [25] proposedaFNNmodelforpredictingelectricityconsumptionin alibraryinEastChina.Thequantityofneuronswaschosenbasedon theempiricalequationwhilehyperbolictangentsigmoidwasadopted inthehiddenandoutputlayersasactivationfunction.Particleswarm optimizationwasadoptedtosearchfortheoptimalweightingfactors inFNN.Muralitharanetal.[26] proposedaFNNapproachtopredict energydemandattheconsumerend.TheweightingfactorsoftheFNN wereautomaticallyadjustedbyGA.
Deepfeedforwardneuralnetworkmodels(DFNN)havedeeper archi-tectures,whichenabletheinputdatabeingtransformedmultipletimes beforederivingtheoutput.Owingtoitsmultiplehiddenlayers,DFNN is moreappropriatefor comprehensivedata [27 ,28] . Marijana etal. [29] adoptedtheDFNNmodelswithdifferentarchitectureforenergy consumptionpredictioninpublicbuildings.Thearchitectureincluded 2hiddenlayerswiththecombinationof75–59,71–87,57–63,aswellas 3hiddenlayerswiththecombinationof87–99–94,14–31–28and61– 70–69.Sigmoidfunctionwasadoptedastheactivationfunctionwhile adaptivemomentestimationoptimizationalgorithmwasadoptedto ob-taintheweightingfactors.Bendaetal.[30] proposedaDFNNmodelfor predictingelectricityconsumptioninCapeTownControlcenter.There weretwodifferentarchitectureofDFNNmodelwithtwohiddenlayers, onewiththecombinationof56–15,andtheotherwith58–20.Torres etal.[31] proposedaDFNNpredictionmodelforelectricity consump-tioninSpain.Randomsearchwasadoptedtotunethehyper-parameters, includingthequantityof hiddenlayers,quantity ofneurons ineach hiddenlayerandthelearningrate.Thequantityofhiddenlayerswas searchedintherangeof1–5whilethequantityofneuronsinthehidden layerintherangeof10–100.Parketal.[32] proposedaDFNNmodelfor predictingenergyproductionofagroundsourceheatpump.Througha trial-and-errorprocess,thearchitectureoftheDFNNmodelwas deter-minedtobe10–5–2.Hyperbolictangentandlinearactivationfunction wereadoptedinthehiddenandoutputlayer,respectively. Lu etal. [33] proposedaDFNN-basedpredictivemodelforpriceandload fore-castinginthesmartgrid.Throughseveralaccuracytests,theselected DFNNmodelhadthreehiddenlayers,with30,20and10neuronsin eachlayer.Sigmoidfunctionservedastheactivationfunctionforeach layer,whileweightandbiasadjustmentineachlayerwastrainedby Levenberg–Marquardtbackpropagationalgorithm.
Theresultsfromtheabove-mentionedresearchworksindicatedthat theDFNN-basedpredictivemodelhadhigherpredictionaccuracythan theconventionalFNNmodelswithsinglehiddenlayer.However,the
optimalDFNNarchitectureiscontingentonthetypeofproblemtobe solved,suchasthequantityoftrainingsamplesaswellasthequantityof inputandoutputneurons.Asaresult,thefullabilityoftheDFNN-based predictivemodelshouldbeexploitedbyoptimizingitsarchitecture. Al-thoughthearchitectureoftheDFNNmodelswasdesignedbyheuristic trial-and-errorapproachesinsomeofthepreviousresearchworks[31– 33] ,itistime-consumingandmightreachthelocal-optimalarchitecture ofDFNN.
1.2. Researchgapandcontribution
Basedupontheliteraturereview,itisfoundthattheprevious re-searchworksinbuildingenergypredictionhavethefollowing limita-tions:
• IntheFNNmodelswithsinglehiddenlayer,thequantityof neu-ronsinthehiddenlayerwaschosenbyexperience[12 ,13 ,23] ,using different empiricalequations[17 ,19 ,25] ,through sensitivitytests [10 ,11 ,14 ,16 ,21 ,22] and[24] orviatrial-and-errorprocess[15] . Al-thoughsomeevolutionaryalgorithmswerehybridwithFNNmodels toimprovethepredictionaccuracyandspeedupthecomputation convergence,theyweremainlyfocusingonautomaticallyadjusting theweightingfactors.
• TheDFNNmodelswithmultiplehiddenlayerswouldbeableto re-vealamorecomprehensiverelationshipamongdatasets.However, thearchitectureoftheDFNNmodelwouldbecomemorecomplex withtheincreaseofhiddenlayers.Thereisnoempiricalequations orrule-of-thumbtoselectthequantityofhiddenlayers,quantityof neuronsineachlayer,activationfunctionineachlayeraswellas learningprocessforweightingfactors.However,whenthequantity ofhiddenlayersistoosmall,thenetworkcouldresultinunder-fitting andlargepredictionerrors.Whereas,ifthequantityofhiddenlayers istoolarge,thenetworkmightlearnthenoiseinthetrainingdataset andresultinoverfitting.
• InpreviousresearchonDFNNmodels,thequantityofhidden lay-ersandthequantityofneuronsineachhiddenlayerwereselected basedonexperience[29 ,30] ortrial-and-errorprocessthrough enu-meration[31–33] ,whichmightnotbeabletoachievetheoptimal performanceorcauseexpensivecomputationload.Moreover,the authorsdidnotmentiontheapproachorcriteriainselectingthe ac-tivationfunctionsandlearningprocess.
Therefore,theobjectivesofthisstudyaresummarizedasfollows: • Duetothecomplex affectingfactorsandbuildingelectricity
con-sumption,theDFNNmodelwithmultiplehiddenlayersisadopted toconstructthepredictivemodeltoimprovetheforecasting accu-racyinbuildingelectricityconsumption;
• Toguaranteetheeffectiveness oftheDFNNmodel, GA optimiza-tionisutilisedtodetermineitsoptimalarchitecture,includingthe quantityofhiddenlayers,quantityofneuronsinthehiddenlayers, activationfunctioninboththehiddenandoutputlayeraswellas thelearningprocessfordeterminingweightingfactors;
• Tofacilitate buildingenergymanagement,bothday-aheadhourly and week-ahead daily electrical energy consumption are fore-castedbytheproposedGA-determinedDFNN(GA-DFNN)prediction model.
Therestofthispaperisorganizedasfollows.Section 2 elucidatesthe proposed GA-DFNNpredictivemodel.Section 3 illustratesthe prepa-rationofthehistoricaldatabase.Section 4 discussestheperformance of GAoptimization andtheoptimalarchitectureof DFNNpredictive model.Section 5 presentstheperformancecomparisonagainstvarious referencepredictionmodels.Section 6 clarifiesthepracticalimplication andfutureapplication,whileSection7summarizestheconclusions.
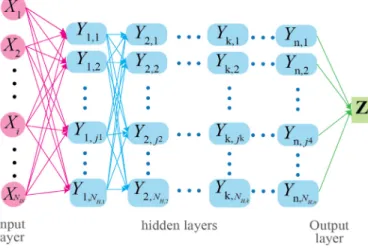
Fig.1. Diagram of DFNN model.
2. Geneticalgorithm-determineddeepneuronnetwork architecture
Toimprovethepredictionaccuracyofbuildingelectricity consump-tion,theGA-DFNNpredictionmodelisproposedinthisstudy.Tobe morespecific,theGAiscollaborativelyhybridwiththeDFNNalgorithm inordertofigureouttheoptimalDFNNarchitecture.
2.1. BrieftheoryoftheDFNN
TheDFNNisamathematicalmodelwhichwasdesignedby mimick-ingthewaythehumanbrainprocessesinformation.TheDFNNmodels aregenerallycomprisedofthreeprincipallayers:aninputlayer,several hiddenlayersandanoutletlayer.Thequantityofhiddenlayersdefines thedepthofthearchitecture.Withlargequantityofhiddenlayersand quantityofneuronsineachhiddenlayer,DFNNcanprovidea multi-levelrepresentationofdataset.ThediagramofageneralDFNNmodel ispresentedinFig. 1 .
2.1.1. DFNNalgorithm
The training database is obtained through the historical data, containing bothinput dataset𝐗={𝑋𝑖|𝑖=1, 2,…,𝑁𝐼𝑁} andoutput dataset𝐙={𝑍𝑡|𝑡=1,2,…, 𝑇}.ThetotaltypesofinputvariablesisNIN, whilethetotaltrainingsamplesisT.Foreachtypeofinputvariables,Xi containsTtimesamples,and𝑋𝑖={𝑥𝑖,𝑡|𝑡=1,2,…,𝑇}.Therearen hid-denlayersandNH,kneuronsinthekthhiddenlayer.Therefore,forthetth (𝑡=1,2,…, 𝑇)trainingsample,the𝑗1 𝑡ℎ(𝑗1 |𝑗1 =1, 2,…,𝑁𝐻,1 )neuron inthefirsthiddenlayercanbecalculatedas:
𝑌1 ,𝑗1=𝑓 (𝑖= 𝑁 𝐼𝑁 ∑ 𝑖=1 ( 𝑊𝐼𝑁,𝑖,1 ,𝑗1𝑋𝑖 )) (1) whilethe𝑗𝑡ℎ
𝑘 neuroninthekth(n≥k≥2)hiddenlayercanbeobtained as: 𝑌𝑘,𝑗𝑘=𝑓 ⎛ ⎜ ⎜ ⎝ 𝑗𝑘−1=∑𝑁𝐻,𝑘−1 𝑗𝑘−1=1 ( 𝑊𝑘−1 ,𝑗𝑘−1,𝑘,𝑗𝑘𝑌𝑘−1 ,𝑗𝑘−1 )⎞ ⎟ ⎟ ⎠ (2)
Theneuronzintheoutputlayerisdeterminedas:
𝐙=𝑓 ⎛ ⎜ ⎜ ⎝ 𝑗𝑛= ∑𝑁𝐻,𝑛 𝑗𝑛=1 ( 𝑊𝑛,𝑗𝑛,𝑂𝑌𝑛,𝑗𝑛 )⎞ ⎟ ⎟ ⎠ (3)
wherewistheconnectionweightingfactorsbetweenthetwoneurons,i
isthenumberofneuronsintheinputlayer,kisthenumberofhidden layers,jkisthenumberofneuronsinthekthhiddenlayer,andfisthe activationfunction.
2.1.2. Activationfunction
Toachievebetterpredictionperformance,fourdifferentactivation functions are tested,including sigmoid function, hyperbolic tangent (tanh)function,rectifiedlinearunit(relu)functionandexponential lin-ear(elu)function[34] .Thefouractivationfunctionscanbeexpressed asthefollows.
• sigmoidfunction: 𝑓(𝑥)= 1
1+𝑒− 𝑥 (4)
• hyperbolictangentfunction:
𝑓(𝑥)=tanh(𝑥) (5)
• rectifiedlinearunitfunction: 𝑓(𝑥)=
{
0𝑓𝑜𝑟𝑥<0
𝑥𝑓𝑜𝑟𝑥≥0 (6)
• exponentiallinearfunction: 𝑓(𝑥)=
{
𝑒𝑥−1𝑓𝑜𝑟𝑥<0
𝑥𝑓𝑜𝑟𝑥≥0 (7)
2.1.3. Learningapproach
The aim of the learning process of DFNN model is to minimize the mean absolute percentageerror MAPE between the produced ̂𝐙 and desired output Z by adjusting the group of weighting factors 𝑊 ={𝑊𝐼𝑁,𝑖,1 ,𝑗1|𝑁𝐼𝑁≥𝑖≥1,𝑁𝐻,1 ≥𝑗1 ≥1}∪ {𝑊𝑘−1 ,𝑗𝑘−1,𝑘,𝑗𝑘|𝑛≥𝑘≥ 2, 𝑁𝐻,𝑘−1≥𝑗𝑘≥1}∪ {𝑊𝑛,𝑗𝑛,𝑂|𝑁𝐻,𝑘≥𝑗𝑛≥1}.
Inthisstudy,sevendifferentoptimizationapproachesareadopted totraintheproposed DFNNmodel,includingstochasticgradient de-scent(SGD)[35] ,adaptivemomentestimation(ADAM)[36] , Nesterov-acceleratedadaptivemomentestimation(NADAM)[37] andavariant ofADAMbasedontheinfinitynorm(ADAMAX)[38] .
2.1.4. Performanceindicators
Toevaluatetheperformanceof theproposed model,four perfor-manceindicatorsaredefined,includingthemeanabsolutepercentage error,coefficientofdetermination,meanpercentageerroraswellasroot meansquareerror:
• Meanabsolutepercentageerror 𝑀𝐴𝑃𝐸= 1 𝑇 𝑡= 𝑇 ∑ 𝑡=1 ||𝑧𝑡−̂𝑧𝑡|| 𝑧𝑡 × 100% (8) • Coefficientofdetermination 𝑅2 = [ ∑𝑡=𝑇 𝑡=1 ( 𝑧𝑡− ∑𝑙=𝑇 𝑙=1𝑧𝑡 𝑇 ) ⋅ ( ̂𝑧𝑡− ∑𝑡=𝑇 𝑡=1̂𝑧𝑡 𝑇 )]2 ∑𝑡=𝑇 𝑡=1 ( 𝑧𝑡− ∑𝑡=𝑇 𝑡=1𝑧𝑡 𝑇 ) ⋅∑𝑡=𝐿 𝑡=1 ( ̂𝑧𝑡− ∑𝑡=𝑇 𝑡=1̂𝑧𝑡 𝑇 ) (9)
• Rootmeansquareerror
𝑅𝑀𝑆𝐸=
√∑
𝑡= 𝑇
𝑡=1 (𝑧𝑡−̂𝑧𝑡)2
𝑇 (10)
• Meanabsoluteerror 𝑀𝐴𝐸= 1 𝑇 𝑡=𝑇 ∑ 𝑡=1|| 𝑧𝑡−̂𝑧𝑡|| (11) 2.2. Geneticalgorithm
GAiscapable ofsearchingfortheglobaloptimumintheinfinite, complex,multimodal,andnon-differentiablesearchspacetodetermine theoptimalDFNNarchitecture[39 ,40] .Inthebeginning,apopulation ofchromosomesinthesolutionspaceisrandomlyinitialized.The qual-ityofeachchromosomeisassessedusingtheobjectivefunction;thus theprobabilityofadoptingeachoftheminthenextgenerationcanbe
Table1
Summary of architecture of FNN and DFNN in literature review.
References Quantity of neurons in input layer Quantity of neurons in hidden layers Quantity of neurons in output layer Training samples
[10] 9 60–80 1 8760 [11] 6 15or20 1 8760 [12] 5 20 1 26,280 [13] 17 10 1 700,000 6 15 [14] 2 4~9 1 722 [15] 5 20 1 250 [16] 5 10or15or20 1 8928 [17] 12 25 1 8760 [19] 8 36 1 742 [21] 8 10or30 1 7200 [22] 10 10 1 10,972 [23] 3 20 1 2472 [24] 4 1~8 1 20 [25] 3 11 1 2472 [29] 82 75–59,71–87,57–63 2 17,000 87–99–94,14–31–28and61–70–69 3 [30] 56 56–15 2 17,520 58 58–20 [31] 168 10~100 1~5 497,832 [32] 13 10–5–2 3 217,440 [41] 4 30–30 2 2700 [42] 7 512 3 19,704 [43] 4 12–12 2 279 [44] 784 500perlayer 9 600,000
determined.Generally,thenewchromosomeisgeneratedthroughthe threegeneticoperators:selection,crossoverandmutation.Basedonthe fitnessvaluesoftheobjectivefunction,somechromosomesareselected toremainwhile othersarechosenforcrossoverandmutation. Chro-mosomeswhichareselectedforthecrossoveroperationarenamedas theparents.Throughcrossoveroperation,featuresofparentsare ex-changedbetweeneachothertoproducetheoffspring.Meanwhile,the mutationoperatorimplementstheprocessofalteringthefeatureswithin thechromosome.Throughconductingthethreegeneticoperations,the initialpopulationisupdatedwiththeoffspringgeneratedbycrossover andmutation.Atthefinalstage,theoffspringwiththebestfitnessvalues isreturnedtorepresenttheoptimumsolution.
2.3. GA-DFNNpredictivemodel
Althoughtherearethreedifferentempiricalequationsin determin-ingtheoptimalquantityofneuronsinthesinglehiddenlayerofFNN, thereisno rule-of-thumbforchoosingthequantityof hiddenlayers, quantityofneuronsinthehiddenlayers,activationfunctionsineach layeraswellaslearningprocessfordeterminingweightingfactors. How-ever,thesearchitecturalattributesareresponsiblefortheperformance ofDFNN.Thenetworkwithasmallsizecancauseunder-fittingwhile alargenetworkmayleadtooverfitting.Theactivationfunction deter-minestheconnectingperformanceamongeachneuron,whilethe learn-ingprocessaffectstheconvergenceofDFNN.Theseimplythatthe ar-chitecturaldesignofDFNNmodelisverycrucialandcanbedefinedas anoptimizationproblem.
ToimprovethepredictionaccuracyofDFNNpredictivemodel,GAis appliedtodeterminetheoptimalarchitectureoftheDFNNmodel.The decisionvariablesofGAincludethetotalquantityofhiddenlayers,the quantityofneuronsineachhiddenlayer,theactivationfunctionaswell asthelearningprocesstocomputetheweightingfactorsoftheDFNN inthetrainingphase.TheoptimizationobjectivefunctionistheMAPE
valueoftheDFNNmodel.Inotherwords,eachsetofdecisionvariables determinesonetypeofarchitectureofDFNNmodel.Throughtraining theDFNNmodelsusinghistoricaldatasets,theMAPEvalueoftheDFNN model,namely,optimizationobjectivefunction,canbeobtained.
ThedecisionvariablesaresummarizedinTable 2 .Togeneratethe poolofdecisionvariablesregardingquantityofhiddenlayersand
quan-Table2
Decision variables of GA for DFNN.
Quantityofneuronsineachhiddenlayer {5,6,7,8,9,10} Quantityofhiddenlayers {2,3,4}
Activationfunctions {sigmoid,tanh,relu,elu} Optimizationapproaches {SGD,ADAM,NADAM,ADAMAX}
tityofneuronsineachhiddenlayer,anin-depthliteraturereviewon FNNandDFNNpredictionmodelswasconducted,assummarized in Table 1 .AswillbediscussedinSection 3 ,thereare8760training sam-plesand9inputneuronsforday-aheadhourlyprediction;while365 trainingsamplesand10inputneuronsforweek-aheaddailyenergy con-sumptionprediction.Inviewofthehiddenlayersandneuronsadopted inthepreviousFNNandDFNNmodels,thequantityofhiddenlayers wastestedintherangeof1–5whilethequantityofneuronsineach layerwastestedintherangeof5–10.Theprocedureoftheproposed predictivemodelisshowninFig. 2 .
Inthebeginning,apopulationof20 DFNNmodelsaregenerated whilerandomdecisionvariablesareassignedtodeterminethe architec-tureofeachDFNNmodel.EachDFNNmodelistrainedusingtheinput andoutputdatasetsfromthehistoricaldatabase.Basedonthefitness valueoftheobjectivefunction(i.e.MAPEvalueofDFNN),selection, crossoverandmutationoperatorsofGAareconductedforthe popula-tionofDFNNmodels,respectively.Suchaprocedureisrepeateduntil thepresetoptimizationcriteriaaremet.Finally,optimalDFNN archi-tecturecanbedetermined.
2.4. Researchmethodology
TheproposedGA-DFNNpredictivemodelisimplementedinPython withtheKerasandTensorFlowlibrariesasthebackend.Kerasisa li-braryofopensourcesoftheneuralnetworkdevelopedinPython,which isgoodatthefastcomputationofDFNNandwhichisfocusedon mini-mization,modularity,andscalability[44] .Meanwhile,TensorFlowisan open-sourcesoftwarelibrarywhichprovidesaninterfaceforexpressing andexecutingvariousmachinelearningalgorithms[45] .
Fig.2. Schematic flowchart of the proposed GA-DFNN predictive model.
Fig.3. Distribution of training, validation and testing datasets.
3. Structureofhistoricaldatabase
TotesttheperformanceoftheproposedGA-DFNNpredictivemodel, itwasimplementedonacampusbuildingintheUnitedKingdom.The energydatawascollectedfromtheNorthavonHouseinUniversityof theWestofEngland,Bristoloverthepast1yearand6months(1July 2018– 31December2019)atthetimestepof1h.
3.1. Compositionofthehistoricaldatabase
Sincethebuildingenveloppropertiesgenerallyremainstableover longtime,theaffectingfactorsofbuildingelectricityconsumption in-cludeweatherconditions,occupancyandoperatingequipmentinthe building.Duetothedifficultyincollectinginformationofoccupancy andoperatingequipment,timeindicators,suchashouroftheday,day oftheweek,monthoftheyear,areusuallychosenasschedule-related inputstorepresentoccupancyandoperatingequipmentscenarios.In addition,thehistoricalelectricityconsumptionduringthepreviousday orweekcanindicatethetrendofprofileinamathematicalway. Con-sequently,threetypesofinputvariables,includingweatherconditions, timeindicatorsandhistoricalenergyconsumption,areselectedforthe proposed GA-DFNNpredictive model.The weatherconditioncan be well-describedusingoutdoorairdry-bulbtemperature,outdoorair dew-pointtemperature,windspeedandsolarradiation.Thehistorical out-doorweatherdatawascollectedthroughtheweatherstationinBristol [46] .Althoughsolarradiationisaccessiblefromthehistoricalweather data, itis generallynot availablefrom weatherforecasting websites [47–49] .Therefore,itisnotconsideredinthisstudy.
3.2. Datapre-processing
Tofacilitatethepredictionofbothday-aheadhourlyandweek-ahead dailyelectricityconsumption,twosetsofthehistoricaldatabasewere formulated.AsshowninFig. 3 ,therandom80%ofthedatasetsfromthe firstoneyear,theremaining20%ofthedatasetsfromthefirstoneyear, anddatasetsfromthefollowing6monthswereadoptedfortraining, validationandtestingpurposes,respectively.Toincreasetheprediction accuracyofDFNNwhilepreventitfromoverfitting,theaveragevalueof
MAPEfortrainingandtestingcaseswastreatedastheobjectivefunction inGAoptimization.
3.2.1. Databaseforday-aheadhourlyelectricityconsumptionprediction
Thetrainingdatabasefortheday-aheadhourlyelectricity consump-tionpredictionincludesthehourofthedayh(t),thedayoftheweek
d(t),themonthoftheyearm(t),hourlyoutdoorairdry-bulb temper-atureTdb(t),hourlyoutdoorairdew-pointtemperatureTdew(t),hourly windspeedVwind(t)aswellasthehourlyelectricityconsumptionatthe samehourofthepreviousdayEh(t-24).Torepresentthecyclicalnature ofthetime,h(t)wasrepresentedbyitssineandcosinevalueas[13 ,37] : ℎ𝑠(𝑡)=sin2𝜋ℎ24(𝑡)ℎ𝑐(𝑡)=cos2𝜋ℎ24(𝑡) (13) Owingtothedifferentoccupancyandoperatingequipment scenarios duringtheholidays,theholidaysweremarkedasanadditionaldayof theweek.Meanwhile,thecategoricaldata,includingdayoftheweek andmonthoftheyearwereencodedusingone-hotencodingapproach. Dayoftheweekwasrepresentedbyaconcatenationof8binary vari-ables. Forinstance,bankholidayswereexpressed as[1000000
Fig.4. Hourly outdoor weather data.
0],Sundaywasexpressedas[01000000].Thefirstcolumn corre-spondedtoaflagwhetherornotthedaywasabankholiday,whilethe secondcolumnreferredtoaflagwhetherornotthedaywasSunday. Similarly,theremainingsix columnscorrespondedtoaflagforeach ofthesixotherdaysoftheweek[50] .Meanwhile,monthoftheyear wasreferredbyaconcentrationof 12binaryvariables.Forexample, Januarywasillustratedas[100000000000],withthefirst col-umncorrespondedtoaflagwhetherornotthemonthwasJanuary.In
addition,thevariablesofoutdoorweatherdata(i.e.Tdb,h,Tdew,hand
Vwind,h)werenormalizedthroughthemin-maxscalingapproach:
𝑥′= 𝑥 (𝑡) − min 1 ≤𝑡≤365 × 24 𝑥(𝑡) max 1≤𝑡≤365× 24𝑥(𝑡)−1 ≤𝑡≤min365 × 24 𝑥(𝑡) (14)
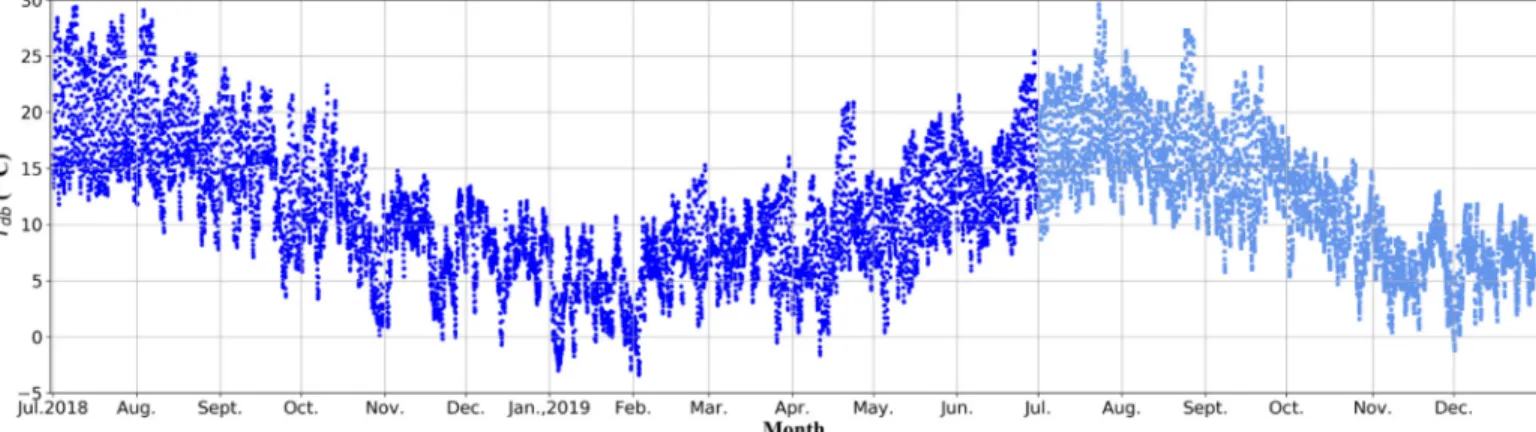
The hourlyoutdoorair dry-bulbtemperature, outdoorair dew-point temperatureandwindspeedareshowninFig. 4 .Thepeakdry-bulb
Fig.5. Hourly electricity consumption.
anddew-pointtemperaturehappenedinJulywhilethevalleyoccurred inJanuary.Thehighestandlowestdry-bulbtemperatureis30°Cand −3°C,respectively.Meanwhile,thehighestandlowestdry-bulb tem-peratureis29°Cand−3°C,respectively.Theoveralltrendofdry-bulb temperatureanddew-pointtemperatureissimilar duringthe second-halfyearin2018and2019.Duringmosttimeoftheyear,windspeed islowerthan10m/s,whileitwouldreach15m/sonafewdays.
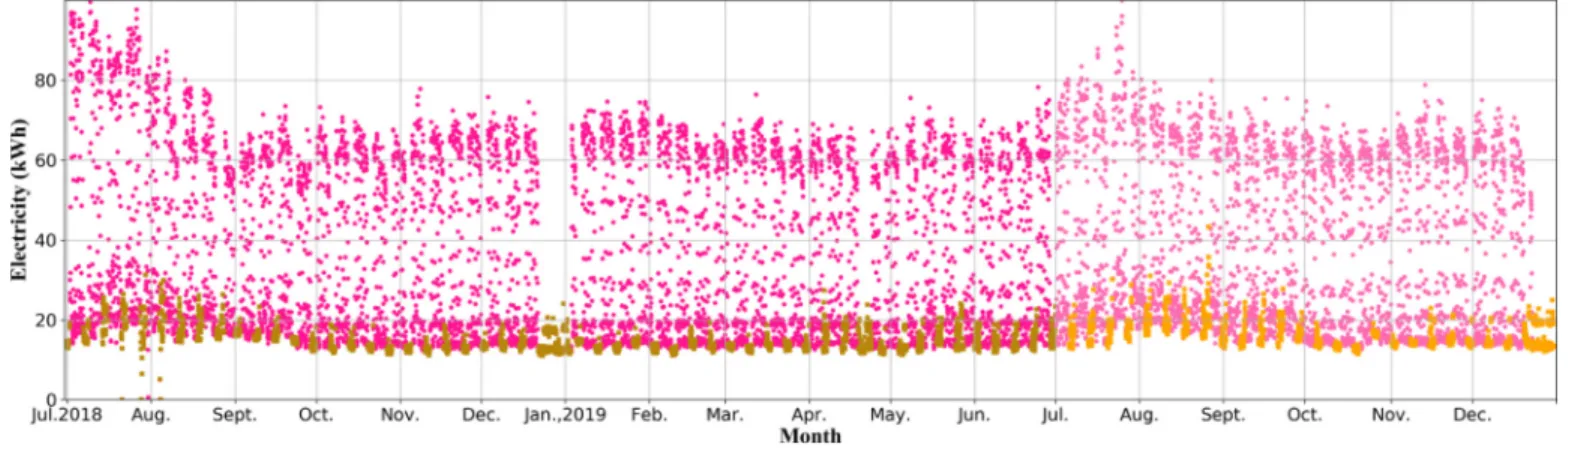
ThehourlyelectricityconsumptionispresentedinFig. 5 .InFig. 5 , thepinkdotsstoodforweekdayelectricityconsumptionwhilethe or-angedotsrepresentedtheweekendandbankholidays.Owingtothe normaloperatingscheduleoftheinvestigatedofficebuilding,electricity consumptiononweekdayswasmuchhigherthanthatduringthe week-endsandbankholidays.Moreover,thepeakelectricityconsumptionwas identifiedinJulyduetoitshighdry-bulbanddew-pointtemperature.
In conclusion, the input dataset at time step t is denoted by training sample 𝑋𝑡=[𝑥1,𝑡𝑥2,𝑡𝑥3,𝑡𝑥4,𝑡𝑥5,𝑡𝑥6,𝑡𝑥7,𝑡], where 𝑥1,𝑡=ℎ𝑠(𝑡),
𝑥2 ,𝑡=ℎ𝑐(𝑡), 𝑥3 ,𝑡=𝑑(𝑡),𝑥4 ,𝑡=𝑚(𝑡), 𝑥5 ,𝑡=𝑇𝑑𝑏,ℎ(𝑡),𝑥6 ,𝑡=𝑇𝑑𝑒𝑤,ℎ(𝑡),𝑥7 ,𝑡=
𝑉𝑤𝑖𝑛𝑑,ℎ(𝑡),whiletheoutputdatasetis𝑍𝑡=𝐸ℎ(𝑡).
3.2.2. Databaseforweek-aheaddailyprediction
Thetrainingdatabasefortheweek-aheaddailyelectricity consump-tionprediction includesthe day of theweek d(t), themonth of the yearm(t),dailyaverage outdoorair dry-bulbtemperatureTdb,ave,d(t), daily maximum outdoor air dry-bulb temperature Tdb,max,d(t), daily minimum outdoor air dry-bulb temperature Tdb,min,d(t), daily av-erage outdoor air dew-point temperature Tdew,ave,d(t), daily maxi-mum outdoor air dew-point temperature Tdew,max,d(t), daily mini-mum outdoor air dew-point temperature Tdew,min,d(t), daily aver-age wind speed Vwind,d(t) as well as the total daily electricity con-sumption Ed(t). The variables of the daily outdoor weather data (i.e. Tdb,ave,d,Tdb,min,d,Tdb,max,d,Tdew,ave,d,Tdew,min,d,Tdew,max,d and
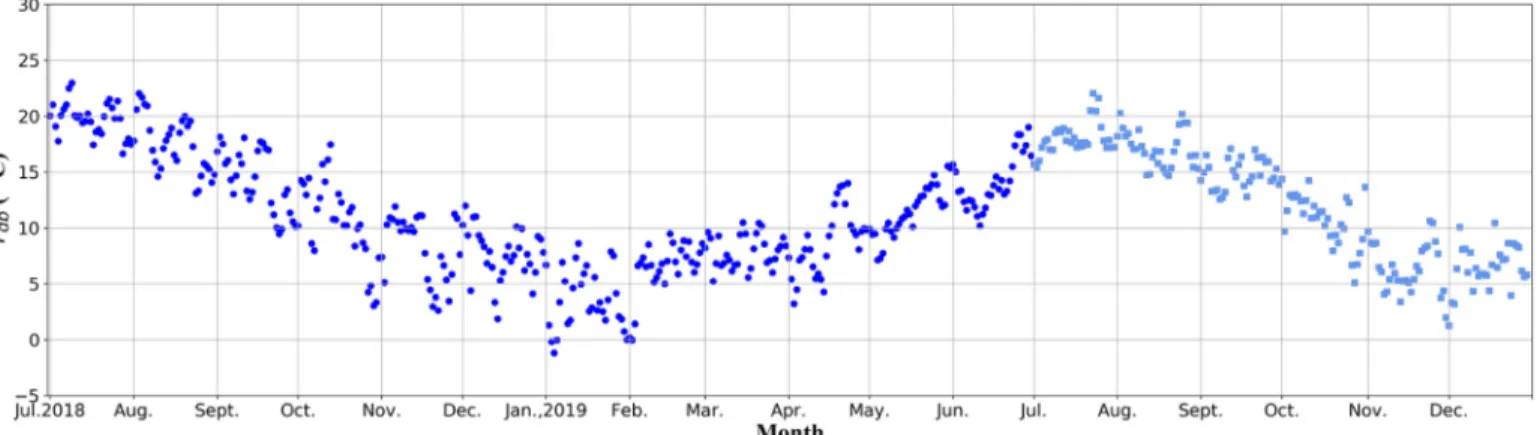
Vwind,d)werealsonormalized: 𝑥′= 𝑥(𝑡) − min 1≤𝑡≤365𝑥(𝑡) max 1 ≤𝑡≤365 𝑥(𝑡)−1 ≤min𝑡≤365 𝑥(𝑡) (15) Thedailyaverageoutdoorairdry-bulbtemperature,outdoorair dew-pointtemperatureand windspeedareshown in Fig. 6 . Theoverall trendsofdaily-averagedry-bulbanddew-pointtemperatureissimilar tothoseofhourlydry-bulbanddew-point,respectively.Thepeakvalue ofdaily-averagedry-bulbtemperaturewasinJulyat23°C,whilethe lowestvaluewasinearlyJanuaryat−1°C.Moreover,thepeakvalue ofdaily-averagedew-pointtemperaturewasinAugustat17°C,while thelowestvaluewasinearlyJanuaryat−2°C.Thehighestwindspeed wasfoundinOctoberat12.5m/s.
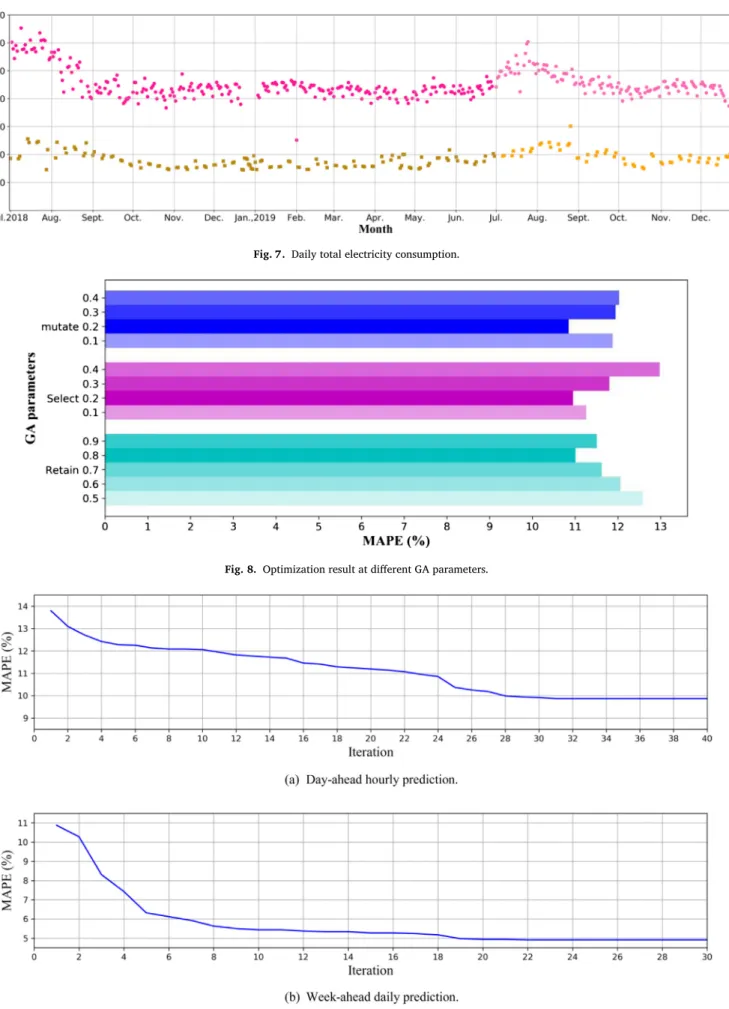
Thedaily totalelectricityconsumptionispresentedin Fig. 7 .The pinkdotsstoodforweekdayelectricityconsumptionwhiletheorange dotsrepresentedtheweekendandbankholidays.Owingtothe nor-maloperatingscheduleof theinvestigatedoffice building,electricity
consumptiononweekdayswasmuchhigherthanthatduringthe week-endsandbankholidays.Thedailyelectricityconsumptionwasbetween 700=1300kWh onweekdays while 250–520kWh on weekendsand bankholidays. Therelativelyhigherelectricityconsumption was oc-curredinJanuaryduetorelativelyhigherdry-bulbanddew-point tem-perature.Itisalsonoticedthatthedailyelectricityconsumptionwas 500kWhonthe1stFebruary,whichwasmuchlowerthanother week-days.Itisbecausethatthecampuswasclosedduetoslowonthatday. Therefore,thisdaywasregardedasaholidaytoincreasetheprediction accuracyoftheproposedGA-DNNpredictivemodel.
As a whole, the input dataset at time step t is denoted by 𝑋𝑇=[𝑥1 ,𝑡𝑥2 ,𝑡𝑥3 ,𝑡𝑥4 ,𝑡𝑥5 ,𝑡𝑥6 ,𝑡𝑥7 ,𝑡𝑥8 ,𝑡𝑥9 ,𝑡], where 𝑥1 ,𝑡=𝑑′(𝑡),𝑥2 ,𝑡=
𝑚′(𝑡),𝑥
3 ,𝑡=𝑇𝑑𝑏,𝑎𝑣𝑒,𝑑′ (𝑡),𝑥4 ,𝑡=𝑇𝑑𝑏,𝑚𝑎𝑥,𝑑′ (𝑡),𝑥5 ,𝑡=𝑇𝑑𝑏,𝑚𝑖𝑛,𝑑′ (𝑡),𝑥6 ,𝑡=
𝑇′
𝑑𝑒𝑤,𝑎𝑣𝑒,𝑑(𝑡),𝑥7 ,𝑡=𝑇𝑑𝑒𝑤,𝑚𝑎𝑥,𝑑′ (𝑡), 𝑥8 ,𝑡=𝑇𝑑𝑒𝑤,𝑚𝑖𝑛,𝑑′ (𝑡),𝑥9 ,𝑡=𝑉𝑤𝑖𝑛𝑑,𝑑′ (𝑡), while theoutputdatasetis𝑧𝑡=𝐸𝑑(𝑡).
4. PerformanceevaluationoftheproposedGA-DFNNpredictive model
Topreventtheoptimizationfrombeingtrappedinlocaloptimum, theGAparameterswerechosenusingsensitivityanalysis.The conver-genceperformanceoftheGAoptimizationwasassessed.Therefore,the optimalarchitectureoftheDFNNpredictionmodelcanbedetermined.
4.1. DeterminationofGAparameters
Topreventtheoptimizationfrombeingconvergedtolocaloptimum, different GAparameters,includingfiveretainingprobabilities (i.e.0.5, 0.6,0.7,0.8and0.9),fourselectionprobabilities(i.e.0.1,0.2,0.3and0.4) andfourmutationprobabilities(i.e.0.1,0.2,0.3and0.4)wereadopted intheoptimizationofDFNNarchitectureforweek-aheaddaily electric-ityconsumption.TheoptimizationresultsareshowninFig. 8 .Foreach variablebar,theaveragevalueofothervariablesisobtained.For exam-ple,whencalculatingthebarvalueofretainingprobability=0.5,the av-eragevalueof4×4optimizationresultswasadopted.Accordingtothe resultedMAPEvalue,theretainingprobability,selectionprobability and
mutationprobabilitywerechosenas80%,20%,and20%,respectively (Fig. 9 .).
4.2. ConvergenceperformanceofGAoptimization
Theconvergenceperformanceoftheday-aheadhourlyandthe week-aheaddailyelectricityconsumptionpredictionisshowninFig. 10 .The minimumvalueofday-aheadhourlyandweek-aheaddailyelectricity consumption reached convergentafter 31 and 22 iterations, respec-tively.Toensuretheconvergencewouldbesteadythereafter,the max-imumiterationswerechosenas40and30forday-aheadhourlyand week-aheaddailyelectricityconsumption,respectively.
Fig.6. Daily-average value of weather data.
4.3. OptimalarchitectureoftheproposedGA-DFNNmodel
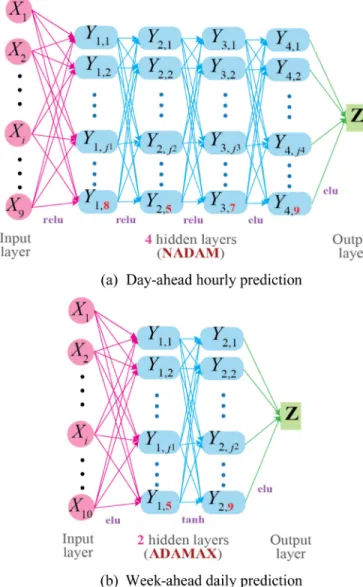
AftertheGA optimization,the optimalarchitectureof theDFNN modelcouldbedetermined,asshowninFig. 10 .Thereare4and2 hid-denlayersforday-aheadhourlyandweek-aheaddailyelectricity con-sumption,respectively.Thereweremorehiddenlayersforday-ahead hourlyelectricityconsumptionpredictionowingtothereasonthatthere
existsahighernumberoftrainingsamples(i.e.8736).Rectifiedlinear unitandexponentiallinearactivationfunctionsweremainlyadoptedin hiddenlayersforday-aheadhourlypredictionwhileexponentiallinear andhyperbolictangentactivationfunctionswereusedinweek-ahead dailyelectricityconsumptionprediction.Exponentiallinearactivation functionwas adoptedin theoutputyearforbothpredictionmodels. NADAMandADAMAXwereadoptedastrainingprocessforday-ahead
Fig.7. Daily total electricity consumption.
Fig.8. Optimization result at different GA parameters.
Fig.10. Optimal architecture of the proposed GA-DFNN prediction model.
hourlyandweek-aheaddailyelectricityconsumptionprediction, respec-tively.
Toreducethe computationtimewhileprevent theproposed GA-DFNN predictive model from overfitting, early-stopping is adopted [51 ,52] .Duringthetrainingphase,theMAPEvalueofthetrainingand validationdatasetsareshowninFig. 11 .After400and12,000epochs, theMAPEvalueofdailyandweeklypredictionreachedrelatively con-stant.Therefore,theMAPEvaluefordailyandweeklypredictionwas 9.8%and4.9%,respectively.
5. Performancecomparisonwithreferencemodels
To assess the effectiveness of the proposed GA-DFNN predictive model,fourgroupsofreferencescaseswereintroduced.Toinvestigate thepredictionperformanceoftheDFNNmodelwithmultiplehidden layers,thefeedforward neuralnetworkmodel withsingle layerwas adoptedasreference.Toassessthepredictionperformance improve-mentthroughDFNNmodelwithoptimalarchitecture,theDFNNmodels withdifferentarchitectureareadoptedasreferencecases.To demon-stratethe comprehensive relationship between affecting factors and electricityconsumption,thetime-seriespredictionapproachincluding long-term-short-memory(LSTM)neuralnetworkmodelandtemporal convolutionalnetworks(TCN)modelisadoptedasreference.Toexhibit
theoptimizationperformanceofGA,therandomsearch-basedDFNN modelisusedasareferencecase.
5.1. PerformancecomparisonagainstFNNmodelswithsinglehiddenlayer
Firstly,toinvestigatethepredictionperformanceoftheDFNNmodel withmultiplehiddenlayers,theANNmodelwithsinglelayerisadopted asreference.Thequantityofneuronswasselectedaccordingtothe em-piricalequationsin[18] and[20] ,respectively.Sigmoidactivation func-tionwasadoptedinthehiddenlayerwhileexponentiallinearactivation functionwasusedintheoutputlayer.ADAMwasadoptedasthe train-ingprocess,assummarizedinTable 3 .
TheperformanceoftheproposedGA-DFNNmodelandtworeference FNNmodelsaresummarizedinTable 4 .
• Forday-ahead hourlyprediction, although theprediction perfor-manceofGA-DFNN duringtrainingphasewasalittleworsethan thereferenceFNNmodelswithsinglelayer,itshowedbetter perfor-manceattestingphase.ComparedtoFNN1andFNN2models,there was3.4%and1.8%reductioninMAPE,1.3%and6.1%reductionin RMSE,4.8and3.8%reductioninMAE,aswellas0.10%and0.52% increaseinR2,respectively.
• Forweek-aheaddailyprediction, theproposed GA-DFNNshowed better performancein both trainingandtesting phases. For test-ingcasesoftheproposedGA-DFNNmodel,thereductioninMAPE, RMSEandMAEwas34.5%,38.9%and29.3%whiletheincrease inR2was6.3%comparedtoFNN1model;thereductioninMAPE, RMSEandMAEwas34.3%,38.9%and29.2%whiletheincreasein R2was6.3%comparedtoFNN2model.
Thepredictionresultsfromtwodaysintraining,twodaysintesting, twoweeksintrainingandtwoweeksintestingareshowninFigs. 12 and 13 ,respectively.TheproposedGA-DFNNmodelshowedbetterability attrackingthevariationofelectricityconsumption,suchasatthe4th, 13th,17th,18th,20th,21stand22ndhinFig. 13 (c);atthe1st,2nd,4th, 6th,12th-14th,17th,21sthinFig. 13 (d);duringTuesday,Wednesday, ThursdayandFridayinFig. 14 (c);aswellasduringTuesday-Saturday inFig. 14 (d).
5.2. PerformancecomparisonagainstDFNNmodelswithotherarchitecture
ToverifytheoptimalarchitecturedeterminedbyGAoptimization, theDFNNmodelswithdifferentneuronsineachhiddenlayer,activation functionandlearningapproachwereadoptedasreference.The selec-tionofthereferencearchitectureisbasedonthecriteriathatonlyone affectingfactorwaschangedwhileotherfactorswerekeptthesameas theGA-determinedarchitecture.Thearchitectureofthefourreference DFNNmodels,alongwiththeGA-determinedDFNN,aresummarizedin Table 5 .
TheperformanceoftheproposedGA-DFNNmodelandthefour ref-erenceDFNNmodelsaresummarizedinTable 6 .
• Forday-aheadhourlyenergyconsumptionprediction,althoughthe predictionperformanceofGA-DFNNduringtrainingphaseisalittle worsethanthereferenceFNNmodelswithsinglelayer,itshowed better performance at testing phase. Compared to the reference DFNN1, DFNN2, DFNN3 and DFNN4 models, the proposed GA-DFNNmodelhad3.4%,0.59%,5.0%and0.97%reductioninMAPE
value;0.21%,0.31%,0.52%and0.31%increaseinR2;1.4%,0.25%, 0.34%and0.27%reductioninRMSE;aswellas1.6%,3.0%,3.3% and0.34%reductioninMAE.
• Forweek-aheaddailyenergyconsumptionprediction,theproposed GA-DFNNshowedbetterperformanceinbothtrainingandtesting phases.FortheproposedGA-DFNNmodel,thereductioninMAPE valuewas27.4%,20.7%,33.3%and16.7%;theincreaseinR2was 2.9%, 4.2%, 5.8%and1.9%; thereductionin RMSE was25.3%, 32.0%,37.4%and18.9%;thereductioninMAEwas23.0%,24.2%,
Fig.11. MAPE convergence of the proposed GA-DFNN model.
Fig.12. Day-ahead hourly prediction of GA-DFNN and FNN models.
30.5%and16.7%,comparedtoDFNN1,DFNN2,DFNN3andDFNN4 models,respectively.
Sincethearchitectureofreferencemodelswerechosenbasedonthe GA-determinedarchitecturebychangingaffectingfactorsone-by-one, thereductioninMAPE,RMSEandMAEaswellastheincreaseinR2 valueverifiesthattheproposedGA-DFNNmodelwaseffectiveinfinding itsoptimalarchitecture.
Thepredictionresultsfromtwodaysintraining,twodaysin test-ing, two weeks in training and two weeks in testing are shown in Figs. 14 and15 ,respectively.TheproposedGA-DFNNmodelshowed
betterabilityattrackingthevariationofelectricityconsumption,such asat2nd,11th,12th,13thand16th−20thhinFig. 15 (c);at0th-3rd, 8th,11th-13th,2nd,4th,6th,12th-14th,20th-22ndhinFig. 15 (d);on Tuesday,WednesdayandFridayinFig. 16 (c);andonMonday,Tuesday, WednesdayandFridayinFig. 16 (d).
5.3. Performancecomparisonagainstrandomsearch-basedDFNNmodel
ToassesstheperformanceofGAinfindingtheoptimalarchitecture, theDFNNmodeloptimizedbyrandomsearch(RS-DFNN)wasadopted as reference. Thedecision variablesof random searchalso included Table3
Design parameters of reference DFNN models.
Day-ahead hourly prediction Week-ahead daily prediction
Referencemodels FNN1 FNN2 FNN1 FNN2
Neuronsinhiddenlayer 17 98 21 25
Activationfunction Sigmoidinhiddenlayer,exponentiallinearinoutputlayer Optimizationapproach ADAM
Fig.13. Week-ahead daily prediction of GA-DFNN and FNN models.
Fig.14. Day-ahead hourly prediction of GA-DFNN and FNN models.
quantityof hiddenlayers,quantity of neuronsin each layer, activa-tionfunctionandlearningapproach. Theoptimizationobjective was stilltheMAPEvaluebetweenthepredictedandactualmeasurement. Theoptimalarchitecturedeterminedbyrandomsearchissummarized inTable 7 .
TheperformanceoftheproposedGA-DFNNmodelandthefour ref-erenceDFNNmodelsaresummarizedinTable 8 .
• For day-aheadhourlyprediction, althoughthe prediction perfor-manceofGA-DFNNduringtrainingphaseisalittleworsethanthe reference FNNmodelswithsinglelayer, itshowedbetter perfor-manceattestingphase.ComparedtoRS-DFNNmodel,theproposed GA-DFNNmodelhas9.7%,6.8%and8.2%reductioninMAPE,RMSE
andMAE,while0.52%increaseinR2,respectively.
• Forweek-aheaddaily prediction, theproposedGA-DFNN showed betterperformanceinbothtrainingandtestingphases.Comparedto
RS-DFNNmodel,thereductioninMAPE,RMSEandMAEwas33.8%, 36.2%and31.8%and16.7%,respectively,whiletheincreaseinR2 was5.3%.
TheworseperformanceoftheRS-DFNNmodelmaybeowingtothe factthatrandomsearchwastrappedtolocaloptimalratherthanglobal optimal.
Thepredictionresultsfromtwodaysintraining,twodaysintesting, twoweeksintrainingandtwoweeksintestingareshowninFigs. 16 and 17 ,respectively.TheproposedGA-DFNNmodelshowedbetterability attrackingthevariationofelectricityconsumptioninbothtrainingand testingcasesduringmostofthetime.
Fig.15. Week-ahead daily prediction of GA-DFNN and DFNN models.
Table4
Performance indicators of GA-DFNN and reference FNN models with single hid- den layer.
GA-DFNN FNN1 FNN2
Train Test Train Test Train Test Daily MAPE(%) 9.870 7.885 9.574 8.163 9.669 8.032 R2 0.958 0.970 0.961 0.969 0.963 0.965 RMSE(kWh) 4.440 3.652 4.281 3.702 4.143 3.891 MAE(kWh) 2.958 2.675 2.827 2.811 2.722 2.781 Weekly MAPE(%) 4.908 5.326 10.04 8.13 10.04 8.11 R2 0.958 0.966 0.837 0.909 0.837 0.909 RMSE(kWh) 55.25 47.24 108.6 77.29 108.7 77.27 MAE(kWh) 32.49 35.52 60.26 50.30 60.30 50.17
5.4. PerformancecomparisonagainstLSTMandTCNtime-series predictionmodel
Todemonstratethecomprehensiverelationshipbetween affecting factorsandelectricityconsumption,thetime-seriespredictionapproach includingLSTM[53] andTCNmodelisadoptedasreference.The per-formanceoftheproposedGA-DFNNmodelandthefourreferenceDFNN modelsaresummarizedinTable 9 .
• Forday-aheadhourly prediction, althoughthe prediction perfor-manceofGA-DFNNduringtrainingphasewasalittleworsethanthe
referenceLSTMandTCNmodels,itshowedbetterperformanceat testingphase.ComparedtothereferenceLSTMmodel,theproposed GA-DFNNmodelhas12.2%,40.1%and32.6%reductioninMAPE, RMSEandMAE,while5.9%increaseinR2,respectively.Compared to thereference TCN model, the proposed GA-DFNN model has 23.8%,9.8%and17.7%reductioninMAPE,RMSEandMAE,while 0.73%increaseinR2,respectively.
• Forweek-aheaddailyprediction, theproposed GA-DFNNshowed betterperformanceinbothtrainingandtestingphases.Compared toLSTMpredictionmodel,thereductioninMAPE,RMSEandMAE
was32.7%,46.4%and26.4%,respectively,whiletheincreaseinR2 is9.6%.ComparedtoTCNpredictionmodel,thereductioninMAPE, RMSEandMAEwas65.0%,60.6%and64.5%,respectively,while theincreaseinR2is24.0%.
ItdemonstratedthattheproposedGA-DFNNmodelhasbetter accu-racythanLSTMandTCNmodelsforbothday-aheadhourlyprediction andweek-aheaddailyprediction.
Thepredictionresultsfromtwodaysintraining,twodaysintesting, twoweeksintrainingandtwoweeksintestingareshowninFigs. 18 and 19 ,respectively.TheproposedGA-DFNNmodelshowedbetterability attrackingthevariationofelectricityconsumptioninbothtrainingand testingcasesduringmostofthetimethanthatofreferenceLSTMand TCNmodels.
Table5
Architecture of the GA-DFNN and four reference DFNN models.
Models GA-DFNN DFNN1 DFNN2 DFNN3 DFNN4
Neuronsinhiddenlayers {8,5,7,9} {10,10,10,10} {5,5,5,5} {8,5,7,9} {8,5,7,9} Quantityofhiddenlayers 4
Activationfunctionsinhiddenlayers relu,relu,relu,elu relu,relu,relu,elu relu,relu,relu,elu sigmoid,sigmoid,sigmoid,sigmoid relu,relu,relu,elu Activationfunctioninoutputlayer elu
Learningapproach NADAM NADAM NADAM NADAM ADAM
Neuronsinhiddenlayers {5,9} {10,10} {5,5} {5,9} {5,9} Quantityofhiddenlayers 2
Activationfunctioninhiddenlayer elu,tanh elu,tanh elu,tanh Sigmoid,sigmoid elu,tanh Activationinoutputlayer elu
Table6
Prediction performance of the GA-DFNN and four reference DFNN models.
GA-DFNN DFNN1 DFNN2 DFNN3 DFNN4
Train Test Train Test Train Test Train Test
Daily MAPE(%) 9.870 7.885 9.574 8.163 9.669 7.932 9.521 8.303 9.751 7.962 R2 0.958 0.973 0.961 0.971 0.959 0.970 0.956 0.968 0.957 0.970 RMSE(kWh) 4.440 3.652 4.277 3.602 4.379 3.643 4.520 3.782 4.483 3.662 MAE(kWh) 2.958 2.675 2.843 2.718 2.897 2.683 2.926 2.765 2.955 2.684 Weekly MAPE(%) 4.908 5.326 7.085 7.337 6.693 6.713 9.662 7.989 5.812 6.388 R2 0.958 0.966 0.890 0.939 0.860 0.927 0.851 0.913 0.942 0.948 RMSE(kWh) 55.25 47.24 89.35 63.21 100.8 69.42 103.9 75.49 65.04 58.24 MAE(kWh) 32.49 35.52 48.22 46.11 56.53 46.89 59.45 51.13 39.76 42.65
Fig.16. Day-ahead hourly prediction of GA-DFNN and RS-DFNN models.
Fig.18. Day-ahead hourly prediction of GA-DFNN, LSTM and TCN models.
Fig.19. Week-ahead daily prediction of GA-DFNN, LSTM and TCN models.
6. Practicalimplicationandfutureapplication
Togeneratethedatabasefortrainingandtestingtheproposed GA-DFNNpredictivemodel,morethanoneandahalfyear’shistorical out-doorweatherdatashouldbecollectedfromthelocalweatherstation whiletheelectricityconsumptiondataoughttobeobtainedfromthe buildingenergysystem.UpontrainingandtestingtheproposeGA-DFNN predictivemodel,itcanbeadoptedinthebuildingmanagement sys-temtopredicttheday-aheadhourlyandweek-aheaddailyelectricity consumptionusingthelatestforecastofweatherprofileacquiredfrom theweatherreportingwebsite[45–47] .Itcanalsobefurtherrefined
totackletheproblemcausedbytheprobablefaultymeasurementdata owingtosensorandequipmentfaults.
However,due tothefactthatthecampusbuildinghasrelatively stable buildingoperatingschedule, theeffectivenessof theproposed GA-DFNNpredictivemodelshouldbefurtherevaluatedwhenadopted inresidential,hospital,hotelorothertypesofbuildings.Moreover,it is worthwhiletoinvestigatewhetherotherevolutionaryoptimization algorithms,suchasparticleswarmoptimization,antcolony optimiza-tionandartificialbeecolonyalgorithmwouldshowbetteroptimization performancethantheGAalgorithmindeterminingtheoptimalDFNN architecture.
Table7
Optimal architecture of DFNN model determined by random search.
Models Day-ahead hourly prediction Week-ahead daily prediction Neuronsinhiddenlayers {6,8,7,9} {7,8} Quantityofhiddenlayers 4 2 Activationfunctionsinhiddenlayers tanh,tanh,relu elu Activationfunctioninoutputlayer elu elu Learningapproach ADAMAX ADAM
Table8
Prediction performance of the GA-DFNN and the reference RS-DFNN model.
GA-DFNN RS-DFNN
Train Test Train Test Daily MAPE(%) 9.870 7.885 9.124 8.734 R2 0.958 0.970 0.960 0.965 RMSE(kWh) 4.440 3.652 4.305 3.920 MAE(kWh) 2.958 2.675 2.808 2.917 Weekly MAPE(%) 4.908 5.326 9.592 8.049 R2 0.958 0.966 0.851 0.917 MAE(kWh) 55.25 47.24 103.9 73.99 RMSE(kWh) 32.49 35.52 60.34 52.10 Table9
Prediction performance of the GA-DFNN and the reference LSTM and TCN model.
GA-DFNN LSTM TCN
Train Test Train Test Train Test Daily MAPE(%) 9.870 7.885 9.591 8.983 10.70 10.36 R2 0.958 0.970 0.910 0.916 0.970 0.963 RMSE(kWh) 4.440 3.652 6.499 6.104 3.741 4.050 MAE(kWh) 2.958 2.675 3.966 3.969 3.049 3.251 Weekly MAPE(%) 4.908 5.326 7.013 7.909 16.12 15.21 R2 0.958 0.966 0.885 0.881 0.756 0.779 RMSE(kWh) 55.25 47.24 88.79 88.11 130.8 119.9 MAE(kWh) 32.49 35.52 44.13 48.26 101.7 100.1 6. Conclusion
Toenhancethepredictionaccuracyofbuildingelectricalenergy con-sumption,ahybridpredictivemodelbasedonthecombinationofGA optimizationandDFNNalgorithmisproposed.InconventionalFNNor DFNN-basedpredictivemodels,thearchitectureoftheFNNandDFNN networkwasselectedbased ontheexperience, intuitionortrialand errorprocess,whichwastime-consumingandlackofaccuracy. How-ever,intheproposedGA-DFNNpredictivemodel,thequantityof hid-denlayers,thequantityofneuronsineachhiddenlayer,theactivation algorithmineachlayeraswellasthelearningprocessforweighting fac-torsaredeterminedthroughGAoptimization.Asaresult,theproposed GA-enhancedDFNNpredictivemodelisaself-directed,systematicand well-behavedprocesstoguaranteetheoptimalDFNNarchitecturewith betterpredictionaccuracyandlesscomputationcomplexity.
Theactualoutdoorweatherdatafromweatherstationandthe mea-suredelectricityconsumptiondatafromthebuildingmanagement sys-temofareal-worldcampusbuildingfromoneentireyearwereadopted ashistoricaldatabasetotraintheproposedGA-enhancedDFNN predic-tivemodel,whilethedatasetsfromtheother6monthswereusedfor testingpurpose.Themainfindingsaresummarizedasbelow:
• Forday-aheadhourlyelectricityconsumptionprediction,the opti-malquantityofhiddenlayeris4,with8,5,7and9neuronsineach hiddenlayer,andwiththeactivationfunctionofrectifiedlinearunit inthefirstthreehiddenlayersandexponentiallinearinthefourth hiddenlayer.Theactivationfunctionin theoutputlayeris
expo-nentiallinearfunctionwhiletheoptimaloptimizationapproachis NADAM.
• Forweek-aheaddailyelectricityconsumptionprediction,the opti-malquantityofhiddenlayeris2.Thereare5neuronsinthefirst hiddenlayer,whileexponentiallinearfunctionisadoptedasthe ac-tivationfunction.Thereare9neuronsinthesecondhiddenlayer, whilehyperbolictangentisadopted.Theactivationfunctioninthe outputlayerisexponentiallinearwhiletheoptimaloptimization ap-proachisADAMAX.
• Forday-aheadhourlyelectricityconsumptionprediction,theMAPE, R2,RMSEandMAEwas7.885%,0.970,3.652kWhand2.675kWh fortestingcase,respectively;Forweek-aheaddailyelectricity con-sumptionprediction, theMAPE,R2,MPEandRMSEwas5.326%, 0.966,47.24kWhand35.52kWhfortestingcase,respectively. • Forday-aheadhourlyandweek-aheaddailyelectricityconsumption
prediction,theproposedGA-DFNNpredictivemodelhas3.4%and 34.5%reductioninMAPEcomparedtothereferenceFNNmodels withsinglehiddenlayer,demonstratingthatDFNNmodelswith mul-tiplelayerscanbetterrevealthecomplexrelationshipamongvarious inputdatasetsandoutputdataset.
• Forday-aheadhourlyandweek-aheaddailyelectricityconsumption prediction,theproposedGA-DFNNpredictivemodelhas5.0%and 33.3%reductioninMAPEcomparedtothereferenceDFNNmodels withotherarchitecture,demonstratingthatGAoptimizationhasthe abilitytofindtheoptimalarchitectureforDFNNmodels.
• Forday-aheadhourlyand week-aheaddaily electricity consump-tionprediction,theproposedGA-DFNNpredictivemodelhas9.7% and33.8%reductioninMAPEthanthereferenceRS-DFNNmodel, demonstratingthatGAoptimizationhasbetteroptimization perfor-mancethanrandomsearchoptimizationindeterminingtheoptimal architectureformachinelearningmodels.
• Forday-aheadhourlyandweek-aheaddailyelectricityconsumption prediction,theproposedGA-DFNNpredictivemodelhas12.2%and 32.7%reductioninMAPEthanthereferenceLSTM,while23.8%and 65.0%reductioninMAPEthanthereferenceTCNmodels, demon-strating thatDFNNhasbetterperformancein buildingelectricity consumption prediction than time-series based machinelearning models.
Acknowledgment
Theauthorswouldlike toacknowledgeandexpresstheirsincere gratitude toTheDepartmentforBusiness,Energy& Industrial Strat-egy(BEIS)throughgrantprojectnumberTEIF-101-7025.Opinions ex-pressedandconclusionsarrivedatarethoseoftheauthorsandarenot tobeattributedtoBEIS.
References
[1] ZhaoGY,LiuZY,HeY,CaoHJ,GuoYB.Energyconsumptioninmachining: classi-fication,prediction,andreductionstrategy.Energy2017;133:142–57.
[2] SieminskiA.Internationalenergyoutlook.EnergyInfAdm2017:5–30.
[3] LuoXJ,FongKF.Developmentofmulti-supply-multi-demandcontrolstrategyfor combinedcooling,heatingandpowersystemprimedwithsolidoxidefuelcell-gas turbine.EnergyConversManag2017;154:538–61.
[4] LuoXJ,FongKF.Developmentofintegrateddemandandsupplysidemanagement strategyofmulti-energysystemforresidentialbuildingapplication.ApplEnergy 2019;242:570–87.
[5] Pérez-ChacónR,Luna-RomeraJM,TroncosoA,Martínez-ÁlvarezF,RiquelmeJC. Bigdataanalyticsfordiscoveringelectricityconsumptionpatternsinsmartcities. Energies2018;11(3):683.
[6] WangZ,SrinivasanRS.Areviewofartificialintelligencebasedbuildingenergyuse prediction:contrastingthecapabilitiesofsingleandensemblepredictionmodels. RenewSustainEnergyRev2017;1:796–808.
[7] ZhaoY,ZhangC,ZhangY,WangZ,LiJ.Areviewofdataminingtechnologiesin buildingenergysystems:loadprediction,patternidentification,faultdetectionand diagnosis.EnergyBuiltEnviron2020;2:149–64.
[8] WeiY,ZhangX,ShiY,XiaL,PanS,WuJ,HanM,ZhaoX.Areviewofdata-driven approachesforpredictionandclassificationofbuildingenergyconsumption.Renew SustainEnergyRev2018;1:1027–47.
[9] AmasyaliK,El-GoharyNM.Areviewofdata-drivenbuildingenergyconsumption predictionstudies.RenewSustainEnergyRev2018;81:1192–205.
[10] LuoXJ,LukumonO,AnuoluwapoA,ChukwukaM,OlugbengaA,LukmanA. De-velopmentofanIoT-basedbigdataplatformforday-aheadpredictionofbuilding heatingandcoolingdemands.AdvEngInform2019;41:100926.
[11] LuoXJ.Anovelclustering-enhancedadaptiveartificialneuralnetworkmodelfor predictingday-aheadbuildingcoolingdemand.JBuildEng2020:101504. [12] Singh S, Hussain S, Bazaz MA. Short term load forecasting using artificial neural
network. 2017 Fourth International Conference on Image Information Processing (ICIIP), Shimla 2017:1–5. doi: 10.1109/ICIIP.2017.8313703.
[13] MenaR,RodríguezF,CastillaM,ArahalMR.Apredictionmodelbasedon neu-ralnetworksfortheenergyconsumptionofabioclimaticbuilding.EnergyBuild 2014;82:142–55.
[14] KusiakA,LiMY,ZhangZJ.Adata-drivenapproachforsteamloadpredictionin buildings.ApplEnergy2010;87:925–33.
[15] DebC, EangLS, Yang J,SantamourisM.Forecastingdiurnal coolingenergy load for institutional buildings usingartificial neural networks. EnergyBuild 2016;121:284–97.
[16] AhmadT,ChenH,ShairJ,XuC.Deploymentofdata-miningshortandmedium-term horizoncoolingloadforecastingmodelsforbuildingenergyoptimizationand man-agement.IntJRefrig2019;98:399–409.
[17] YangJ,HuguesR,RaduZ.On-linebuildingenergypredictionusingadaptive artifi-cialneuralnetworks.EnergyBuild2005;37:1250–9.
[18] CloseR.Theoryofthebackpropagationneuralnetwork.In:ProceedingsofIEEE internationalconferenceonneuralnetworks,1;1989.p.593–605.
[19] WangL,EricWML,RichardKKY.Noveldynamicforecastingmodelforbuilding coolingloadscombininganartificialneuralnetworkandanensembleapproach. ApplEnergy2018;228:1740–53.
[20] .NeuroShell2manual.Frederick,MA:WardSystemGroup,Inc.;1993.
[21] BagnascoA,FresiF,SaviozziM,SilvestroF,VinciA.Electricalconsumption fore-castinginhospitalfacilities:anapplicationcase.EnergyBuild2015;103:261–70. [22] AhmadMW,MourshedM,RezguiY.TreesvsNeurons:comparisonbetween
ran-domforestandANNforhigh-resolutionpredictionofbuildingenergyconsumption. EnergyBuild2017;147:77–89.
[23] LiK,XieX,XueW,DaiX,ChenX,YangX.Ahybridteaching-learningartificial neuralnetworkforbuildingelectricalenergyconsumptionprediction.EnergyBuild 2018;174:323–34.
[24] AlnaqiAA,MoayediH,ShahsavarA,NguyenTK.Predictionofenergetic perfor-manceofabuildingintegratedphotovoltaic/thermalsystemthoroughartificial neu-ralnetworkandhybridparticleswarmoptimizationmodels.EnergyConversManag 2019;183:137–48.
[25] LiK,HuC,LiuG,XueW.Building’selectricityconsumptionpredictionusing op-timizedartificialneuralnetworksandprincipalcomponentanalysis.EnergyBuild 2015;108:106–13.
[26] MuralitharanK,SakthivelR,VishnuvarthanR.Neuralnetworkbased optimiza-tion approach for energy demand prediction in smart grid. Neurocomputing 2018;273:199–208.
[27] SchmidhuberJ.Deep learningin neuralnetworks: an overview.Neural Netw 2015;61:85–117.
[28] LeCunY,BengioY,HintonG.Deeplearning.Nature2015;321:436–44.
[29] Zekić-SušacM,Mitrović S,HasA.Machinelearningbasedsystemformanaging energyefficiencyofpublicsectorasanapproachtowardssmartcities.IntJInf Manag2020:102074.
[30] BandaE,FollyKA.Shorttermloadforecastingusingartificialneuralnetwork.In: 2007IEEElausannepowertech.IEEE;2007Jul1.p.108–12.
[31] TorresJF,Gutiérrez-AvilésD,TroncosoA,Martínez-ÁlvarezF.Random hyper-pa-rametersearch-baseddeepneuralnetworkforpowerconsumptionforecasting. Ad-vancesincomputationalintelligenceIWANN2019Lecturenotesincomputer sci-ence,11506.Cham:Springer;2019.
[32] ParkSK,MoonHJ,MinKC,HwangC,KimS.Applicationofamultiplelinear re-gressionandanartificialneuralnetworkmodelfortheheatingperformanceanalysis andhourlypredictionofalarge-scalegroundsourceheatpumpsystem.EnergyBuild 2018;165:206–15.
[33] LuR,HongSH.Incentive-baseddemandresponseforsmartgridwithreinforcement learninganddeepneuralnetwork.ApplEnergy2019;236:937–49.
[34] Schalkoff RJ,YorkNew.Artificialneuralnetworks.McGraw-Hill;1997. [35] JohnD,EladH,SingerYoram.Adaptivesubgradientmethodsforonlinelearning
andstochasticoptimization.JMachLearnRes2011;12:2121–59.
[36] KingmaDP,BaJL.Adam:amethodforstochasticoptimization.In:International conferenceonlearningrepresentations;2015.p.1–13.(2015).
[37] DogoEM,AfolabiOJ,NwuluNI,TwalaB,AigbavboaCO.Acomparativeanalysisof gradientdescent-basedoptimizationalgorithmsonconvolutionalneuralnetworks. In:2018internationalconferenceoncomputationaltechniques,electronicsand me-chanicalsystems(CTEMS).IEEE;December2018.p.92–9.
[38] VaniS,RaoTM.Anexperimentalapproachtowardstheperformanceassessmentof variousoptimizersonconvolutionalneuralnetwork.In:20193rdinternational con-ferenceontrendsinelectronicsandinformatics(ICOEI).IEEE;April2019.p.331–6. [39] GoldbergD.Geneticalgorithmsinsearch,optimization,andmachinelearning.
Read-ing,Massachusetts:AddisonWesley;1989.
[40] MitchellM.Anintroductiontogeneticalgorithms.MITpress;1998.
[41] OhBK,GlisicB,ParkSW,ParkHS.Neuralnetwork-basedseismicresponse pre-dictionmodelforbuilding structuresusingartificialearthquakes.JSound Vib 2020;468:115109.
[42] RenT,LiuX,NiuJ,LeiX,ZhangZ.Real-timewaterlevelpredictionofcascaded channelsbasedonmultilayerperceptionandrecurrentneuralnetwork.JHydrol (Amst)2020:124783.
[43] BahmanAM,EbrahimSA.Predictionoftheminimumfilmboilingtemperatureusing artificialneuralnetwork.IntJHeatMassTransf2020;155:119834.
[44] Chollet F. (2015) keras, GitHub. https://github.com/fchollet/keras.
[45] Abadi M., Agarwal A., Barham P., Brevdo E., Chen Z., Citro C., Zheng X. TensorFlow: large-scale machine learning on heterogeneous distributed systems. 2015. [46] https://dpds.weatheronline.co.uk/historical_data/weather_stations_download. [47] https://www.accuweather.com.
[48] https://weather.com/en-GB/. [49] https://www.metoffice.gov.uk/.
[50] Berriel RF, Lopes AT, Rodrigues A, Varejao FM. and Oliveira-Santos T. Monthly en- ergy consumption forecast: a deep learning approach. In 2017 international joint conference on neural networks (IJCNN), IEEE, 4283–4290
[51] ZurRM,JiangY,PesceLL,DrukkerK.Noiseinjectionfortrainingartificial neu-ral networks: acomparison withweight decay andearlystopping. Med Phys 2009;36(10):4810–18.
[52] PrecheltL.Earlystopping-butwhen?.In:Neuralnetworks:tricksofthetrade.Berlin, Heidelberg:Springer;1998.p.55–69.
[53] TorresJF,GaliciaA,TroncosoA,Martínez-ÁlvarezF.Ascalableapproachbased ondeeplearningforbigdatatimeseriesforecasting.IntegrComputAidedEng 2018;25(4):335–48.