RECENT CHANGING PATTERNS OF MIGRATION AND SPATIAL
PATTERNS OF URBANIZATION IN WEST BENGAL: A
DEMOGRAPHIC ANALYSIS
Raju Sarkar,
Research Scholar Population Research Centre,
Institute for Social and Economic Change, Bangalore [email protected]
ABSTRACT
Migration refers to the mobility of people from one place to another; it may be a permanent or temporary migration, as well as a short or long term migration. The study aims to analyze changing patterns, reasons for out-migration and also focus on spatial patterns, tempo of urbanization in West Bengal based on Census data. It is noted that the proportion of migrants in West Bengal has increased from 27% in 1991 to 30% in 2001. In the case of inter -state migrants, West Bengal has more in-migrants than out-migrants. Bihar continues to be the main state of origin of immigrants in West Bengal with 62.43% in 1991 and 63.68% in 2001. West Bengal, the most favored destinations are in Bihar, comprising 36.76% in 1991 and 28.17% in 2001. It is also found that employment is the main cause of men's movement and marriage remains the most dominant for female migration. The focus on level of urbanization increased from 27.81% in the 2001 Census to 31.16% in the 2011 Census, but the pace or speed of urbanization is not uniform over the years in West Bengal.
Keywords: In migration, out migration, level of urbanization, tempo of urbanization and West Bengal.
Introduction
Migration refers to the mobility of people from one place to another; it may be a permanent or
temporary migration, as well as a short or long term migration. The study aims to analyze
changing patterns, reasons for out-migration and also focus on spatial patterns, tempo of
Literature Review
In migration literature, there is no single theory or model exists that covers all forces responsible for migration. Pattern of migration depending on the duration of migration has been dealt in various migration literatures. The laws of Ravenstein (1885) stated that the primary cause of migration was the best external economic opportunities; the volume of the migration decreases
as the distance increases; migration occurs in stages rather than a long movement; population
movements are bilateral and migration differentials such as gender, social class, age; they
influence the mobility of a person. World Bank (1984) has highlighted that the rural population migrate to cities not so much to avail themselves of the employment opportunities and other facilities in urban areas but more to avoid problems in the rural areas. Migration can either depopulate or overpopulate an area, depending upon the level of economic activities and is an important process of urbanization and social change (Bhagat, 2005). Migration plays an important role in the population growth in some states. In India, the volume of migration has increased over the various census periods, from 159.6 million in 1971 to 201 million in 1981; 226 million in 1991 and 309 million in 2001. However the percentage of migrants to total national population declined to 30.3 per cent in 1981 to 27.4 per cent in 1991; it increased to 30.6 per cent in 2001 (Lusome and Bhagat, 2006). Singh and Yadava (2010) has highlighted internal migration is an important element of population redistribution and equilibrium. Human mobility within the national boundary is receiving considerable attention in recent decades.
Objectives
This study has the following objectives.
1. To understand the changing pattern of internal migration in West Bengal during the period 1991-2001.
2. To find out the reasons for out-migration from West Bengal to other states or union territories of India.
3. To examine the spatial patterns and tempo of urbanization in West Bengal.
Data and Research Methodology
on the basis of place of birth and place of residence. This analysis is based on data on migrants by place of residence. The whole analysis of the study is carried out using simple statistical techniques like rates, ratios and percentage. Net Migration Rate is also calculated with the help following formula.
Total in-migrants – Total out-migrants
Net migration rate = --- * 100 Total population
Where,
Total In-Migrants at the place of Enumeration
In-migration rate = --- *100 Total Mid-year population at the place of Enumeration
Total Out-Migrants in the place of enumeration
Out-migration rate = --- * 100 Total Mid-year population at the place of enumeration
The linear model has been used to calculate the tempo of urbanization in West Bengal during 2001-2011.
TR =
1𝑛
(
𝑃𝑈𝑡−𝑛𝑃𝑈𝑡
-1) *100
Where
TR= Tempo of Urbanization. n = Number of Years.
PU = Percent urban at the year t and t+n.
Results and Discussion:
In-migrants, out-migrants and net migrants, India and West Bengal, 2001
Bihar (-1.7 million) shares a large number of net migrants and both state considered as out migrating state.
Table 1: In-migrants, out-migrants and net migrants, India and states, 2001
Total Place of Enumeration In migrants Out migrants Net migrants
Jammu & Kashmir 86768 122175 -35407
Himachal Pradesh 188223 165776 22447
Punjab 811060 501285 309775
Chandigarh 239263 106734 132529
Uttarakhand 352496 354718 -2222
Haryana 1231480 588001 643479
Delhi 2172760 457919 1714841
Rajasthan 723639 997196 -273557
Uttar Pradesh 1079055 3810701 -2731646
Bihar 460782 2241413 -1780631
Sikkim 22519 6238 16281
Arunachal Pradesh 71789 12507 59282
Nagaland 33594 51857 -18263
Manipur 4529 30867 -26338
Mizoram 22599 31739 -9104
Tripura 40262 23538 16724
Meghalaya 33710 20434 13276
Assam 121803 281510 -159707
West Bengal 724524 730226 -5702
Jharkhand 502764 616160 -113396
Odisha 229687 440893 -211206
Chhattisgarh 338793 444679 -105886
Madhya Pradesh 814670 842937 -28267
Gujarat 1125818 451458 674360
Daman Diu 48362 5401 45961
D & N Haveli 47649 3440 44209
Maharashtra 3231612 896988 2334624
Andhra Pradesh 421989 637360 -215371
Karnataka 879106 769111 109995
Goa 120824 32578 88246
Lakshadweep 4444 1149 3295
Kerala 235087 431821 -196734
Tamil Nadu 270473 674304 -403831
Puducherry 105208 35755 69453
A & N Islands 29538 8011 21527
India 16826879 16826879 0
Changing Patterns of Out-Migration in West Bengal
The flow of migration to West Bengal from different parts of the Indian continent is an old
phenomenon dating back to the early nineteenth century, when the process of urbanization began
in areas of eastern India, based in the city of Kolkata. Historically Kolkata was developed by the
British as a port city. It was also the seat of colonial administration and the center of colonial
trade. Industrial growth was also observed in the surrounding area of Kolkata, as it had facilities
such as inland waterway facilities, port facilities, etc. Therefore, Kolkata was the main city of the
eastern part of the country since the past and played an important role to attract the massive
population of the surrounding states as well as other parts of the country. So from the outset,
there was a flow of migrants in the state of West Bengal from other parts of the country. But the
scenario has changed a lot during the decade. Now, more and more people have migrated to
other states, even to distant states as well. The net migration rate has declined over the decade.
The net migration rate was 1.28 in 1991, which fell to 1.01 in 2001. The more decreased was observed in case of male migrants which was 1.86 in 1991 and in 2001 the male net migration was 1.44. The decline in the net migration rate is due to the large number of out-migrants to other states during the decade (1991-2001). The volume of migrants shared by different states is
shown in Table 2. It provides a mixed scenario in which some of the surrounding states such as
Bihar, Orissa, Uttar Pradesh and Assam together with states like Maharashtra and Delhi
protected the overwhelming majority of Migrants West of Bengal. However, the gender division
of migrants highlights that women dominate short-distance migration, while males dominate
long-distance migration. Male migration is very pronounced in economically developed states
such as Maharashtra, Delhi and Haryana.
Patterns and characteristic of the out-migration in West Bengal
Table 3 shows that among the four migration flows, Urban-Urban was the most dominant,
followed by Rural-Rural, Rural-Urban and Urban-Rural in both years of the Census. It is quite
interesting to note that the large percentage of people migrated from the urban areas of West
Bengal to the urban areas of other states, while in the case of in-migration to West Bengal from
other states, most of the rural inhabitants of other states migrated to the urban areas of West
Bengal. It was almost two-thirds of the total migrants, out-migrated to urban areas in other states.
The propensity to migrate, particularly from rural areas, to urban areas in other states, has also
Table 2: Total number of out-migrants and percentage of out-migrants from West Bengal to other major states in India, 1991 & 2001.
Place of Enumeration
Place of Origin-West Bengal
1991 2001
Total Male Female Total Male Female
Punjab 18385 1.61 7382 1.7 11003 1.56 44,983 2.72 25,473 3.48 19,510 2.12
Haryana 12794 1.12 5794 1.33 7000 0.99 56,250 3.41 33,093 4.52 23,157 2.52
Delhi 81049 7.11 43438 9.99 37611 5.33 1,71,904 10.41 97,458 13.3 74,446 8.11
Rajasthan 21680 1.9 10850 2.5 10830 1.54 45,505 2.76 26,108 3.56 19,397 2.11
Uttar Pradesh* 106552 9.35 32639 7.51 73913 10.48 1,64,212 9.95 51,812 7.08 1,12,400 12.24
Bihar* 419032 36.76 101918 23.44 317114 44.98 4,75,348 28.79 1,15,609 15.78 3,59,739 39.16
Assam 90864 7.97 41324 9.5 49540 7.03 81,654 4.95 34,949 4.77 46,705 5.09
Orissa 127959 11.23 50053 11.51 77906 11.05 1,40,860 8.53 57,114 7.8 83,746 9.12
Madhya Pradesh 70856 6.22 38010 8.74 32846 4.66 46,295 2.8 23,760 3.24 22,535 2.46
Gujarat 22550 1.98 12660 2.91 9890 1.4 40,262 2.44 24,895 3.4 15,367 1.67
Maharashtra 69090 6.06 38730 8.91 30360 4.31 2,09,044 12.66 1,38,563 18.91 70,481 7.67
Andhra Pradesh 24309 2.13 11660 2.68 12649 1.79 29,815 1.81 16,071 2.19 13,744 1.5
Karnataka 10130 0.89 5540 1.27 4590 0.65 31,248 1.89 20,683 2.82 10,565 1.15
Kerala 3770 0.33 2080 0.48 1690 0.24 5,309 0.32 3,284 0.45 2,025 0.22
Tamil Nadu 10180 0.89 5110 1.18 5070 0.72 12,108 0.73 7,123 0.97 4,985 0.54
All Total 11,39,915 4,34,869 7,05,046 16,51,054 7,32,573 9,18,481
Source: D2 Migration Tables of all states and U.T’s of India, Census of India 2001
Table 3: Percent distribution of lifetime out-migrants from the state of West Bengal to other States/UTs of India of each sex by migration streams (1991- 2001).
Patterns of Migration Total Male Female
1991 2001 1991 2001 1991 2001
Rural-Rural 31.74 27.55 18.27 15.68 40.04 37.01
Rural-Urban 17.42 24.04 22.56 31.8 14.25 17.85
Urban-Rural 11.53 8.4 10.68 7.11 12.05 9.42
Urban-Urban 38.67 38.06 47.77 42.92 33.07 34.18
Source: Census of India
The data presented in Table 3 show that, in the case of male out-migrants, the urban-to-urban
stream was the predominant, while the rural-rural flow was the predominant among out-migrant
women in the two censuses. In case of male out-migrants the Rural-Urban stream constituted
current has increased from 22.56 per cent in 1991 to 31.80 per cent in 2001. There has been a
sharp increase in rural-urban migration in recent years as more young people travel to work in
urban construction and services in the growing informal sector (Srivastava and Bhattacharyya,
2003). Migration of the rural population to urban areas could also be explained in other ways that
the relative lack of employment opportunities in rural versus urban areas forced people to
migrate to urban areas (Greenwood, 1971; Mukherjee, 2001). Overall, it can be concluded that
male out-migrants predominate in urban migration and almost three-quarters of migrants
migrated to urban areas in 2001.The highest female inter-state out-migrants have been observed
in the rural-rural stream and It is due to marriage migration.
Reasons for Out-Migration in West Bengal
One of the important aspects of the study of migration is to find out the reasons why any person
leaves their residence and finds a new residence. The reasons for migration can be divided into
two main aspects, the so-called "push" and "pull" factors (Lee, 1966). Push factors are those in
your old place, which force people to move. For example, there may be civil wars or wars in
general in the country, but political or religious oppression, climate change, lack of employment
or simply poverty are important push factors.
Fig.1 Reasons for Migration from West Bengal to other States/UTs by sex (1991-2001).
0 10 20 30 40 50 60 70 80
Total Male Female Total Male Female
1991 2001
Work/Employment Business Education Marriage Moved with household Others
P
erce
n
tage
o
f
m
ig
ran
The factors of attraction are factors in the destination country that encourage people to move;
these include peace and security, the possibility of better employment, better education, social
security, a better standard of living in general, as well as political and religious freedom. West
Bengal has received a large number of migrants from across the country. They have come to the
state for different reasons; Some have emigrated in search of employment; The others have
moved to get married. It is also observed that, of total interstate emigrants, the reason for which
employment is the main behind the movement of male migrants, while the reason why social
mobility likes "marriage" remains the most dominant For female migration.
Trend of Urbanization in West Bengal
During the last two decades, West Bengal has experienced urbanization involving a rapid expansion of urban areas and remarkable rise in urban population. The level of urbanizations is usually measured by the share of urban population in the total population. Moving on the rate of urbanization increased from 27.81 per cent in the 2001 Census to 31.16 per cent in 2011 Census in West Bengal.
Tempo of urbanization
Tempo of urbanization refers to speed of urbanization and is measured as a change registered in the level or degree of urbanization over the years. From the following table 5, it is clear that tempo or speed of urbanization is not uniform over the years.
Table:5 Percent of urban population and Tempo of urbanization (1901-2011)
Census Year Level of Urbanization Tempo of urbanization
1901 12.20 0.00
1911 13.05 0.70
1921 14.41 1.04
1931 15.32 0.63
1941 20.41 3.32
1951 23.88 1.70
1961 24.45 0.24
1971 24.75 0.12
1981 26.47 0.69
1991 27.43 0.36
2001 28.03 0.22
Spatial Pattern of Urbanization in West Bengal, 2011
West Bengal as a whole has an urbanization of 28.9 percent in 2011. The pattern of urbanization
of the district indicated that of the 19 districts of West Bengal, Kolkata recorded the highest
degree of urbanization, where 100 percent of the total population lived in the urban areas year of
census 2001 and 2011. Based on the levels of urbanization, the state can be divided into three
broad categories, namely: 1) Areas with high degree of urbanization, with more than 40.00
percent of the total population as urban. 2) Areas with moderate degree of urbanization, taking
20.00 to 40.00 percent of the total population as urban. 3) Areas with low degree of urbanization,
with less than 20.00% of the total population as urban.
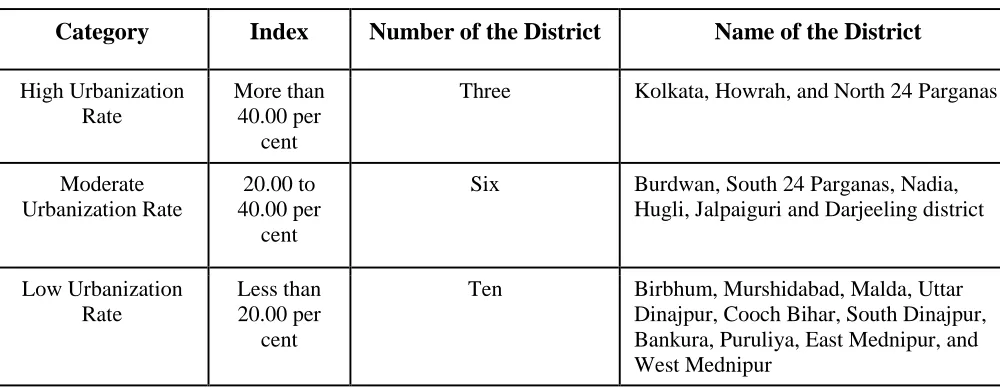
Table 6: Pattern of Urbanization among the districts of West Bengal (2011)
Category Index Number of the District Name of the District
High Urbanization Rate
More than 40.00 per
cent
Three Kolkata, Howrah, and North 24 Parganas
Moderate Urbanization Rate
20.00 to 40.00 per
cent
Six Burdwan, South 24 Parganas, Nadia,
Hugli, Jalpaiguri and Darjeeling district
Low Urbanization Rate
Less than 20.00 per
cent
Ten Birbhum, Murshidabad, Malda, Uttar
Dinajpur, Cooch Bihar, South Dinajpur, Bankura, Puruliya, East Mednipur, and West Mednipur
Computed by Author
High Urbanization Rate:
Districts have the rate of urbanization above 40 percent are included in the highest category. The
high rate of urbanization was recorded in the district of Kolkata, Howrah and North 24 Parganas
due to the high number of educational, social and cultural institutions, availability of educational
facilities, high urbanization process, industrial and economic development, availability of
employment, development, transportation and communication and so on.
Moderate Urbanization Rate:
Low Urbanization Rate:
Districts with an urbanization rate of less than 20 percent are included in the lowest category. The low rate of urbanization was found in the districts of Birbhum, Murshidabad, Malda, Uttar Dinajpur, Cooch Bihar, South Dinajpur, Bankura, Puruliya, East Mednipur and West Mednipur. Institution, poverty, industrial development, economic development, job opportunities, etc.
Findings, Conclusion and Suggestions
The study has concentrated on the issue of changing patterns of migration and their characteristics in West Bengal. It is noted that the proportion of migrants in West Bengal has increased from 27 per cent in 1991 to 30 per cent in 2001. In other words, the intensity of
migration is increasing regardless of the reason behind this; this can be marriage, employment,
education or any other cause. In the case of immigration the main country of origin is
Bangladesh, it constitutes 97.84 percent of the immigrants to West Bengal. In the case of
interstate migrants, West Bengal has more in-migrants than out- migrants. Employment and
business remain the main cause of male out-migration, while marriage to the neighboring state
appears to be the main cause of female emigration. The development of West Bengal was very
centered in Calcutta, it means that the urbanization has centered mainly in Calcutta and the
neighborhoods of the neighborhood of this great city. Moving on the rate of urbanization increased from 27.81 per cent in the 2001 Census to 31.16 per cent in 2011 Census in West Bengal. The state of West Bengal is undoubtedly still a net migration state, but if West Bengal wants to maintain its attraction to migrants, it requires a new impetus in development.
References:
1. Bhagat, R.B. and R.Lusome (2006), “Trends and Patterns of Internal Migration in India, 1971-2001” Paper presented at the Annual Conference of Indian Association for the Study of
Population (IASP) during 7-9 June, 2006, Thiruvananthapuram.
2. Census of India, (1991): Migration Tables, D-Series Tables, Office of the Registrar General and
Census Commission, India.
3. Census of India, (2001): Migration Tables, D-Series Tables, Office of the Registrar General and
Census Commission, India.
5. Mukherjee S. (2001), “Low Quality Migration In India: The Phenomena Of Distressed Migration And Acute Urban Decay”, paper presented at the 24th Iussp Conference, Salvador, Brazil,
August.
6. Ravenstein, E.W. (1889), “The laws of Migration”, Journal of the Statistical Society of London,
52 (2), pp. 288.
7. Saha, S. 2012. Urbanization in West Bengal: Temporal (1901-2011) and spatial pattern,
Unpublished dissertation, Dept. of Geography, The University of Burdwan.
8. Sarkar, A. (2011), “Urbanization and city size distribution of West Bengal‟ Indian Journal of
Regional Sciences, 43 (1), pp. 9-16.
9. Singh, D.P. (1990), “Interstate Migration in India: A Comparative Study of Age-Sex Pattern”
Journal of Social Work, 51 (4), pp. 679-702.
10. Srivastava, R. and S. Bhattacharyya (2003) ,“Globalisation, reforms and internal labour mobility: analysis of recent Indian trends”, Labour and Development (special issue on migration) 9 (2), pp