R E S E A R C H
Open Access
Layer-specific strain analysis in patients
with suspected stable angina pectoris
and apparently normal left ventricular
wall motion
Mustafa Adem Y
ı
lmaztepe
*and Fatih Mehmet Uçar
Abstract
Background:Non-invasive imaging tests are widely used in the evaluation of stable angina pectoris (SAP). Despite these tests, non-significant coronary lesions are not a rare finding in patients undergoing elective coronary angiography (CAG). Two-dimensional (2D) speckle tracking global longitudinal strain (GLS) imaging is a more sensitive and accurate technique for measuring LV function than conventional 2D methods. Layer-specific strain analysis is a relatively new method that provides endocardial and epicardial myocardial layer assessment. The aim of the present study was to evaluate longitudinal layer-specific strain (LSS) imaging in patients with suspected SAP. Methods:Patients who underwent CAG for SAP were retrospectively screened. A total of 79 patients with no history of heart disease and wall motion abnormalities were included in the study. Forty-three patients with coronary lesions > 70% constituted the coronary artery disease (CAD) group and 36 patients without significant CAD constituted the control group. Layer-specific GLS transmural, endocardium, and epicardium values (GLS-trans, GLS-endo, and GLS-epi, respectively) were compared between the groups.
Results:Patients in the CAD group had significantly lower GLS values in all layers (GLS-trans: -18.2 + 2.4% vs
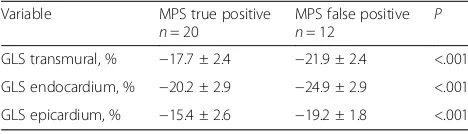
-22.2 + 2.2% p< .001; GLS-endo: -20.8 + 2.8% vs -25.3 + 2.6%, p< .001; GLS-epi: 15.9 + 2.4% vs -19.5 + 1.9%, p< .001). Multivariate adjustment demonstrated GLS-trans as the only independent predictor of CAD [OR:0.472, CI (0.326–0.684),p< .001]. Additionally, the GLS values were all lower in myocardial perfusion scintigraphy (MPS) true-positive patients compared with MPS false-positive patients (GLS-trans: -17.7 ± 2.4 vs. -21.9 ± 2.4%,p< .001; GLS-endo: -20.2 ± 2.9% vs -24.9 ± 2.9%,P< .001; GLS-epi: 15.4 ± 2.6% vs. -19.2 ± 1.8%,P< .001).
Conclusion:Resting layer-specific strain as assessed by 2D speckle tracking analysis demonstrated that GLS values were reduced in all layers of myocardium with SAP and with no wall motion abnormalities. LSS analysis can improve the identification of patients with significant CAD but further prospective larger scale studies are needed to put forth the incremental value of LSS analysis over transmural GLS.
Keywords:Coronary artery disease, Left ventricle function, Echocardiography, 2D speckle tracking, Layer specific strain
* Correspondence:[email protected]
Department of Cardiology, School of Medicine, Trakya University, 22030 Edirne, Turkey
Background
Coronary artery disease is one of the major causes of mortality and morbidity. Noninvasive imaging tech-niques (NIIT) are recommended in the diagnosis and risk stratification of patients with suspected stable an-gina pectoris (SAP) [1]. Resting transthoracic echocardi-ography is one of the leading tests used in the evaluation of patients with stable CAD. However, despite critical CAD, many patients do not exhibit wall motion abnor-malities with resting conventional echocardiography when structural heart disease and history of prior myo-cardial infarction do not exist. In addition to TTE, exer-cise electrocardiography (ECG), myocardial perfusion scintigraphy (MPS), or stress echocardiography are widely used. Exercise ECG is the most widely available technique but has the lowest sensitivity and specificity. Nuclear imaging tests are chosen for providing high diagnostic accuracy but the major limitations are radi-ation exposure and lesser availability [2]. Dobutamine stress echocardiography is also a low cost and widely avail-able technique without radiation exposure, it has a high sensitivity and specificity similar to nuclear perfusion scin-tigraphy, but the need of expertise limits its use [3]. Des-pite NIIT, nonsignificant coronary lesions are not a rare finding in patients undergoing elective coronary angiog-raphy. In a recently published study, the rate of significant CAD in elective coronary angiograms was 38% [4].
Myocardial strain analysis by two dimensional speckle tracking echocardiography (2D STE) has a higher diagnos-tic accuracy in detecting left ventricular dysfunction. Re-cently published studies revealed lower values of deformation in patients with acute coronary syndrome, diabetes mellitus [5], hypertension [1], and SAP [6–12]. In addition to global longitudinal strain (GLS), layer-specific strain (LSS) analysis provides the assessment of each myo-cardial layer separately. Strain analysis of longitudinal endocardial layer can give more accurate data about LV function and early signs of ischemia because endocardium is more susceptible to ischemia.
The aim of the present study was to evaluate layer-specific GLS in patients with suspected SAP and normal left ventricular wall motion.
Methods
Patients who underwent diagnostic coronary angiog-raphy for SAP between January 2016 and January 2017 were screened from the electronic database. Patients with previous myocardial infarction, acute coronary syn-drome, a history of coronary intervention or coronary artery bypass graft surgery, moderate-to-severe valvular disease, heart failure, segmental wall motion abnormal-ities, atrial fibrillation, reduced ejection fraction, and with malignancy were all excluded.
Echocardiographic images were assessed for suitability by an experienced cardiologist who was blinded to the other imaging results of the patients. All of the echocar-diographic images were obtained using Vivid 7 Dimension or Vivid S70 systems (GE Healthcare, Horton, Norway) and imported to the EchoPAC workstation. Recordings with poor image quality that did not qualify for speckle tracking strain analysis were excluded. A total of 79 pa-tients with good quality 2D echocardiographic images suit-able for strain analysis, whose resting echocardiographic examination was performed within 1 week of the diagnos-tic coronary angiography were included in the study.
Conventional echocardiographic measurements were performed in accordance with the guidelines [13]. Biplane left ventricle ejection fraction was calculated using the modified Simpson method. End-systolic and end-diastolic diameters, and septal and posterior wall thickness were measured from the parasternal long axis view using M-mode. The diameter of the left atrium was measured using M-mode from the parasternal long view. Two-dimensional speckle tracking strain analysis was performed by an experienced cardiologist according to the guidelines [14] from the recorded 2D grayscale images using Echopac software, without clinical knowledge of the patients. Cine-loop recorded, three beats of 2D images from 3 apical views (apical 2 chamber, 4 chamber and ap-ical long axis views) with frame rates of 50–80 frames/s were accepted as suitable for strain analysis. In each view, regions of interests were outlined by defining one point on each side of the mitral annulus and one point at the apex. Then, the software automatically traced the borders of the LV myocardium; manual adjustments were made if necessary. Images with poor tracking quality and with more than one untrackable segments were excluded. After manual adjustments, the software calculated strain values in each view. End-systole was defined as aortic valve clos-ure in the apical long axis view. A 17-segment bull’s eye view was formed after processing all three apical views. GLS-trans, endocardial, and epicardial values (GLS-trans, GLS-endo, and GLS-epi, respectively) were calculated automatically by the software. Regional longitudinal strain (RLS) was also calculated for all layers, based on the 17 segment model according to the perfusion territories of 3 major coronary arteries by averaging all segments peak strain values within each territory [15].
Intra-observer reliability was assessed by re-analyzing the images of 15 patients 30 days after the first analysis by the same operator. Inter-observer reliability assessment was performed by comparing the measurements of 15 ran-domly chosen patients, performed by another operator.
were classified as the CAD group, and those without sig-nificant CAD were classified as the control group.
The study was conducted in accordance with Declar-ation of Helsinki and was approved by the local ethics committee.
Statistical analysis
Statistical analysis was performed using IBM SPSS version 22 (IBM SPSS Statistics for Windows, Armonk, NY, IBM Corp). Categorical variables are expressed as numbers and percentages and continuous variables are expressed as mean ± standard deviation. The Kolmogorov-Smirnov test was used to assess the distribution of variables. Continu-ous variables were compared using the independent sam-ples t-test or Mann-Whitney U test. Categorical values were compared using the Chi-square (χ2) test or Fisher’s exact test. The areas under the Receiver operating charac-teristics (ROC) curves and their area under the curve (AUC) were constructed for layer-specific GLS and RLS. Inter- and intra-observer reliability were evaluated using Bland-Altman analysis and intra-class correlation. A value ofP< .05 was accepted as significant.
Results
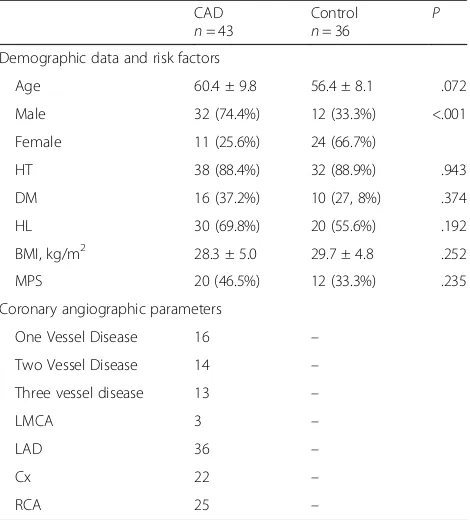
In total, 79 patients suspected of having stable coronary artery disease were included in the study; 36 without sig-nificant CAD (control group) and 43 patients with signifi-cant CAD (CAD group). The clinical data of the of the study population are given in Table1. The ratio of female patients was higher in the control group [n= 24 (66.7%) vs.n= 11 (25.6%),P< .001]. There were no differences be-tween the groups in terms of HT, DM, hyperlipidemia [16], and body mass index (BMI). Twelve (33.3%) of the patients in the control group had MPS, and 20 (46.5%) of the patients in the CAD group had MPS before CAG (p= 0.235). Most (83.4%) of the patients in the CAD group had LAD lesions.
Conventional echocardiographic measures and strain values are presented in Table 2. Layer-specific strain measurements were all lower in the CAD group (GLS-trans: −18.2 ± 2.4% vs. -22.2 ± 2.2%, P< .001; GLS-endo: −20.8 ± 2.8% vs. -25.3 ± 2.6%, P< .001; GLS-epi:−15.9 ± 2.4% vs. -19.5 ± 1.9%,P< .001) (Table2). A comparison of the difference between GLS-endo and GLS-epi revealed a lesser amount of difference in the CAD group (GLS-endo-epi, 5.0 ± 1.1 vs. 5.7 ± 1.2, P = .007). RLS values are given in Table3, all layers in major coronary artery territories demonstrated significantly lower deformation values in patients with significant stenosis.
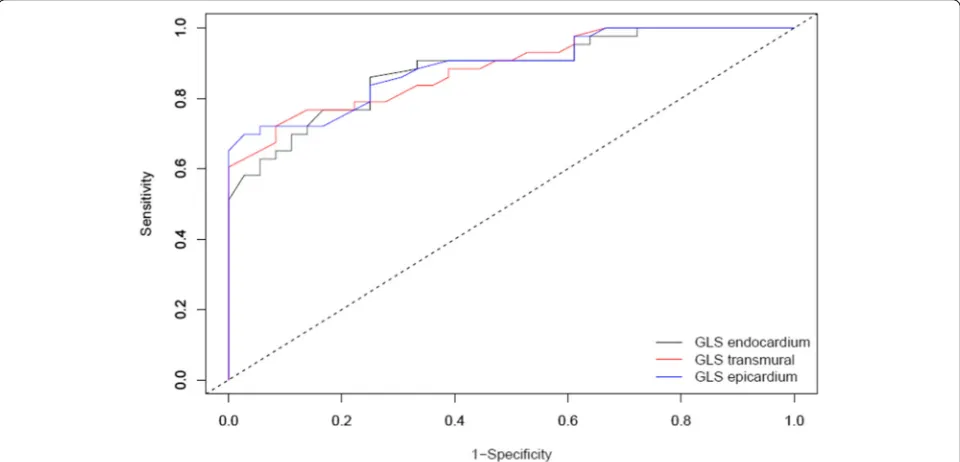
ROC curves were constructed for layer-specific GLS in patients with CAD (Fig.1). The diagnostic performance of GLS-trans, GLS-endo and GLS-epi were all significant. The cut-off values for GLS-trans, GLS-endo and GLS-epi were−19.3%,−23.4% and−17.3%, respectively (Table 4).
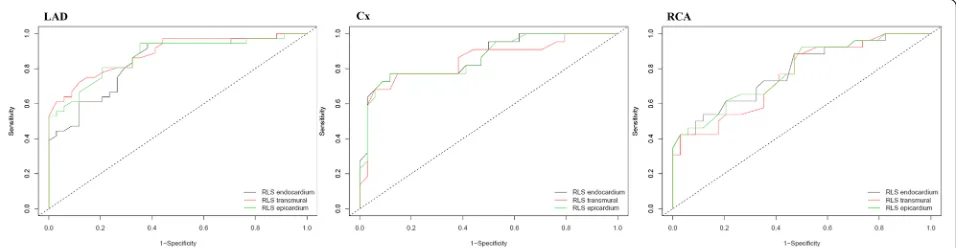
After multivariate adjustment (age, sex, BMI, HT, DM, GLS-endo, GLS-epi and GLS transmural) GLS-trans was found as the only independent predictor of CAD [OR:0.472, CI (0.326–0.684), p< .001]. ROC curves for layer-specific RLS were shown in Fig.2and the analysis of
Table 1Clinical and angiographical characteristic of the patients
CAD
n= 43
Control
n= 36 P
Demographic data and risk factors
Age 60.4 ± 9.8 56.4 ± 8.1 .072 Male 32 (74.4%) 12 (33.3%) <.001 Female 11 (25.6%) 24 (66.7%)
HT 38 (88.4%) 32 (88.9%) .943 DM 16 (37.2%) 10 (27, 8%) .374 HL 30 (69.8%) 20 (55.6%) .192 BMI, kg/m2 28.3 ± 5.0 29.7 ± 4.8 .252
MPS 20 (46.5%) 12 (33.3%) .235 Coronary angiographic parameters
One Vessel Disease 16 – Two Vessel Disease 14 – Three vessel disease 13 –
LMCA 3 –
LAD 36 –
Cx 22 –
RCA 25 –
BMIBody-mass index,CADCoronary artery disease,CxCircumflex artery,
DMDiabetes Mellitus,HLHyperlipidemia,HTHypertension,LADLeft anterior descending artery,LMCALeft main coronary artery,MPSMyocardial perfusion scintigraphy,RCARight coronary Artery
Table 2Conventional echocardiographic parameters and longitudinal strain values
CAD
n= 43
Control
n= 36
P
Echocardiogphic parameters
LV EF, % 65.4 ± 5.3 66.4 ± 4.8 .426 LV EDD, mm 47.5 ± 4.8 47.9 ± 5.1 .737 LV ESD, mm 30.7 ± 4.8 30.9 ± 4.4 .933 LV mass, g/m2 98.7 ± 18.5 92.0 ± 22.5 .115 LA diameter, mm 38.7 ± 3.7 37.1 ± 2.9 .030 E/e’ 8.7 ± 1.7 8.2 ± 1.4 .413 2D Global longitudinal strain (GLS) parameters
GLS transmural, % −18.2 ± 2.4 −22.2 ± 2.2 <.001 GLS endocardium, % −20.8 ± 2.8 −25.3 ± 2.6 <.001 GLS epicardium, % −15.9 ± 2.4 −19.5 ± 1.9 <.001 GLS endo-epi 5.0 ± 1.1 5.7 ± 1.2 .007
CADCoronary artery disease,EDDEnd-diastolic diameter,EFEjection fraction,
ESDEnd-systolic diameter,EPulsed wave transmitral early diastolic velocity,
e’Early myocardial diastolic velocity,GLSGlobal longitudinal strain,
the curves with AUC were presented in Table5. RLSLAD
and RLSCxhad better predictive power for the detection
of significant stenosis in the coronary artery supplying the associated territory, there were no differences between layers in terms of predictive value. (Table5).
Patients with MPS were grouped as MPS true-positive and MPS false-positive. A comparison of these two groups demonstrated lower strain values in all layers in the true-positive MPS group (GLS-trans:−17.7 ± 2.4 vs. -21.9 ± 2.4%,
P< .001; GLS-endo:−20.2 ± 2.9% vs. -24.9 ± 2.9%,P< .001; GLS-epi: 15.4 ± 2.6% vs. -19.2 ± 1.8%, P< .001) (Table 6). Layer- specific strain analysis was compared between the
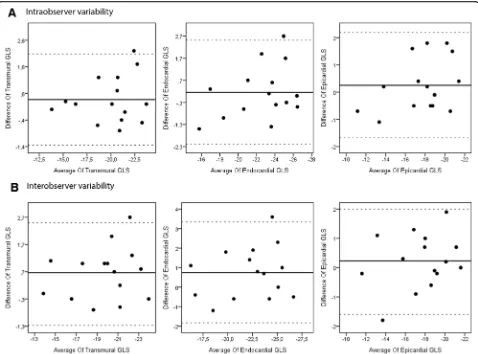
sexes in both groups. There were no significant differences in terms of GLS between the sexes in both groups (Table7). Intra-class correlation and Bland-Altman analysis (Fig. 3) was used for the evaluation of intra- and inter-observer variability. Intra-observer reliability, as assessed by inter-class correlation coefficients for GLS-trans, GLS-endo, and GLS-epi were 0.957 (95% CI: 0.876–0.985), 0.937 (95% CI: 0.822–0.978), and 0.945 (95% CI: 0.844–0.990), respectively. Inter-observer reli-ability, as assessed by inter-class correlation coefficients for GLS-trans, GLS-endo, and GLS-epi were 0.950 (95% CI: 0.857–0.983), 0.920 (95% CI: 0.779–0.972), and 0.951 (95% CI: 0.860–0.983), respectively.
Discussion
The current study demonstrated that GLS was signifi-cantly reduced in patients with stable CAD. LSS analysis revealed that all myocardial layers were affected in pa-tients with significant CAD.
Evaluation of left ventricular function and wall motion analysis with conventional 2D echocardiography mostly fails to provide additional information, particularly when there is no history of prior myocardial infarction or struc-tural heart disease. 2D speckle tracking strain analysis is a semi-automated technique that is more sensitive and ac-curate in measuring LV function than conventional 2D methods. Recently published studies demonstrated that longitudinal myocardial strain imaging with 2D speckle tracking had a diagnostic and prognostic value in patients with acute coronary syndromes [7, 17], and it has also been demonstrated as an independent predictor of signifi-cant CAD in patients with SAP [11]. Liou et al. [18]
Fig. 1Receiver operating curves demonstrating value of layer-specific GLS for the diagnosis of CAD. Legends: GLS = Global longitudinal strain Table 3Regional longitudinal strain values
CAD Control P LAD
RLS transmural, % −18.1 ± 2.4 −22.4 ± 2.7 <.001 RLS endocardium,% −22.1 ± 3.3 −26.7 ± 3.5 <.001 RLS epicardium, % −15.2 ± 2.4 −19.2 ± 2.3 <.001 Cx
RLS transmural, % −16.6 ± 3.2 −21.2 ± 2.8 <.001 RLS endocardium,% −18.8 ± 3.4 −24.2 ± 3.3 <.001 RLS epicardium, % −14.8 ± 3.1 −19.0 ± 2.5 <.001 RCA
RLS transmural, % −19.2 ± 3.0 −22.7 ± 3.1 <.001 RLS endocardium,% −21.3 ± 3.2 −25.0 ± 3.2 <.001 RLS epicardium, % −17.7 ± 2.9 −20.8 ± 2.8 0.001
claimed that GLS could be an early marker of CAD in symptomatic patients. Stankovic et al. [5] demonstrated that strain imaging was superior to visual assessment in the detection of LAD stenosis. In line with these studies, we also demonstrated reduced transmural GLS in patients with significant CAD.
Although studies have been published showing the ef-ficacy of GLS in detecting LV dysfunction with resting TTE examination [5, 12, 19], there are limited data about LSS imaging in stable CAD. LSS analysis allows us to assess each layer of the myocardium separately. Lon-gitudinal endocardial strain is expected to be the most sensitive parameter for detecting significant CAD be-cause ischemia initially affects the endocardium, indicat-ing that LSS could provide additional information in patients suspected SAP. Multi-layer strain imaging has been assessed in patients with non-ST elevation acute coronary syndromes and the results indicated that it could be useful in identifying patients with significant CAD [6, 20]. The correlation of fractional flow reserve (FFR) values and regional LSS was investigated in a retrospective study in patients with SAP [21]. The re-sults demonstrated lower transmural and endocardial longitudinal strain values in lesions with FFR < 0.75. A recently published study assessed LSS in patients with reversible ischemia using MPS [22]. In conclusion, the study revealed that all layers of the myocardium were af-fected in patients with significant CAD and claimed that both GLS and LSS could increase the diagnostic accur-acy of single-photon emission computed tomography (SPECT) imaging. Similarly, in the present study we also investigated patients who underwent elective coronary
angiography with suspected SAP. Our results were also in agreement with the study by Hagemann et al. [22], demonstrating that transmural, endocardial, and epicar-dial longitudinal strain (LS) values were all lower in pa-tients with CAD compared with the control group. Additionally, in the current study, patients with true-positive and false-positive MPS were also compared and in line with the above-mentioned study, strain values were lower in all layers in patients with true-positive MPS (Table 6) [22]. Although it’s hard to draw a definite conclusion with this limited number of patients, these results also imply that 2D strain imaging might improve the diagnostic value of SPECT imaging, however, further prospective studies are needed.
Since endocardial thickening and shortening with sys-tole is greater than epicardial changes, the deformation rate normally decreases from endocardium to epicar-dium [23–25]. In the current study, in parallel with the abovementioned studies, the gradient in strain values from endocardium to epicardium was apparent in both groups, whereas it was significantly lower in patients with significant CAD, indicating a higher reduction in the endocardial layer (Table2).
In patients with CAD, ischemia extends from endocar-dium to epicarendocar-dium. Initially subendocardial area is af-fected and endocardial LS deteriorates before epicardial LS abnormalities become apparent [21]. In line with other studies, the present study demonstrated that, in addition to endocardial and transmural LS, epicardial LS values had also reduced in CAD patients [6,22,26]. It should be noted that although the deformation among the layers of the myocardium is heterogeneous, it’s not independent
Fig. 2Receiver operating curves demonstrating diagnostic value of regional longitudinal strain for LAD, Cx and RCA. Legends: LAD: Left anterior descending artery, Cx: Circumflex artery, RCA: Right coronary artery, RLS: Regional longitudinal strain
Table 4Analysis of receiver operating characteristic curves and cut-off values for layer-specific global longitudinal strain
AUC (95% CI) Cut-off value Sensitivity Specifity P-value GLS transmural 0.891 (0.823–0.954) −19.3% 69.8% 97.2% <.001 GLS endocardium 0.881 (0.808–0.905) −23.4% 86.0% 75.0% <.001 GLS epicardium 0.885 (0.815–0.955) −17.3% 72.1% 91.7% <.001
from each other. Despite layered structure, the structural integrity of myocardium causes any deformation in one layer to affect the adjacent tissue. The deformation of one layer consists of active function of the layer and passive function from the adjacent layer. Furthermore, CAD se-verity and lack of collaterals, particularly in the presence of occluded coronary arteries, affect the extend of ische-mia from endocardium to epicardium.
Although the ROC curve analysis demonstrated that transmural, endocardial and epicardial GLS had a value in the diagnosis of significant CAD (Fig.1.), after multi-variable regression analysis, only transmural GLS stayed independently associated with CAD. In contrast to the present study, endocardial layer was independently asso-ciated with CAD in the studies by Sarvari et al. [26] and Zhang et al. [6]. Additionally, as distinct from these studies, Hagemann et al. [22] claimed that epicardial and mid-myocardial GLS were better predictors of CAD.
Layer-specific RLS was also assessed in addition to GLS. Since CAD causes segmental wall motion abnormalities, RLS analysis sounds reasonable but there’s limited data. Liu et al. [20] demonstrated that endocardial GLS and RLSLADhad higher accuracy in identifying LAD stenosis.
In the current study, ROC curves for LAD, Cx and RCA territories demonstrated that transmural, endocardial and epicardial LS had diagnostic value but RLSLADand RLSCx
had better discriminative power than RLSRCA(Fig.2) On
the contrary, due to lack of segmental reference values, and higher inter-vendor variabilities, guidelines do not
recommend strict RLS analysis [13,27]. The mismatch be-tween RLS and the specific territory of diseased coronary artery can be explained by the anatomical changes in the course of coronary arteries, and microvascular connec-tions causing zones of dual arterial perfusion. Further-more, it has also been shown that remote areas not supplied by stenotic coronary arteries had also lower strain values than control subjects [20].
Normal values for GLS and LSS have not been standard-ized yet. Inter-vendor variability, age and sex related changes in strain values are the main factors preventing the determination of cut-off value. It’s recommended to use the same software and vendor-specific normal refer-ence values for interpretation [28,29]. Marwick et al. [30] used the same vendor as we did and demonstrated an average GLS of−18.6 ± 0.1%. Takidiki et al. assessed nor-mal range of 2D LS and compared three vendors (−21.3 ± 2.1% vs−18.9 ± 2.5% vs−19.9 ± 2.4,p< .001). Recently three studies, using the same vendor as we used, were published investigating the normal values of longitudinal LSS [23–25]. Nakata et al. [24] defined the normal values for transmural, endocardial and epicardial GLS as −20.0 ± 2.0%, −23.1 ± 2.3% and−17.6 ± 1.9%, respectively, whereas the values found by Alcidi et al. for all layers were−22.7 ± 1.8%, −25.4 ± 2.1% and−21.1 ± 1.8%, re-spectively. Shi et al. [23] also identified similar values for all layers (−21.3 ± 2.9%, −24.3 ± 3.1%, and−18.9 ± 2.8%, respectively). In aggreement with these studies the cut-off values for GLS-trans, GLS-endo and GLS-epi were similar to the normal values abovementioned (−19.3%, −23.4% and−17.3%, respectively).
There are numerous factors such as age, sex, DM, and HT that can affect longitudinal strain. Tadic et al. [31] demonstrated that patients with non-complicated DM and HT also had impaired LV longitudinal strain. In the present study, the rates of DM and HT were similar in both groups. However, the ratio of female patients was higher in the normal coronary angiography group, similar
Table 7Global lonigtudinal strain in female vs male patients
Control Group
Variable Female
n= 24
Male
n= 12
P GLS transmural, % −22.5 ± 2.4 −21.6 ± 1.8 .235 GLS endocardium, % −25.6 ± 2.8 −24.6 ± 2.1 .284 GLS epicardium, % −19.9 ± 2.0 −19.1 ± 1.6 .250 Coronary Artery Disease Group
Variable Female
n= 11
Male
n= 32
P GLS transmural, % −18.5 ± 2.6 −18.1 ± 2.4 .664 GLS endocardium, % −21.0 ± 3.2 −20.8 ± 2.8 .790 GLS epicardium, % −15.9 ± 2.9 −15.9 ± 2.3 .949
GLSGlobal longitudinal strain
Table 6Layer specific GLS values in myocardial perfusion true positive vs false positive patients
Variable MPS true positive
n= 20
MPS false positive
n= 12 P
GLS transmural, % −17.7 ± 2.4 −21.9 ± 2.4 <.001 GLS endocardium, % −20.2 ± 2.9 −24.9 ± 2.9 <.001 GLS epicardium, % −15.4 ± 2.6 −19.2 ± 1.8 <.001
GLSGlobal longitudinal strain,MPSMyocardial perfusion scintigraphy Table 5Analysis of receiver operating characteristic curves for layer-specific regional longitudinal strain
AUC (95%CI) P-value RLSLADtransmural 0.871 (0.787–0.954) <.001
RLSLADendocardium 0.839 (0.746–0.931) <.001
RLSLADepicardium 0.885 (0.808–0.962) <.001
RLSCxtransmural 0.862 (0.762–0.964) <.001
RLSCxendocardium 0.866 (0.767–0.966) <.001
RLSCxepicardium 0.848 (0.736–0.961) <.001
RLSRCAtransmural 0.783 (0.667–0.899) <.001
RLSRCAendocardium 0.784 (0.667–0.900) <.001
RLSRCAepicardium 0.758 (0.636–0.880) 0.003
to previous studies. In the study by Sorenson et al. [11], the rate of male patients was 75% vs. 35% in patients with and without significant CAD, respectively. Previous studies have reported different results about the effect of sex on LSS parameters. Nakata et al. [24] and Shi et al. [23] dem-onstrated that female patients tended to have higher strain values compared with men, whereas Alcidi et al. [25] could not show a sex-specific difference. Although the results of the studies are conflicting, this difference can be attributed as a confounding factor. However, when we analyzed both groups separately in terms of sex and GLS, the results demonstrated that strain values did not differ between the sexes (Table7).
Limitations
The present study has several limitations. First, the retrospective nature of this study may have caused a loss of data and selection bias. Secondly, this is a small-scale study with a limited number of patients. As in all studies based on echocardiography, image quality and operator experience have a great effect on proper analysis.
Randomized, prospective, multicenter, larger scale stud-ies powerful enough to assess the effect of all confound-ing factors are needed to overcome these limitations.
Conclusion
Resting layer-specific LS as assessed by 2D speckle tracking analysis demonstrated that GLS values were reduced in all layers of the myocardium in patients with SAP and with no wall motion abnormalities. These results indicate that GLS can improve the identification of patients with signifi-cant CAD but further studies are needed to put forth the incremental value of LSS analysis over transmural GLS.
Abbreviations
2D STE:Two dimensional speckle tracking echocardiography; AUC: Area under the curve; CAD: Coronary artery disease; Cx: Circumflex artery; DM: Diabetes Mellitus; ECG: Electrocardiography; GLS: Global longitudinal strain;
HT: Hypertension; LAD: Left anterior descending artery; LS: Longitudinal strain; LSS: Layer-specific strain; MPS: Myocardial perfusion scintigraphy;
NIIT: Noninvasive imaging techniques; RCA: Right coronary artery; RLS: Regional longitudinal strain; ROC: Receiver operating characteristics; SAP: Stable angina pektoris; TTE: Transthoracic echocardiography
Availability of data and materials
The datasets supporting the conclusions of the study are included within the article. Any additional data will be available on request.
Authors’contributions
MAY, FMU conducted the patients’enrolment, data collection and
echocardiographic imaging. Both authors read and approved the final manuscript.
Ethics approval and consent to participate
This study was submitted to and approved by the Local Ethics Commission.
Consent for publication
Not applicable.
Competing interests
The authors declare that they have no competing interests.
Publisher’s Note
Springer Nature remains neutral with regard to jurisdictional claims in published maps and institutional affiliations.
Received: 30 July 2018 Accepted: 12 September 2018
References
1. Task Force M, Montalescot G, Sechtem U, Achenbach S, Andreotti F, Arden
C, Budaj A, Bugiardini R, Crea F, Cuisset T, et al. 2013 ESC guidelines on the management of stable coronary artery disease: the task force on the management of stable coronary artery disease of the European Society of
Cardiology. Eur Heart J. 2013;34(38):2949–3003.
2. Buechel RR, Kaufmann BA, Tobler D, Wild D, Zellweger MJ. Non-invasive
nuclear myocardial perfusion imaging improves the diagnostic yield of invasive
coronary angiography. Eur Heart J Cardiovasc Imaging. 2015;16(8):842–7.
3. Sicari R, Cortigiani L. The clinical use of stress echocardiography in ischemic
heart disease. Cardiovasc Ultrasound. 2017;15(1):7.
4. Patel MR, Peterson ED, Dai D, Brennan JM, Redberg RF, Anderson HV, Brindis
RG, Douglas PS. Low diagnostic yield of elective coronary angiography. N
Engl J Med. 2010;362(10):886–95.
5. Stankovic I, Putnikovic B, Cvjetan R, Milicevic P, Panic M, Kalezic-Radmili T,
Mandaric T, Vidakovic R, Cvorovic V, Neskovic AN. Visual assessment vs. strain imaging for the detection of critical stenosis of the left anterior descending coronary artery in patients without a history of myocardial
infarction. Eur Heart J Cardiovasc Imaging. 2015;16(4):402–9.
6. Zhang L, Wu WC, Ma H, Wang H. Usefulness of layer-specific strain for
identifying complex CAD and predicting the severity of coronary lesions in patients with non-ST-segment elevation acute coronary syndrome:
compared with syntax score. Int J Cardiol. 2016;223:1045–52.
7. Caspar T, Samet H, Ohana M, Germain P, El Ghannudi S, Talha S, Morel O,
Ohlmann P. Longitudinal 2D strain can help diagnose coronary artery disease in patients with suspected non-ST-elevation acute coronary syndrome but apparent normal global and segmental systolic function. Int J
Cardiol. 2017;236:91–4.
8. Bendary A, Tawfeek W, Mahros M, Salem M. The predictive value of global
longitudinal strain on clinical outcome in patients with ST-segment elevation myocardial infarction and preserved systolic function.
Echocardiography. 2018;35(7):915–21.
9. Zuo H, Yan J, Zeng H, Li W, Li P, Liu Z, Cui G, Lv J, Wang D, Wang H.
Diagnostic power of longitudinal strain at rest for the detection of obstructive coronary artery disease in patients with type 2 diabetes mellitus.
Ultrasound Med Biol. 2015;41(1):89–98.
10. Huang H, Ruan Q, Lin M, Yan L, Huang C, Fu L. Investigation on left
ventricular multi-directional deformation in patients of hypertension with different LVEF. Cardiovasc Ultrasound. 2017;15(1):14.
11. Biering-Sorensen T, Hoffmann S, Mogelvang R, Zeeberg Iversen A, Galatius
S, Fritz-Hansen T, Bech J, Jensen JS. Myocardial strain analysis by 2-dimensional speckle tracking echocardiography improves diagnostics of coronary artery stenosis in stable angina pectoris. Circ Cardiovasc Imaging.
2014;7(1):58–65.
12. Moustafa S, Elrabat K, Swailem F, Galal A. The correlation between speckle
tracking echocardiography and coronary artery disease in patients with
suspected stable angina pectoris. Indian Heart J. 2018;70(3):379–86.
13. Lang RM, Badano LP, Mor-Avi V, Afilalo J, Armstrong A, Ernande L,
Flachskampf FA, Foster E, Goldstein SA, Kuznetsova T, et al.
Recommendations for cardiac chamber quantification by echocardiography in adults: an update from the American Society of Echocardiography and the European Association of Cardiovascular Imaging. Eur Heart J Cardiovasc
Imaging. 2015;16(3):233–70.
14. Voigt JU, Pedrizzetti G, Lysyansky P, Marwick TH, Houle H, Baumann R, Pedri
S, Ito Y, Abe Y, Metz S, et al. Definitions for a common standard for 2D speckle tracking echocardiography: consensus document of the EACVI/ASE/ industry task force to standardize deformation imaging. Eur Heart J
Cardiovasc Imaging. 2015;16(1):1–11.
15. Cerqueira MD, Weissman NJ, Dilsizian V, Jacobs AK, Kaul S, Laskey WK,
Pennell DJ, Rumberger JA, Ryan T, Verani MS, et al. Standardized myocardial segmentation and nomenclature for tomographic imaging of the heart. A statement for healthcare professionals from the cardiac imaging Committee of the Council on clinical cardiology of the American Heart Association.
Circulation. 2002;105(4):539–42.
16. Trobs M, Achenbach S, Plank PM, Marwan M, Rother J, Klinghammer L,
Blachutzik F, Schlundt C. Predictors of technical failure in Transradial
coronary angiography and intervention. Am J Cardiol. 2017;120(9):1508–13.
17. Meimoun P, Abouth S, Clerc J, Elmkies F, Martis S, Luycx-Bore A, Boulanger
J. Usefulness of two-dimensional longitudinal strain pattern to predict left ventricular recovery and in-hospital complications after acute anterior myocardial infarction treated successfully by primary angioplasty. J Am Soc
Echocardiogr. 2015;28(11):1366–75.
18. Liou K, Negishi K, Ho S, Russell EA, Cranney G, Ooi SY. Detection of
obstructive coronary artery disease using peak systolic global longitudinal strain derived by two-dimensional speckle-tracking: a systematic review and
meta-analysis. J Am Soc Echocardiogr. 2016;29(8):724–35 e724.
19. Hubbard RT, Arciniegas Calle MC, Barros-Gomes S, Kukuzke JA, Pellikka PA,
Gulati R, Villarraga HR. 2-dimensional speckle tracking echocardiography predicts severe coronary artery disease in women with normal left ventricular function: a case-control study. BMC Cardiovasc Disord. 2017;17(1):231.
20. Liu C, Li J, Ren M, Wang ZZ, Li ZY, Gao F, Tian JW. Multilayer
longitudinal strain at rest may help to predict significant stenosis of the left anterior descending coronary artery in patients with suspected non-ST-elevation acute coronary syndrome. Int J Cardiovasc Imaging.
2016;32(12):1675–85.
21. Nishi T, Funabashi N, Ozawa K, Takahara M, Fujimoto Y, Kamata T, Kobayashi
Y. Resting multilayer 2D speckle-tracking transthoracic echocardiography for the detection of clinically stable myocardial ischemic segments confirmed by invasive fractional flow reserve. Part 1: vessel-by-vessel analysis. Int J
Cardiol. 2016;218:324–32.
22. Hagemann CE, Hoffmann S, Olsen FJ, Jorgensen PG, Fritz-Hansen T, Jensen
JS, Biering-Sorensen T. Layer-specific global longitudinal strain reveals impaired cardiac function in patients with reversible ischemia.
Echocardiography. 2018;35(5):632–42.
23. Shi J, Pan C, Kong D, Cheng L, Shu X. Left ventricular longitudinal and
circumferential layer-specific myocardial strains and their determinants in
healthy subjects. Echocardiography. 2016;33(4):510–8.
24. Nagata Y, Wu VC, Otsuji Y, Takeuchi M. Normal range of myocardial
layer-specific strain using two-dimensional speckle tracking echocardiography. PLoS One. 2017;12(6):e0180584.
25. Alcidi GM, Esposito R, Evola V, Santoro C, Lembo M, Sorrentino R, Lo Iudice
F, Borgia F, Novo G, Trimarco B, et al. Normal reference values of multilayer longitudinal strain according to age decades in a healthy population: A single-centre experience. Eur Heart J Cardiovasc Imaging. 2017;jex306. https://doi.org/10.1093/ehjci/jex306.
26. Sarvari SI, Haugaa KH, Zahid W, Bendz B, Aakhus S, Aaberge L, Edvardsen T.
Layer-specific quantification of myocardial deformation by strain echocardiography may reveal significant CAD in patients with non-ST-segment elevation acute coronary syndrome. JACC Cardiovasc Imaging.
2013;6(5):535–44.
27. Takeuchi M, Wu VC. Application of left ventricular strain to patients with
coronary artery disease. Curr Opin Cardiol. 2018;33(5):464–9.
28. Dohi K, Sugiura E, Ito M. Utility of strain-echocardiography in current clinical
practice. J Echocardiogr. 2016;14(2):61–70.
29. Farsalinos KE, Daraban AM, Unlu S, Thomas JD, Badano LP, Voigt JU.
Head-to-head comparison of global longitudinal strain measurements among nine different vendors: the EACVI/ASE inter-vendor comparison study. J Am
30. Marwick TH, Leano RL, Brown J, Sun JP, Hoffmann R, Lysyansky P, Becker M, Thomas JD. Myocardial strain measurement with 2-dimensional
speckle-tracking echocardiography:definition of normal range. JACC Cardiovasc
Imaging. 2009;2(1):80–4.
31. Tadic M, Cuspidi C, Vukomanovic V, Ilic S, Obert P, Kocijancic V, Celic V.
Layer-specific deformation of the left ventricle in uncomplicated patients with type 2