Development and evaluation of drug loaded controlled release mucoadhesive microcapsules using various polymers and techniques in management of type-2 diabetes
17
0
0
Full text
(2) 296. has been a topic of interest in the design of drug delivery systems to prolong the residence time of the dosage form in (gastrointestinal tract) GIT, which facilitates the intimate contact with the absorption surface to enhance the bioavailability of drugs. [1] Mucoadhesion is the process by which a natural or a synthetic polymer can be adhered to a (biological substrate) mucosal layer, and the phenomenon is known as mucoadhesion. The substrate possessing mucoadhesive property can help in devising a delivery system capable of delivering a drug for a prolonged period of time at a specific delivery site and offers several advantages over other oral controlled systems by virtue of prolongation of residence of the drug in GIT. Mucoadhesive microcapsules provide the needed continuous therapy in the management of type-2 diabetes with high margin of safety. [2, 3] Several studies have reported on controlled drug delivery systems in the form of tablets, films, patches, and gels for oral, buccal, nasal, ocular, and topical routes. Nateglinide is made available as many forms in the market like conventional and simple sustained release tablets, but microencapsulation is a technique used to deliver the medicament at controlled rate by targeting. Microcapsules have more advantages over conventional and simple sustained release tablet formulations, such as targeting, less dosing frequency, zero-order release and high margin of safety, which are not possible with the existing formulations. Amongst the polymers used for microencapsulation, alginate has gained much attention since it is non toxic, biodegradable and can be prepared by a safe technique avoiding organic solvents. Hence orifice-ionic gelation technique and emulsion-ionic gelation technique was developed as an alternative approach even though so many other techniques are available like single and double emulsification techniques, normal and interfacial polymerization, coacervation phase separation, spray drying, spray congealing, etc. [4] Diabetes is a clinically and genetically heterogeneous group of disorders/metabolic disorder affecting the metabolism of carbohydrates, lipids, and proteins. The characteristic feature of diabetes is an abnormal elevation in blood glucose levels (Hyperglycemia), is due to a deficiency of insulin secretion caused by. Int. J. Pharm & Ind. Res. Vol - 01. pancreatic β-cell dysfunction and/or insulin resistance in liver and muscle. Diabetes is a syndrome in which chronic hyperglycemia leads to long-term damage to various organs including the heart, eyes, kidneys, nerves, and vascular system. This high blood sugar produces the classical symptoms of Polyuria (frequent urination), polydipsia (increased thirst) and polyphagia (increased hunger). This metabolic dysregulation is often associated with alterations in adipocyte metabolism. The current classification of diabetes is based upon the pathophysiology of each form of the disease. Type-1 diabetes results from cellular mediated autoimmune destruction of pancreatic b-cells, usually leading to total loss of insulin secretion. Type-1 diabetes is usually present in children and adolescents, although some studies demonstrated 15% to 30% of all cases being diagnosed after 30 years of age. The lack of insulin production in patients with type 1 diabetes makes the use of exogenous insulin necessary to sustain life, hence the former name ‘‘insulindependent diabetes.’’ In the absence of insulin, these patients develop ketoacidosis, a life-threatening condition. Type-2 diabetes, previously called non– insulindependent diabetes, results from insulin resistance, which alters the use of endogenously produced insulin at the target cells. Type-2 patients have altered insulin production as well; however, autoimmune destruction of b-cells does not occur as it does in type-1, and patients retain the capacity for some insulin production. Because the type-2 patient still produces insulin, the incidence of ketoacidosis is very low compared to type-1 as insulin secretion becomes insufficient to compensate for insulin resistance. Although type-2 patients do not need insulin treatment to survive, insulin is often taken as part of the medical management of type-2 diabetes. [5] Nateglinide is a metglinide short-acting, pancreatic, beta-cell-selective, KATP potassium channel blocker that improves overall glycemic control in type-2 diabetes. Although nateglinide's mechanism of action is related to that of sulphonyl-ureas, important differences do exist. Nateglinide binds rapidly to the sulfonylurea SUR1 receptor with a relatively low affinity, and it dissociates from it extremely rapidly in a manner of seconds. This rapid association and dissociation gives nateglinide a unique "fast on-fast. Issue - 04. Oct – Dec 2011.
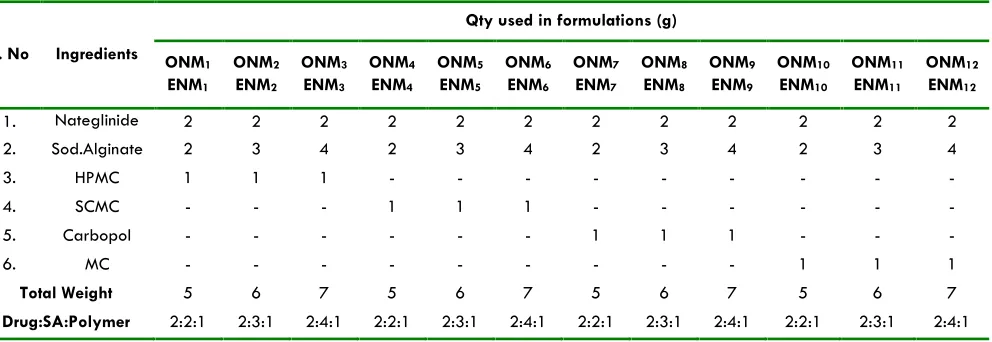
(3) 297. off" effect. Thus, nateglinide has a rapid onset and short duration of action on beta cells in stimulating insulin secretion in vivo and providing good control of postprandial hyperglycemia when taken immediately prior to meals. This hypoglycemic effect of nateglinide leads to improved glycemic control, while the short duration avoids delayed hyperinsulinemia and hypoglycemia after meals. Nateglinide is not a sulfonylurea, but it shares the mechanism of action of commonly used oral hypoglycemic agents such as glibenclamide and glipizide. Like the recently introduced, short-acting agent, repaglinide, it does not incorporate a sulfonylurea moiety. Compounds with such a profile should not only achieve improved overall glucose control, but also reduce the risk of vascular complications which is the most important feature of nateglinide. Nateglinide is both effective and well tolerated in the treatment of type-2 diabetes. The reported overall profile of adverse effects appears to be superior to that of other KATP potassium channel blockers, the glucose modulator metformin and PPARgamma agonists such as troglitazone. Clinical comparisons of these agents have shown nateglinide to be more effective in attenuating postprandial glucose than any other oral hypoglycemic agent, and that treatment with nateglinide provides effects that afford improved control of plasma glucose levels. The administration regimen for nateglinide, immediately prior to meals, also facilitates patient compliance. [6] There are numerous drugs for treating type-2 diabetes, the objective of the present work was to develop, characterize (pre- and post-formulation parameters) nateglinide mucoadhesive microcapsules by following orifice-ionic gelation and emulsion-ionic gelation techniques using (Sod. Alginate) SA as the release rate retarding polymer, with (sodium carboxy methylcellulose) Sodium CMC, (hydroxypropyl methylcellulose) HPMC, Carbopol and (methylcellulose) MC as mucoadhesive polymers. And, to study the influence of techniques, mucoadhesive polymers and sodium alginate on physical and release properties of prepared microcapsules. Sod. CMC, HPMC, carbopol and MC are economic and easily available synthetic hydrophilic polymers and these can be extensively used for designing mucoadhesive delivery systems due to their ability to exhibit strong hydrogen bonding with the mucin present in the mucosal layer as compared to. Int. J. Pharm & Ind. Res. Vol - 01. thiolated polymers, lectin-based polymers and other natural polymers. Basically, polymers of natural source containing polysaccharides, carbohydrates and cystine are be less stable as compared to those containing synthetic polymers as these are highly prone for microbial-degradation.[7]. Materials and Method Nateglinide pure drug was obtained as a gift sample from M/s Hetero Drugs Ltd., Hyderabad, (Andhra Pradesh, India). HPMC, Sod. CMC, Carbopol and MC were procured from M/s Central Drug House (P) Ltd., (New Delhi, India). SA (having a viscosity of 5.5 cps in a 1% w/v aqueous solution at 25 OC), calcium chloride and petroleum ether were procured from M/s S. D. Fine Chemicals Pvt. Ltd., Mumbai, (Maharastra, India). Preparation of Nateglinide Mucoadhesive Microcapsules Nateglinide mucoadhesive microcapsules were prepared by employing SA as the coat material in combination with four mucoadhesive polymers such as HPMC, Sod. CMC, Carbopol and MC (drug:SA:polymer at ratios 2:2:1, 2:3:1 and 2:4:1) by following orificeionic gelation technique (OIGT) and emulsion-ionic gelation technique (EIGT) [8-11] Orifice-ionic gelation technique (OIGT): SA (2.0 g, 3.0 g and 4.0 g) and the mucoadhesive polymer (1.0 g) were dissolved in purified water (25 ml) to form a homogenous polymer solution to which core material; nateglinide (2.0 g) was added and mixed thoroughly to get smooth viscous dispersion. The resulting dispersion was then added drop wisely into 200 ml calcium chloride (10% w/v) solution through a syringe with a needle of No. 22 size. The added droplets were retained in the calcium chloride solution for 15 min to complete the curing reaction and to produce spherical rigid microcapsules. The microcapsules were separated by decantation and the product was washed with petroleum ether to remove water and dried at 45º C for 12 h. The prepared formulations were named as ONM1 – ONM12 (Table 1). Emulsionionic gelation technique (EIGT): SA (2.0 g, 3.0 g and 4.0 g) and the mucoadhesive polymer (1.0 g) were dissolved in purified water (25 ml) to form a homogenous polymer solution to which core material;. Issue - 04. Oct – Dec 2011.
(4) 298. nateglinide (2.0 g) was added and mixed thoroughly to get smooth viscous dispersion (Table 1). The viscous aqueous dispersion was then extruded through a syringe needle 23# into 200 ml of light liquid paraffin containing 1.5% span-80 and 0.2% glacial acetic acid being kept under magnetic stirring (Remi MS-301) at 500 rpm to undergo emulsification which then led to form spheres dispersed. 200 ml of (10% w/v) calcium chloride solution was poured with continuous stirring, by which the formed spheres were exposed towards the calcium chloride. The formed spheres were allowed to keep as such for 30 min to finish curing process. The microcapsules were then decanted and washed with petroleum ether to remove liquid paraffin and water and dried at 45º C for 12 h. The prepared formulations were named as ENM1 – ENM12 (Table 1). The stated ratios were fixed as per the results obtained in manual optimization of SA and mucoadhesive polymer. When drug:SA:polymer was less than 2:2:1, the formulation was found to disintegrate within a short time, and when the ratio was more than 2:4:1, the dosage form weight was. Mean Particle Size . increased to more than 1100 mg, making it difficult to fill in a capsule and the release was also retarded for more than 24 h. When the ratio of mucoadhesive polymer was decreased less than the fixed ratio formulations became non-adhesive, and when it was increased more than the fixed ratio, all the microcapsules became sticky and this also led to drying problem. Evaluation of Prepared Microcapsules Particle size analysis All the batches prepared were analyzed for particle size where the microcapsules were placed on a set of standard sieves ranging from sieve No. 16# to 60#, using an electromagnetic sieve shaker (Electro Lab, EMS-8). The sieves were arranged in such a way that they were in a descending order with the mesh size 16# on the top and 60# mesh in the bottom. The microcapsules passed through the set of sieves and the amount retained on each sieve was weighed and the average mean diameter was determined and considered as mean particle size: [12]. Mean Particle Size of the Fraction X Weight Fraction …. (1) Weight Fraction . Bulk density Accurately weighed microcapsules (M) were transferred into a 100 ml graduated cylinder to measure the apparent volumes or bulk volume (V b). The measuring cylinder was tapped for a fixed period of. Bulk Density (ρ b ) . time and tapped volume (Vt) occupied in the cylinder was measured. The bulk density and tapped/true density were calculated in gram per milliliter by the following formula: [13]. Weight of Microcapsules (g) (M) …. (2) Bulk Volume (ml) (Vb ). True/Tapped Density (ρ t ) . Weight of Microcapsules (g) (M) …. (3) Tapped Volume (ml) (Vt ). where, M = mass of the powder, Vb = bulk volume of the powder and Vt = tapped volume of the powder. Carr’s index and Hausner’s ratio The static angle of repose was measured according to the fixed funnel and free standing cone method. The bulk density of the mixed microcapsules was calculated. Int. J. Pharm & Ind. Res. Vol - 01. for determining the Hausner’s ratio and Carr’s index from the poured and tapped bulk densities of a know weight of sample using a measuring cylinder. [14, 15] The following equations were used for the calculations:. Issue - 04. Oct – Dec 2011.
(5) 299. Tapped Density Bulk Density Carr' s Index 100 …. (4) Tapped Density . Hausner's Ratio Angle of repose A funnel was fixed in a stand in such a way that the top of the funnel was at a height of 6 cm from the surface. The microcapsules were passed from the funnel so that they formed a pile. The height and the radius of the heap were measured and the angle of repose was calculated using the equation. [13, 16]. h θ Tan -1 r. …. (6). Scanning Electron Microscopy (SEM) The surface, morphology, microcapsules size, microcapsules shape, etc., were determined by using Scanning Electron Microscopy (BIOMETRICS: SEMCS491Q/790Q). Dry microcapsules were placed on an electron microscope brass stub that was coated with gold (thickness 200 nm) in an ion sputter. Pictures of microcapsules were taken by random scanning of the stub under the reduced pressure (0.001 torr).. ρT …. (5) ρB. % Drug content evaluation Nateglinide content in the microcapsules was estimated by UV-spectrophotometric method at a wavelength of 227 nm in phosphate buffer of pH 7.4, with 10% methanol (Elico, SL-158). The method obeyed Beer’s law in the concentration range 10-50 g/ml. Microcapsules containing equivalent to 100 mg of nateglinide were crushed as fine powder, extracted with 10 ml of methanol, and made up to 100 ml with pH 7.4 phosphate buffer. One milliliter of the sample solution was taken and made up to the volume to 10 ml with phosphate buffer pH 7.4, and the absorbance was measured at wavelength 227 nm. The procedure was repeated with pure nateglinide. The absorbance values from the pure drug nateglinide and microcapsules were treated and the %drug content was calculated. The method was validated for linearity, accuracy and precision.. Microencapsulation efficiency Microencapsulation efficiency was calculated using the following formula: [17]. Estimated percentage drug content Microencap sulation efficiency Theoratica l percentage drug content Determination of wall thickness Wall thickness of microcapsules was determined by using the equation:. h. 100 …. (7) . [18]. Γ(1 P) d1 …. (8) 3(Pd2 1 P) d1. where, h = wall thickness, Г = arithmetic mean radius of microcapsules, d 1 and d2 are densities of core and coat material respectively, and P is the proportion of medicament in microcapsules. All the experimental units were studied in triplicate (n = 3). Swelling index Pre-weighed nateglinide microcapsules (W0) formulated with mucoadhesive polymers by employing different coat: core ratios were placed in pH 7.4 phosphate buffer maintained at 37ºC. After the 3 rd hour, the microcapsules were collected and blotted to Int. J. Pharm & Ind. Res. Vol - 01. remove excess water and weighed (Wt). The swelling index was calculated with the following formulae: [19]. Swelling Index . Issue - 04. Wt - W0 100 …. (9) W0. Oct – Dec 2011.
(6) 300. where Wt = weight of microcapsules observed at the 3rd h and W0 = the initial weight of microcapsules.. and 30 mA of tube current and scanned over the 2Ѳ range of 100-800.. Permeability studies The permeability constant Pm of the microcapsules was calculated using the equation: [20]. In vitro wash-off test for mucoadhesive microcapsules. Pm . KVH …. (10) A Cs. where V is the volume of the dissolution medium (cm3), H the wall thickness of the microcapsules (mm), A the surface area of the microcapsules (cm2), Cs the solubility of the core material (mg) in the dissolution medium and K is the release rate constant (mg/h -1 or h1). For a given microcapsule and under standard testing conditions the values of V, A and C s remain constant and hence the equation can be written as: Pm K H …. (11) where K is the release rate constant and H is the wall thickness of the microcapsule. Fourier Transform Infrared studies Fourier Transform Infrared (FT-IR) analysis measurements of pure drug, carrier and drug-loaded microcapsules formulations were obtained using a Perkin-Elmer system 200FT-IR spectrophotometer. The pellets were prepared on KBr-press under a hydraulic pressure of 150 kg/cm2; the spectra were scanned over the wave number range of 4000-400 cm-1 at the ambient temperature. Differential scanning calorimetry (DSC) Differential scanning calorimetry (DSC) was performed on nateglinide drug loaded microcapsules using Seiko (Japan) DSC model 220C. Samples were sealed in aluminum pans and the DSC thermograms were reported at a heating rate of 10°C/min from 20 to 260°C. X-ray diffraction studies Different samples were evaluated by X-ray powder diffraction. Diffraction patterns were obtained using Xray diffractometer with a radius of 240 mm. The Cu Ka radiation was Ni filtered. A system of diverging and receiving slits of 1 and 0.1mm respectively was used. The pattern was collected with 40 kV of tube voltage. Int. J. Pharm & Ind. Res. Vol - 01. The mucoadhesive property of the microcapsules was evaluated by an in vitro adhesion testing method known as wash-off method. A piece of goat intestinal mucus (2 × 2 cm) was mounted onto glass slides of (3 × 1 inch) with elastic bands. Glass slide was connected with a suitable support. About 50 microcapsules were spread onto each wet tissue specimen, and thereafter the support was hung onto the arm of a USP tablet disintegrating test machine (Electro Lab, ED 2AL). The disintegration machine containing tissue specimen was adjusted for a slow, regular up and down moment in a test fluid at 37oC taken in a beaker. At the end of 1 h and later at hourly intervals up to 8 hours, the machine was stopped and the number of microcapsules still adhering onto the tissue was counted. The test was performed in phosphate buffer of pH 6.8. [21] In vitro drug release studies of microcapsules In vitro drug release studies of microcapsules were carried out using USP XXIII Eight station dissolution rate test apparatus Type I with a basket stirrer (Electro Lab, EDT 08 LX) at 100 rpm in 900 ml 0.1 N HCl for the 1 st 2 h, then in phosphate buffer of pH 7.4 at 50 rpm and temperature 37 ± 0.5oC. Microcapsules equivalent to 100 mg of nateglinide were tied in a muslin bag and kept in the basket. Five milliliter samples of the dissolution fluid were withdrawn at regular intervals and replaced with fresh quantity of dissolution fluid. The samples were filtered, diluted and analyzed, using Elico, SL-158 Double-beam UV-Visible Spectro photometer at wavelength 221 and 227 nm respectively. For all the formulations, the dissolution was carried out in triplicates and statistically analyzed using InStat3®. The obtained data were used to calculate the % drug release and to determine the order and mechanism of the release. [22] The formulation showed that best release among prepared by both techniques was identified and prepared 6 times and 6 formulations form each batch were evaluated for drug release and the results were. Issue - 04. Oct – Dec 2011.
(7) 301. statistically analyzed by analysis of variance (one factor ANOVA). [23] Curve fitting analysis [24-27] Zero-order release rate kinetics To study the zero–order release kinetics, the release rate data are fitted to the following equation:. Q K 0 t …. (12). Kt …. (13) 2.303. where; C = amount of drug remaining at time “t”, Co = initial amount of the drug and K = first-order rate constant (h-1) When the data are plotted as cumulative percent drug remaining versus time, it yields a straight line, indicating that the release follows first-order kinetics. The constant “K” can be obtained by multiplying 2.303 with slope. Higuchi release model To study the Higuchi release kinetics, the release rate data were fitted to the following equation:. Q K.t1/2 …. (14) where, “Q” is the amount of drug released, “K” the release rate constant, and “t” is the release time. When the data are plotted as accumulative drug released versus square root of time, it yields a straight line, indicating that the drug was released by diffusion mechanism. The slope is equal to “K”. Korsmeyer-peppas release model The release rate data were fitted into the following equation,. Mt/M (Q) K.t n …. (15) where, Mt/M∞ is the fraction of drug released, “K” is the release constant, “t” is the release time, and “n” is the diffusion exponent for the drug released that is dependent on the shape of the matrix dosage form. When the data are plotted as log of drug released versus log time, it yields a straight line with a slope equal to “n” and the “K” value can be obtained from Y intercept:. Int. J. Pharm & Ind. Res. When n approximates 0.45, a Fickian/diffusion control release is implied: where 0.45 > n < 0.89, it implies non-Fickian transport; and n≥0.89 for zero-order release.. Results and Discussion. where “Q” is the fraction of drug released, “K” the release rate constant and “t” is the release time. First-order kinetics A first-order release would be predicated by the following equation:. Log C Log C o . Q Kt n ….. (16). Vol - 01. The SEM and sieve analysis results showed the microcapsules to be discrete, spherical and free flowing. The particle size of microcapsules prepared by OIGT was found to be between 756.54 ± 19.276 µm and 802.74 ± 29.325 µm and of microcapsules prepared by EIGT was found to be between 490.16 ± 12.124 µm and 531.61 ± 6.109 µm (Figure 1). Angle of repose, bulk density, Carr’s index and Hausner’s ratio of microcapsules prepared by OIGT were found to be between 24.41 ± 0.52 and 27.74 ± 0.515, 0.499 ± 0.166 and 0.621 ± 0.104, 12.108 ± 4.576 and 23.824 ± 2.767 and 1.1377 ± 0.0455 and 1.3127 ± 0.0564, respectively where as in microcapsules prepared by EIGT was found to be between 23.2 ± 0.615 and 27.2 ± 0.522, 0.69 ± 0.034 and 0.83 ± 0.056, 12.643 ± 1.126 and 22.340 ± 1.341, and 1.144 ± 0.028 and 1.287 ± 0.018, respectively (Table 2a and 2b). Drug excipient compatibility was proved by FT-IR spectroscopy, DSC and X-ray diffraction (XRD) studies. In the IR spectra of nateglinide, the pure drug formed a number of peaks prominently at different wave numbers, indicating the presence of functional groups like carboxyl, carbonyl and amino groups like peaks at 1701 cm-1 and 1724 cm-1 wave number were due to C-C and C=O stretching in aliphatic chain and ester. Prominent peaks at 1643 cm-1, 1296 cm-1, and 1446 cm-1 were appeared due to C=O stretching, C-O stretching and, C-O-H stretching in acidic group and peak at 1215 cm-1 wave number as stretching in aliphatic chain indicated the presence of carboxylic group and keto group in the structure. Broad peaks appeared between 2950 cm-1 and 2850 cm-1 wave number were due to C=C stretching in aromatic structure. Peaks appearing at 2931 cm-1 and 1408 cm1 were because of C-H stretching aromatic and in CH 3 and CH2 aliphatic respectively. A more intense peak was found between 3296 cm-1 and 3311 cm-1 because. Issue - 04. Oct – Dec 2011.
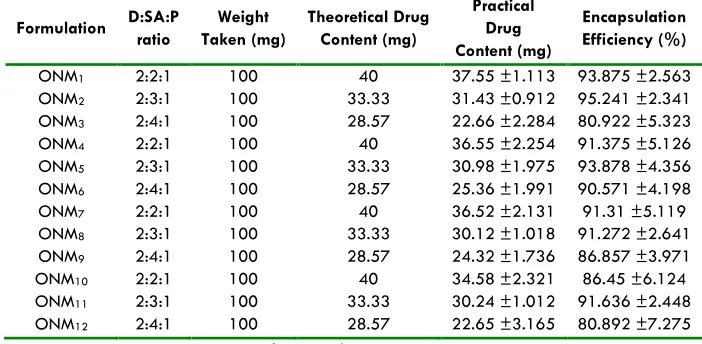
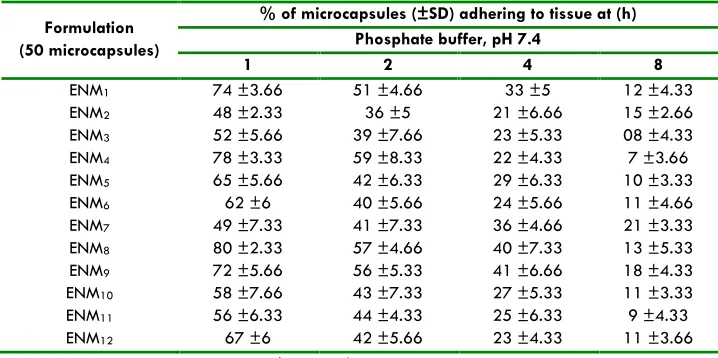
(8) 302. of N-H stretching indicating the presence of amino group in the structure and peak at 1384 cm -1 wave number also indicates the presence of C-N stretching. Peak at 1624 cm-1 was appeared because of –C-O-C stretching in SA. And all these peaks were appeared unchanged in IR spectra of combinations like nateglinide + SA + HPMC, nateglinide + SA + Sod.CMC, nateglinide + SA + Carbopol and nateglinide + SA + MC. The above interpretational data clearly states no interaction between the pure drug nateglinide and other excepients. Therefore, it can be said that the drug and excipients are compatible(Figure2). The melting point of pure nateglinide was found to be 135.78 oC and followed endothermic type of reaction for which the onset was at 126.30 oC and ended at 138.85 oC. The glass transition lag was found around 12.50oC and the same endothermic type of reactions was found in all combinations like nateglinide + SA + HPMC, nateglinide + SA + Sod.CMC, nateglinide + SA + Carbopol and nateglinide + SA + MC. No change was found in the melting point as well as glass transition lag, but special peaks were found indicating melting point of SA as 219.93oC, HPMC as 109.48oC, Sod. CMC as 109.71oC, Carbopol as 93.98oC and MC as 101.97oC, and the influence of excepients was found to be only in changing on’s and end’s sets of melting point peaks of nateglinide by absorbing heat but not by interactions. The above interpretational data clearly indicate that the crystalline nature of the drug had not been changed and it did not undergo any polymorphism because there was no interaction, which has been proved by its unchanged melting point in all the combinational spectra. X-ray diffractogram of nateglinide proves its crystalline nature as evidenced from the number of sharp and intense peaks. The diffractogram of nateglinide with polymers showed diffused peaks indicating amorphous nature of the polymers and sharp, incense peaks indicating the crystalline nature of drug. Diffraction pattern of drug with polymer mixture showed simply the sum of the characteristic peaks of polymer indicating the presence Int. J. Pharm & Ind. Res. Vol - 01. of drug in crystalline form. Diffraction patterns of sample spectra represent the availability of crystalline peaks of drug situated at 12.83, 16.55, 20.01, 21.45, 25.76 and 38.21 (2θ) similar to the pure drug with corresponding intensities and linear counts respectively. The obtained 2θ values as characteristic peaks were found at the same position in combinations like nateglinide + SA + HPMC, nateglinide + SA + Sod. CMC, nateglinide + SA + Carbopol and nateglinide + SA + MC, but the intensities got reduced because of diffused peaks and more orientation in case of polymers. The reduction in intensities or linear counts of peaks in combinations was possibly due to decrease in the degree of crystallinity of the drug that might have occurred when the drug is well dispersed in the SA + polymer matrix. Finally the DSC and XRD data indicate that the crystallinity of pure drug was unchanged and stable, and indirectly show that the compositions are compatible. (Figures 3 and 4) The microencapsulation efficiency in microcapsules by OIGT was from 80.892 ± 7.275 to 95.241 ± 2.341% with practical % drug content values around 22.65 ± 3.165 to 37.55 ± 1.113%, where as in microcapsules by EIGT microencapsulation efficiency was from 60.249 ± 1.997 to 95.638 ± 5.265% with practical % drug content values around 20.081 ± 0.49 to 33.483 ± 0.57% (Table 3a and 3b). Wall thickness and permeability coefficient were found around 88.51 ± 2.983 to 107.24 ± 4.328 μm and 454.011-590.62 μg/cm2/h respectively in microcapsules prepared with OIGT and in EIGT was found to be 57.988 ± 3.46 to 62.840 ± 3.24 μm and 332.627 to 352.079 μg/cm2/h respectively. In OGIT microcapsules swelling index was the highest in formulation ONM 3 around 221.23 ± 16.378% w/w and the least in ONM 10 around 57.89 ± 12.554% w/w where as in EIGT microcapsules swelling index was found highest in formulation ENM3 around 209.83 ± 12.338% w/w and the least in ENM7 around 65.32 ± 18.123% w/w (Figure 5a and 5b). All microcapsules exhibited good mucoadhesive property in the in vitro wash-off test (Figure 6a and 6b) and microcapsules with carbopol ONM9 and ENM7 showed better mucoadhesion where 28% and 21% of microcapsules were found adhered to the mucosal layer after 8 h (Table 4a and 4b). In. Issue - 04. Oct – Dec 2011.
(9) 303. formulations prepared by OIGT, the highest release 2.232% in formulation ONM3 up to 24 h whereas the least retardation was observed to be around 98.216 ± 3.644% in the formulation ONM4 after 16 h in In vitro drug release studies, but in formulations prepared by EIGT, the highest release retardation was found to be 99.345 ± 1.987% in formulation ENM 3 up to 20 h whereas the least retardation was found to be around 99.913 ± 3.857 % in formulation ENM10 up to 15 h (Figure 7a and 7b). When best retarding formulation was identified among microcapsules prepared by both techniques (ONM3), the formulation was prepared 6 times (batches) and, six samples from each batch were taken then evaluated for drug release (n = 6) and statistically analyzed by (one factor ANOVA), the data showed Df1 (5) and Df2 (30) with an F-value of 2.0370. The obtained F-value found less than f-table value around 2.53 indicating less difference in between the groups and within the groups. P-value was found to be significant around 0.1017, proving maximum closeness between the results. All formulations followed zero-order non-Fickian release kinetics with Case II and Super Case II Transport mechanism (Table 5a and 5b). All physical parameters were found in the acceptable range. The particle size and shape of microcapsules was influenced very much by the technique selected, microcapsules size was found smaller and more spherical with EIGT. The microencapsulation efficiency and mucoadhesive efficiency were found to be greater with Carbopol and HPMC than in other formulations and not much influence of mucoadhesive polymers were found on microencapsulation efficiency, whereas swelling index was higher in formulations with HCMC even prepared by both techniques. All compositions were found compatible in IR, DSC and XRD studies and thus are suitable for extending the scope of work in this research area. In mucoadhesion test it revealed that the formulations containing carbopol showed good mucoadhesion and its performance according to its percentage was found proportionate which was not found in other mucoadhesive polymers containing. Int. J. Pharm & Ind. Res. Vol - 01. retardation was found to be around 99.637 ± formulations. The drug release from the microcapsules was sustained over an extended period of time. The study states that release not only depended on the core: coat ratio and type of mucoadhesive agent used, but also on the technique used in preparation where which got retarded as the coat material percentage got increased in both techniques. Formulations prepared with OIGT showed more retardation as compared to EIGT. Microcapsules prepared using HPMC showed better sustained action, and formulation containing drug: SA: HPMC in the ratio 2:4:1 was found to be the best formulation as it released the maximum drug up to 24 h.. Conclusion The mucoadhesive microencapsulation by following orifice-ionic gelation technique could be adopted in the laboratory as well as in the industry, as it is simple and reproducible. In conclusion, Carbopol and HPMC microcapsules could be used for better mucoadhesive action and SA could be used for better sustained action over an extended period of time. Release retardation depends not only on coat material percentage but also on mucoadhesive polymer selected and optimization of mucoadhesive polymer is needed to get formulations with desired quality. Selection of technique and optimization of technique found important to get desirable physical and release properties. Formulations prepared with OIGT produced more efficient microcapsules as compared to EIGT. However, further in vivo studies are needed to optimize the drug for sustained action in human beings for better bioavailability, and efficacy, and thus safety.. Acknowledgement Authors wish to thank M/s Aurobindo Pharmaceuticals Ltd., Hyderabad, (Andhra Pradesh, India) for providing gift sample of Nateglinide, and authors will be thankful to management of Vaageswari College of Pharmacy, Karimnagar, (Andhra Pradesh, India) for supporting us to finish up this study successfully.. Issue - 04. Oct – Dec 2011.
(10) 304. Table 01: Composition of various batches of nateglinide mucoadhesive microcapsules Qty used in formulations (g) S. No. Ingredients. ONM1 ENM1. ONM2 ENM2. ONM3 ENM3. ONM4 ENM4. ONM5 ENM5. ONM6 ENM6. ONM7 ENM7. ONM8 ENM8. ONM9 ENM9. ONM10 ENM10. ONM11 ENM11. ONM12 ENM12. 1.. Nateglinide. 2. 2. 2. 2. 2. 2. 2. 2. 2. 2. 2. 2. 2.. Sod.Alginate. 2. 3. 4. 2. 3. 4. 2. 3. 4. 2. 3. 4. 3.. HPMC. 1. 1. 1. -. -. -. -. -. -. -. -. -. 4.. SCMC. -. -. -. 1. 1. 1. -. -. -. -. -. -. 5.. Carbopol. -. -. -. -. -. -. 1. 1. 1. -. -. -. 6.. MC. -. -. -. -. -. -. -. -. -. 1. 1. 1. Total Weight. 5. 6. 7. 5. 6. 7. 5. 6. 7. 5. 6. 7. Drug:SA:Polymer. 2:2:1. 2:3:1. 2:4:1. 2:2:1. 2:3:1. 2:4:1. 2:2:1. 2:3:1. 2:4:1. 2:2:1. 2:3:1. 2:4:1. Table 02a: Physical parameters data of nateglinide mucoadhesive microcapsules ONM1-ONM12 Formulation ONM1 ONM2 ONM3 ONM4 ONM5 ONM6 ONM7 ONM8 ONM9 ONM10 ONM11 ONM12. Angle of Repose. Bulk Density (g/cm3). 25.96 ±1.827 27.11 ±0.52 25.96 ±0.749 27.74 ±0.515 24.93 ±0.52 24.41 ±1.202 25.96 ±1.241 25.56 ±1.294 25.45 ±1.25 24.93 ±0.302 24.41 ±0.749 27.11 ±0.202. 0.54 ±0.0875 0.529 ±0.0536 0.573 ±0.083 0.58 ±0.103 0.512 ±0.0757 0.542 ±0.0452 0.566 ±0.0127 0.602 ±0.0936 0.621 ±0.104 0.498 ±0.166 0.532 ±0.0972 0.565 ±0.0632. Carr’s Index. Hausner’s Ratio. 15.76 ±1.557 23.824 ±2.767 18.634 ±3.785 19.96 ±3.578 17.056 ±4.536 14.364 ±2.869 13.968 ±3.896 12.108 ±4.576 15.544 ±5.31 14.344 ±4.675 15.944 ±1.979 12.99 ±4.765. 1.1870 ±0.0979 1.3127 ±0.0564 1.2290 ±0.0647 1.2493 ±0.0436 1.2056 ±0.0787 1.1677 ±0.0546 1.1623 ±0.0768 1.1377 ±0.0455 1.1840 ±0.0756 1.1674 ±0.0435 1.1896 ±0.0768 1.1492 ±0.0787. Mean Particle Size (μm) 765.92 ±19.856 782.65 ±15.678 802.74 ±29.325 756.54 ±19.276 782.34 ±23.234 797.12 ±14.761 762.34 ±23.432 775.6 ±41.29 793.2 ±36.23 758.9 ±18.127 770.6 ±33.849 785.4 ±29.556. Wall Thickness (μm). Permeability coefficient (μg/cm2/hr). 89.610 ±6.345 98.881 ±3.244 107.24 ±4.328. 541.208 481.293 454.011. 88.51 ±2.983 98.843 ±3.762 106.492 ±3.543 89.189 ±2.675 97.997 ±7.435 105.971 ±6.648 88.791 ±2.961 97.365 ±4.552 104.929 ±5.873. 577.164 554.815 520.106 542.563 531.986 558.922 590.62 587.062 579.963. *Mean ± S.D (n=3). Int. J. Pharm & Ind. Res. Vol - 01. Issue - 04. Oct – Dec 2011.
(11) 305. Table 02b: Physical parameters data of nateglinide mucoadhesive microcapsules ENM1-ENM12 Formulation ENM1 ENM2 ENM3 ENM4 ENM5 ENM6 ENM7 ENM8 ENM9 ENM10 ENM11 ENM12. Angle of Repose. Bulk Density (g/cm3). Carr’s Index. 25.4 ±0.617 26.3 ±0.721 27.2 ±0.522 25.3 ±0.731 24.6 ±0.916 25.2 ±0.632 24.8 ±0.742 24.3 ±0.912 25.7 ±.0.844 23.2 ±0.615 25.6 ±0.712 24.8 ±0.827. 0.76 ±0.035 0.79 ±0.046 0.72 ±0.057 0.73 ±0.062 0.69 ±0.034 0.78 ±0.042 0.81 ±0.094 0.80 ±0.072 0.79 ±0.046 0.76 ±0.065 0.81 ±0.046 0.83 ±0.056. 15.555 ±1.052 17.708 ±1.141 21.739 ±.0943 22.340 ±1.341 15.853 ±1.128 14.285 ±1.092 12.903 ±1.324 13.978 ±1.111 13.186 ±1.223 12.643 ±1.126 13.829 ±1.091 13.541 ±1.232. Hausner’s Ratio. Mean Particle Size (μm). 1.184 ±0.023. 490.16 ±12.124. 1.215 ±0.026. 510.46 ±5.324. 1.277 ±0.0199. 530.22 ±8.46. 1.287 ±0.018. 528.97 ±5.39. 1.188 ±0.022. 510.43 ±10.83. 1.166 ±0.031. 525.22 ±5.328. 1.148 ±0.021. 528.19 ±8.197. 1.162 ±0.027. 531.61 ±6.109. 1.151 ±0.027. 500.84 ±13.203. 1.144 ±0.028. 498.37 ±12.983. 1.160 ±0.019. 506.26 ±10.462. 1.156 ±0.026. 512.69 ±8.236. Wall Thickness (μm) 57.988 ±3.46 60.355 ±2.65 62.721 ±2.77 62.485 ±4.23 60.355 ±5.43 62.130 ±5.44 62.485 ±3.65 62.840 ±3.24 59.171 ±3.44 58.934 ±4.25 59.881 ±3.87 60.591 ±2.44. Permeability coefficient (μg/cm2/hr) 352.079 341.573 337.596 335.007 341.516 332.627 335.803 336.395 348.085 349.183 348.591 340..360. *Mean ± S.D (n=3). Figure 01: SEM pictograms of nateglinide mucoadhesive microcapsules prepared with EIGT Int. J. Pharm & Ind. Res. Vol - 01. Issue - 04. Oct – Dec 2011.
(12) 306. Figure 02: FT-IR spectra of nateglinide pure drug, nateglinide+SA+HPMC, nateglinide+SA+Sod.CMC, nateglinide+SA+Carbopol and nateglinide+SA+MC.. Figure 03: DSC spectra of nateglinide pure drug, nateglinide+SA+HPMC, nateglinide+SA+Sod.CMC, nateglinide+SA+Carbopol and nateglinide+SA+MC.. Figure 04: X-Ray diffraction spectra of nateglinide pure drug, nateglinide+SA+HPMC,. Int. J. Pharm & Ind. Res. Vol - 01. Issue - 04. Oct – Dec 2011.
(13) 307. nateglinide+SA+Sod.CMC, nateglinide+SA+Carbopol and nateglinide+SA+MC. Table 03a: Drug content/Encapsulation Efficiency of formulations ONM1-ONM12 Formulation. D:SA:P ratio. Weight Taken (mg). Theoretical Drug Content (mg). ONM1 ONM2 ONM3 ONM4 ONM5 ONM6 ONM7 ONM8 ONM9 ONM10 ONM11 ONM12. 2:2:1 2:3:1 2:4:1 2:2:1 2:3:1 2:4:1 2:2:1 2:3:1 2:4:1 2:2:1 2:3:1 2:4:1. 100 100 100 100 100 100 100 100 100 100 100 100. 40 33.33 28.57 40 33.33 28.57 40 33.33 28.57 40 33.33 28.57. Practical Drug Content (mg) 37.55 ±1.113 31.43 ±0.912 22.66 ±2.284 36.55 ±2.254 30.98 ±1.975 25.36 ±1.991 36.52 ±2.131 30.12 ±1.018 24.32 ±1.736 34.58 ±2.321 30.24 ±1.012 22.65 ±3.165. Encapsulation Efficiency (%) 93.875 ±2.563 95.241 ±2.341 80.922 ±5.323 91.375 ±5.126 93.878 ±4.356 90.571 ±4.198 91.31 ±5.119 91.272 ±2.641 86.857 ±3.971 86.45 ±6.124 91.636 ±2.448 80.892 ±7.275. *Mean ± S.D (n=3) Table 03b: Drug content/Encapsulation Efficiency of formulations ENM 1-ENM12 Formulation. D:SA:P ratio. Weight Taken (mg). ENM1 ENM2 ENM3 ENM4 ENM5 ENM6 ENM7 ENM8 ENM9 ENM10 ENM11 ENM12. 2:2:1 2:3:1 2:4:1 2:2:1 2:3:1 2:4:1 2:2:1 2:3:1 2:4:1 2:2:1 2:3:1 2:4:1. 100 100 100 100 100 100 100 100 100 100 100 100. Theoretical Drug content (mg) 40 33.33 28.57 40 33.33 28.57 40 33.33 28.57 40 33.33 28.57. Practical Drug Content (mg) 32.151 ±0.543 28.833 ±0.488 25.136 ±0.682 33.213 ±0.467 30.092 ±0.656 24.047 ±0.491 32.372 ±0.585 20.964 ±0.682 27.324 ±0.766 33.483 ±0.57 20.081 ±0.49 21.503 ±0.551. Encapsulation Efficiency (%) 80.377 ±2.343 86.507 ±1.998 87.980 ±3.146 83.032 ±1.987 90.285 ±2.345 84.168 ±2.675 80.93 ±3.782 62.898 ±4.353 95.638 ±5.265 83.707 ±3.265 60.249 ±1.997 75.264 ±2.897. *Mean ± S.D (n=3) Table 04a: In Vitro Wash off Test Data of formulations ONM 1-ONM12 Formulation (50 microcapsules) ONM1 ONM2 ONM3 ONM4 ONM5 ONM6 ONM7 ONM8 ONM9 ONM10 ONM11 ONM12. % of microcapsules (±SD) adhering to tissue at (h) Phosphate buffer, pH 7.4 1 2 4 8 54 ±7.33 42 ±5.66 32 ±4.33 16 ±2.66 66 ±4.33 52 ±3.33 32 ±3.66 24 ±3 76 ±6 62 ±5.33 48 ±4 22 ±3.33 52 ±4.66 44 ±2.66 34 ±2 18 ±3.33 68 ±5.33 56 ±4 44 ±3.33 22 ±2.66 82 ±5 68 ±4.33 58 ±4.66 20 ±1.66 64 ±4.66 52 ±3.66 38 ±2.33 16 ±3 76 ±3.66 56 ±4.33 44 ±3.33 26 ±2.33 92 ±6 66 ±5.66 52 ±3.66 28 ±3.33 52 ±3.33 44 ±4.33 34 ±2.66 18 ±3 62 ±2.66 56 ±2.66 43 ±3.33 24 ±3.66 76 ±4.66 62 ±4 48 ±2.66 20 ±2.66. *Mean ± S.D (n=3). Int. J. Pharm & Ind. Res. Vol - 01. Issue - 04. Oct – Dec 2011.
(14) 308. Table 04b: In Vitro Wash off Test Data of formulations ENM 1-ENM12 Formulation (50 microcapsules) ENM1 ENM2 ENM3 ENM4 ENM5 ENM6 ENM7 ENM8 ENM9 ENM10 ENM11 ENM12. % of microcapsules (±SD) adhering to tissue at (h) Phosphate buffer, pH 7.4 1 2 4 8 74 ±3.66 51 ±4.66 33 ±5 12 ±4.33 48 ±2.33 36 ±5 21 ±6.66 15 ±2.66 52 ±5.66 39 ±7.66 23 ±5.33 08 ±4.33 78 ±3.33 59 ±8.33 22 ±4.33 7 ±3.66 65 ±5.66 42 ±6.33 29 ±6.33 10 ±3.33 62 ±6 40 ±5.66 24 ±5.66 11 ±4.66 49 ±7.33 41 ±7.33 36 ±4.66 21 ±3.33 80 ±2.33 57 ±4.66 40 ±7.33 13 ±5.33 72 ±5.66 56 ±5.33 41 ±6.66 18 ±4.33 58 ±7.66 43 ±7.33 27 ±5.33 11 ±3.33 56 ±6.33 44 ±4.33 25 ±6.33 9 ±4.33 67 ±6 42 ±5.66 23 ±4.33 11 ±3.66. *Mean ± S.D (n=3) Table 05a: Release Kinetic Data of Formulations ONM 1-ONM12 Formulation ONM1 ONM2 ONM3 ONM4 ONM5 ONM6 ONM7 ONM8 ONM9 ONM10 ONM11 ONM12. Zero Order r2 0.9892 0.9831 0.9929 0.9952 0.9981 0.9759 0.996 0.9965 0.9868 0.9933 0.9828 0.991. Release rate constant K0 6.0396 4.8674 4.2336 6.5209 5.6131 4.884 6.0833 5.4286 5.2743 6.6518 6.0295 5.5272. First Order r2 0.8757 0.8577 0.7406 0.8519 0.7844 0.8918 0.7803 0.779 0.8665 0.6893 0.9146 0.8374. Higuchi r2 0.9433 0.9589 0.9644 0.9462 0.9297 0.9611 0.9466 0.9391 0.9589 0.9019 0.9483 0.9587. Best Fit Zero order Zero order Zero order Zero order Zero order Zero order Zero order Zero order Zero order Zero order Zero order Zero order. Korsmeyer-Peppas r2 0.9864 0.9751 0.976 0.9859 0.9871 0.9778 0.9878 0.9809 0.9834 0.9941 0.9827 0.9916. n 1.2044 1.1132 0.9716 1.086 0.9335 1.1674 0.9682 1.2614 1.2527 1.2334 1.1442 0.9973. Release Mechanism Super Case II Super Case II Super Case II Super Case II Super Case II Super Case II Super Case II Super Case II Super Case II Super Case II Super Case II Super Case II. Table 05b: Release Kinetic Data of Formulations ENM1-ENM12 Formulation. Zero Order. ENM1 ENM2 ENM3 ENM4 ENM5 ENM6 ENM7 ENM8 ENM9 ENM10 ENM11 ENM12. r2 0.9873 0.9893 0.9965 0.9886 0.9867 0.9789 0.9891 0.9957 0.9833 0.9937 0.9922 0.9968. Int. J. Pharm & Ind. Res. Release rate constant K0 6.9612 6.3850 5.1268 7.042 5.718 5.8049 6.3172 5.7242 5.697 7.0279 6.9825 5.9401. First Order. Higuchi. r2 0.8140 08387 0.7567 0.7864 0.6094 0.8366 0.7834 0.6517 0.8152 0.6713 0.8069 0.6868. r2 0.9282 0.9359 0.9526 0.9457 0.8992 0.9572 0.9458 0.9545 0.9613 0.9250 0.9424 0.9494. Vol - 01. Best Fit Zero order Zero order Zero order Zero order Zero order Zero order Zero order Zero order Zero order Zero order Zero order Zero order. Korsmeyer-Peppas r2 0.9884 0.9929 0.9921 0.9773 0.9865 0.9882 0.9825 0.9987 0.9852 0.9806 0.9863 0.9930. Issue - 04. n 1.2174 1.2191 0.9586 1.0587 0.9312 1.0520 0.9414 0.9915 1.0122 1.0253 1.0221 1.0396. Release Mechanism Super Case II Super Case II Super Case II Super Case II Super Case II Super Case II Super Case II Super Case II Super Case II Super Case II Super Case II Super Case II. Oct – Dec 2011.
(15) 309 Swelling Index data of nateglinide mucoadhesive microcapsules (Formulations ONM1-ONM12). 250. 221.23 189.29. Swelling Index %w/w. 200. 164.98. 163.44. 150. 100. 146.7. 110.54. 132.3 104.3. 99.15. 89.2. 76.93 57.89. 50. 2. 1 ON M 1. ON M 1. 0 ON M 1. ON M 9. ON M 8. ON M 7. ON M 6. ON M 5. ON M 4. ON M 3. ON M 2. ON M 1. 0. Formulations. Figure 05a: Swelling IndexSwelling histogram ofdata nateglinide mucoadhesive microcapsules ONM 1-ONM12 Index of nateglinide mucoadhesive microcapsules (Formulations ENM1-ENM12). 250. 209.83. Swelling Index %w/w. 200. 191.22 173.67. 165.22. 145.11. 142.92 150 112.33. 109.32. 98.12 84.22. 100. 71.22. 65.32. 50. 12 ENM. 11 ENM. 10. 9 ENM. ENM. 8 ENM. 5 ENM. 7. 4 ENM. ENM. 3 ENM. 6. 2 ENM. ENM. 1 ENM. 0. Formulations. Figure 05b: Swelling 35. In vitro mucoadhesive wash of test results of nateglinide Index histogram of nateglinide mucoadhesive microcapsules mucoadhesive microcapsules after 8hours (Formulations ONM1-ONM12). ENM 1-ENM12. 28. % Microcapsules retained after 8th hour. 30 24. 25. 26 22. 20. 18. 20. 24. 22. 20. 18 16. 16. 15 10 5. 0. 1. 2. ONM 1. ONM 1. Formulation. ONM 1. ONM 9. ONM 8. ONM 7. ONM 6. ONM 5. ONM 4. ONM 3. ONM 2. ONM 1. 0. Figure 06a: In vitro mucoadhesive wash off test results histogram of nateglinide mucoadhesive microcapsules ONM 1-ONM12 after 8th hour. Int. J. Pharm & Ind. Res. Vol - 01. Issue - 04. Oct – Dec 2011.
(16) In vitro mucoadhesive wash of test results of nateglinide 310 mucoadhesive microcapsules after 8hours (Formulations ENM1-ENM12). % Microcapsules retained after 8th hour. 30. 21. 25. 18. 20 12. 13. 15 11. 15. 8. 11. 10. 9. 11. 7. 10 5. ENM 12. ENM 11. Formulation. ENM 10. ENM 9. ENM 8. ENM 7. ENM 6. ENM 5. ENM 4. ENM 3. ENM 2. ENM 1. 0. Figure 06b: In vitro mucoadhesive wash off test results histogram of nateglinide mucoadhesive microcapsules ENM 1-ENM12 after 8th hour In vitro drug release plots of nateglinide microcapsules formulations (ONM1-ONM12). 120. 100. ONM1 ONM2 ONM3. 80. % Drug Released. ONM4 ONM5 ONM6. 60. ONM7 ONM8 ONM9. 40. ONM10 ONM11 ONM12. 20. 0 0. 5. 10. 15 Time (h). 20. 25. 30. Figure 07a: In vitro drugInrelease plots of nateglinide mucoadhesive microcapsules ONM 1-ONM12 vitro drug release plots of nateglinide microcapsules formulations (ENM1-ENM12). 120. ENM1. 100. ENM2 ENM3 ENM4. 80. % Drug Released. ENM5 ENM6 ENM7. 60. ENM8 ENM9 ENM10. 40. ENM11 ENM12. 20. 0 0. 5. 10. 15 Time (h). 20. 25. 30. Figure 07b: In vitro drug release plots of nateglinide mucoadhesive microcapsules ENM 1-ENM12. Int. J. Pharm & Ind. Res. Vol - 01. Issue - 04. Oct – Dec 2011.
(17) 311. References. 1. Robinson RJ, Lee VH. Controlled Drug Delivery: Fundamentals and Applications. Revised and expanded. Vol 29; 2nd ed. New York: Marcel Dekker Inc; 2005. pp. 9-19. 2. Boddupalli BM, Mohammed ZNK, Ravinder Nath A, Banji D. Mucoadhesive drug delivery system: An overview. J Adv Pharm Tech Res. 1, 2010, 381387. 3. Pranshu TSK, Sathish MNV. Mucoadhesive drug delivery: mechanism and methods of evaluation. Int J Pharma Bio Sci. 2(1), 2011, 458-467. 4. Solmaz D, Reza A, Mohammadreza A and Ramin K. Formulation Optimization of Nifedipine Containing Microspheres Using Factorial Design. African J Pharm Pharmacology. 4(6), 2010, 346354. 5. Mealey BL, Oates TW. Diabetes Mellitus and periodontal diseases. J Periodontal. 77(8), 2006, 1289-1303. 6. Norman P, Rabasseda X. Nateglinide: A structurally novel, short-acting, hypoglycemic agent. Drugs Today. 37(6), 2001, 411-426. 7. Carvalho FC, Bruschi ML, Evangelista RC, Gremião MPD. Mucoadhesive drug delivery systems. Brazilian J Pharm Sci. 46(1), 2010, 1-17. 8. Chowdary KPR, Srinivas L. Mucoadhesive drug delivery system: Status of Current review. Indian Drugs. 37, 2000, 400-410. 9. Liu XD, Yu WY, Zhang Y, Xue WM, Yu WT, Xiong Y, et al. Characterization of structure and diffusion behavior of Ca–alginate beads prepared with external or internal calcium sources. J Microencapsulation. 18, 2002, 775-782. 10. Bahadur S, Chanda R, and Roy A, Preparation and evaluation of mucoadhesive microcapsules of captopril for oral controlled release. Res J Pharm Tech. 1(2), 2008, 100-105. 11. Kosaraju K, Ramakrishna R, Suarcharla RL, Murthy TEGK. Design and development of alginate beads containing mucoadhesive polymers of an oral controlled release of glimepiride. Tech Spectrum. 1(3), 2007, 22-28. 12. Lachman L, Lieberman HA, Kanig JL. The theory and practice of industrial pharmacy. 3rd ed. Bombay: Varghese Publishing House; 1987. pp. 22-28. 13. Puttewar TY, Kshirsagar MD, Chadewar AV, Chikale RV. Formulation and evaluation of orodispersible tablet of taste masked doxylamine succinate using ion exchange resin. J King Saud Uni. 22, 2010, 229-240.. Int. J. Pharm & Ind. Res. Vol - 01. 14. Hausner HH. Friction conditions in a mass of metal powder. Int J Metall. 3, 1967, 7-13. 15. Carr RL. Evaluating flow properties of solids. Chem Eng. 72, 1965, 163-168. 16. Aulton ME. Pharmaceutics: The Science of Dosage Form Design. 3rd ed. New York: Churchill Livingstone; 1988: pp. 605-613. 17. Zinutti C, Hoffman M. Preparation and characterization of ethyl cellulose microspheres containing 5-fluoro-uracil. J Microencapsul. 11(5), 1994,555-563. 18. Si-Nang L, Carlier PF, Delort P, Gazzola J, Labont D. Determination of coating thickness of microcapsules and influence upon diffusion. J Pharm Sci. 62(3), 1973, 452-455. 19. Ma XJ, Xie YB, Zhou L, Yu XJ, Yuan Q, Li CC, et al. Relationship between preparation conditions and membrane strength of APA biomicrocapsules. Chinese J Organ Transplantation. 16, 1995, 156157. 20. Koida Y, Kobayashi M, Samejima M. Studies on microcapsules. IV: Influence of properties of drugs on microencapsulation and dissolution behavior. Chem Pharma Bull. 34(8), 1986, 3354-3361. 21. Lehr CM, Bowstra JA, Tukker JJ, Junginer HE. Intestinal transit of bioadhesive microspheres in an in situ loop in the rat. J Control Rel. 13(1), 1990, 51-62. 22. Costa P, Jose-Manuel SL. Modeling and comparison of dissolution profiles. Eur J Pharma Sci. 13, 2001, 123-133. 23. Yadav A, Jain DK. Gastroretentive microbaloons of metformin: Formulations development and characterization. J Adv Pharm Tech Res. 2, 2011, 51-55. 24. The Indian Pharmacopoeia, Vol-II, Indian Pharmacopoeia Commission, Ghaziabad, 2007. pp. 740-742. 25. Higuchi T. Mechanism of Sustained Action Medication: Theoretical Analysis of Rate of Release of Solid Drug Dispersed in Solid Matrices. J Pharm Sci. 52, 1963, 1145-1149. 26. Ritger PL, Peppas NA. The simplest equation for description of solute release II. Fickian and anomalous release from swellable devices. J Controlled Rel. 52, 1987, 37-42. 27. Sipemann J, Peppas NA, Modeling of drug release for delivery systems based on hydroxypropyl methyl cellulose (HPMC). Adv Drug Del Rev. 2(48), 2001, 139-157.. Issue - 04. Oct – Dec 2011.
(18)
Figure


+4


Related documents
aeruginosa resis- tant to tachyplesin I could be involved in expression of the genes encoded by OMPs or changes of outer membrane permeability, transcriptional regulation revealed
In the Belly of the Whale: Archive and Access in Melville’s Moby-Dick..
German MNCs global CPS adoption, globalization induced internal shifts in competence allocation and new lower wage capacity subcontractors inside Germany all pose interesting
With regards to the second research question, we hy- pothesized the following hierarchy and correspondences between the bar tasks (Fig. 6) and stage classifications: (H1) The bar
To adapt to such form of unwrapping using the existing derived map- ping functions, a projection plane that is normal to the optical axis is simply placed some distance away from
There were 43 nodes and 47 link pairs in the transcrip- tional regulatory network, including 19 TFs (such as FOS, TWIST1, POU2F1, SMARCA4, and CREBBP), 16 upregulated DEGs, and
In conclusion, we report that in the tumors of our de- scribed Kenyan breast cancer patient cohort, immune cell infiltration measured by the cell type and density of tumor
In this inaugural issue of International Journal of Quality Innovation , the Editor-in-Chief reports the evolution of quality management and the need for innovative research
