5331 DEVELOPMENT AND VALIDATION OF UV SPECTROPHOTOMETRIC METHOD
AND RP-HPLC METHOD FOR SIMULTANEOUS ESTIMATION OF EZETIMIBE AND FLUVASTATIN IN SYNTHETIC MIXTURE
Shivani T. Raval1, Dilip Maheshwari2
1 Department of Quality Assurance and Pharm Regulatory Affairs, L.J. Institute of Pharmacy, Ahmedabad-380021, India.
2 Department of Quality Assurance and Pharm Regulatory Affairs, L.J. Institute of Pharmacy, Ahmedabad-380021, India.
*Corresponding author E-mail: [email protected]
ARTICLE INFO ABSTRACT
Key Words
Ezetimibe, Fluvastatin, First order derivative,
Synthetic Mixture, Validation method.
An accurate, precise and reproducible UV-spectrophotometric methods and liquid chromatographic assay method were developed and validated for the determination of Ezetimibe and Fluvastatin in synthetic mixture. Spectrophotometric estimation was done by derivative spectroscopic method and methanol as solvent. In this method λmax for Ezetimibe and Fluvastatin were selected at 245 nm and 270nm. RP-HPLC analysis was carried out using Thermo C-18 column (4.6 x 250mm, 5μ particle size) and mobile phase composed of Acetonitrile : water pH 3.3 (60:40% v/v)at a flow rate of 1.0 ml/min and chromatogram was recorded at 235 nm. Linearity was evaluated over the concentration range of 1 -6 μg/ml and 8-48 μg/ml for Ezetimibe and Fluvastatin in UV spectrophotometric and in RP-HPLC method Linearity was evaluated over the concentration range of 1-6 μg/ml and 8-48 μg/ml for Ezetimibe and
Fluvastatin (the value of r2 = 0.9985 and r2= 0.9992 found were by UV method for
Ezetimibe and Fluvastatin and the value of r2 = 0.9989 and r2= 0.9993 found were by
RP-HPLC method for Ezetimibe and Fluvastatin). The developed methods were validated according to ICH guidelines and values of accuracy, precision and other statistical analysis were found to be in good accordance with the prescribed values therefore the both methods can be used for routine monitoring of Ezetimibe and Fluvastatin in the assay of Synthetic mixture of both drugs.
INTRODUCTION:
Ezetimibe is selective cholesterol
absorption inhibitor. It is an
anti-hyperlipidemic agent. It is used in treatment of Hypercholesterolemia. It inhibits the absorption of cholesterol and decreasing delivery of intestinal cholesterol to the liver. It is metabolized into its glucuronide in liver
and small intestine which prevent absorption
of cholesterol. Fluvastatin is HMG-CoA
reductase inhibitor.3-Hydroxy 3-methyl
glutaryl coenzyme A (HMG-COA)
reductase is responsible for converting of HMG-CoA to mevalonate, the rate – limiting step in cholesterol biosynthesis. It is
5332
used to reduce cholesterol levels and prevent cardiovascular disease. It decreases low density lipoprotein (LDL) cholesterol. From the literature survey, it was observed that various methods are reported for analysis of Ezetimibe and Fluvastatin individually as well as in combination with other drugs. But no analytical method has been reported for analysis of Ezetimibe and Fluvastatin synthetic mixture. A successful attempt has
been made to estimate two drugs
simultaneously by First order derivative Spectrophotometric method.
MATERIAL AND METHODS:
Instruments
UV Visible Spectrophotometer:
Shimadzu model 1800
Digital analytical weighing balance:
Wenser DAB-220
Melting point apparatus
IR spectrophotometer: Model-
Miracle-10, single reflection ATR accessory- 8300, shimadzu
Chemicals and Materials:
Ezetimibe and Fluvastatin were as a gift
sample supplied by (Torrent
Pharmaceuticals, Ahmedabad) and (Intas Pharmaceuticals, Ahmedabad).
Methanol (Aventor Performance
Material, India) (AR Grade)
UV Spectrophotometric method:
Identification of pure API:
Melting point determination:
Melting point of Ezetimibe API and
Fluvastatin API has been determined by open capillary method using Melting point apparatus in which the Ezetimibe and Fluvastatin were filled in Capillary tubes and kept in the Melting point apparatus.
Solubility determination:
The solubility study of Ezetimibe and Fluvastatin were determined by taking
10 mg of both drug in 10 ml volumetric flasks, add the required quantity of solvent and shaken for few minutes. U.V Spectrophotometric Method: First-order derivative method for Ezetimibe and Fluvastatin
Experimental work
Instruments and Apparatus
UV Visible Spectrophotometer:
Shimadzu model 1800
Digital Analytical balance –
Wensar DAB – 220
Sonicator- Equitron
Volumetric Flask- 10,50,100 ml
(Borosilicate)
Measuring Cylinder- 10,50,100
ml (Borosilicate)
Chemical and Reagents
Ezetimibe API (Torrent
Pharmaceuticals, Ahmedabad)
Fluvastatin API (Intas
Pharmaceuticals, Ahmedabad)
Methanol (Avantor Performance
Material, India)
Spectrophotometric conditions
Mode: Absorption (scanning)
Scan Speed: Medium
Wavelength Range: 200-400nm
Initial Baseline Correction:
Methanol (AR grade)
Preparation of standard stock solution Preparation of standard stock solution of Ezetimibe (100μg/ml)
Accurately weighed Ezetimibe (10mg)
5333 Preparation of working standard solution
of Ezetimibe (1-6μg/ml)
From the above 100μg/ml stock
solution pippeted out 0.1ml, 0.2ml, 0.3ml, 0.4ml and 0.5ml and 0.6ml of solution and transferred to 10ml of volumetric flask and made up the volume up to 10ml with Methanol to produce concentration 1,2,3,4,5 and 6μg/ml respectively.
Preparation of standard stock solution of Fluvastatin (100μg/ml)
Accurately weighed Fluvastatin (10mg)
was transferred in to a 100ml volumetric flask, dissolved in Methanol and diluted to the mark with same solvent to obtain a standard stock solution (100μg/ml).
Preparation of working standard solution of Fluvastatin (8-48μg/ml)
From the above 100μg/ml stock
solution pippeted out 0.8ml, 1.6ml, 2.4ml, 3.2ml, 4ml and 4.8ml of solution and transferred to a 10ml volumetric flask and made up the volume up to 10ml with Methanol to produce concentration 8, 16, 24, 32, 40, and 48μg/ml respectively.
Procedure of selection of wavelength: 0.2 ml standard stock solution of Ezetimibe (100 μg/ml) and 1.6 ml standard stock solution of Fluvastatin (100 μg/ml) was transfer in 10 ml volumetric flask and dilute up to mark with Methanol to get the 2 μg/ml of Ezetimibe and 16 μg/ml of Fluvastatin. Each solution was scanned in the range 200 – 400 nm.
The Spectra are converted to First Order Derivative. The zero crossing point (ZCP) of Ezetimibe was found to be 245 nm and ZCP of Fluvastatin was found to be 270 nm. Hence, these wavelengths 245 nm and 270 nm were selected as analytical wavelengths.
Preparation of Calibration Curve Calibration curve for Ezetimibe:
An aliquots of stock solution of Ezetimibe (100 μg/ml) 0.1, 0.2, 0.3, 0.4, 0.5 and 0.6 ml were pipette out in 10 ml volumetric flask and was made up to the mark with Methanol which will give 1, 2, 3, 4, 5 and 6 μg/ml solution was prepared and absorbance was
measured at 270 nm in U.V.
Spectrophotometer.
Graph of Absorbance vs. Concentration (μg/ml) was plotted
Calibration curve for Fluvastatin:
An aliquots of stock solution of Fluvastatin (100 μg/ml) 0.8, 1.6, 2.4, 3.2, 4.0 and 4.8 ml were pipette out in 10 ml volumetric flask and was made up to the mark with Methanol which will give 8, 16, 24, 32, 40 and 48 μg/ml solution was prepared and absorbance was measured at 245 nm in U.V. Spectrophotometer.
Graph of Absorbance vs. Concentration (μg/ml) was plotted
METHOD VALIDATION: [9]
The developed method was validated with respect to linearity, accuracy, precision, limit of detection and limit of quantification in accordance with the ICH guideline. LINEARITY & RANGE (n=6):
The linearity of Ezetimibe and Fluvastatin was taken to be in the range of 1-6 μg/ml and 8-48 μg/ml respectively. Calibration curve of Absorbance Vs Concentration was plotted and from that slope, intercept, correlation coefficient and regression line equation for Ezetimibe and Fluvastatin was constructed.
PRECISION:
The precision of an analytical procedure expresses the closeness of agreement (degree of scatter) between a series of
measurements obtained from multiple
sampling of the same homogeneous sample under the prescribed conditions.
5334
Intermediate (Intraday) precision,
reproducibility (Interday precision),
repeatability.
1) Intraday precision (n=3):
Solutions containing 1, 2, 3 μg/ml of Ezetimibe and 8, 16, 24 μg/ml of Fluvastatin were analyzed three times on the same day and % RSD was calculated.
2) Interday Precision (n=3):
Solutions containing 1, 2, 3 μg/ml of Ezetimibe and 8, 16, 24 μg/ml of Fluvastatin were analyzed three different successive days and % RSD was calculated.
3) Repeatability (n=6):
Solutions containing 2 μg/ml of Ezetimibe and 16 μg/ml of Fluvastatin were analyzed for six times and % R.S.D was calculated. % R.S.D was not more than 2%.
LIMIT OF DETECTION (LOD):
Limit of Detection can be calculated using following equation as per ICH guidelines. LOD = 3.3 × (σ / S)
Where, σ = standard deviation of the Y intercept of calibration curve
S = Mean slope of the corresponding calibration curve.
LIMIT OF QUANTIFICATION (LOQ): Limit of Quantification can be calculated using following equation as per ICH guidelines.
LOQ = 10 × (σ / S)
Where, σ = standard deviation of the Y intercept of calibration curve
S = Mean slope of the corresponding calibration curve.
ACCURACY (RECOVERY STUDY)
(n=3):
The accuracy of an analytical procedure expresses the closeness of agreement between the value which is accepted either as a conventional true value or an accepted reference value and the value found. Accuracy of the developed method was confirmed by doing recovery study as per
ICH guideline at three different
concentration levels 50%, 100%, 150% and
the values were measured for Ezetimibe ( 2
μg/ml) and Fluvastatin (16 μg/ml). This performance was done in triplicate.
Preparation of sample solution:
The synthetic mixture of Ezetimibe and
Fluvastatin was prepared in ratio of 1:8
Accurately weighed equivalently weight
of Ezetimibe (10 mg) and Fluvastatin (80 mg) and transferred in 100 ml volumetric flask and made up to mark with methanol allow to sonicated.
0.2 ml from the above solution was
pipetted out. This solution was filtered through whatman filter paper. The filtrate was diluted to the mark with methanol. The mixture contains 2 μg/ml of Ezetimibe and 16 μg/ml of Fluvastatin.
ASSAY:
Preparation of Synthetic Mixture: [5] The synthetic mixture of Ezetimibe and Fluvastatin was prepared in ratio of 1:8
Common excipients, Microcrystalline
cellulose, Polyvinyl pyrrolidone,
Magnesium stearate, Lactose, Talc along with the drug Ezetimibe 10 mg and Fluvastatin 80 mg.
Accurately weighed equivalent weight of
Ezetimibe (10mg) and Fluvastatin
(80mg) and transferred in 100 ml volumetric flask and make up to half mark with methanol. This solution was sonicated and made up to mark with methanol.
This solution was filtered through
Whatman filter paper. The mixture contains 100 μg/ml of Ezetimibe and 800 μg/ml of Fluvastatin.
Preparation of Sample Solution:
Accurately 0.2 ml of the above solutions
was pipetted out into 10 ml volumetric flask and the volume was adjusted up to
5335
concentration of Ezetimibe was 2 μg/ml and Fluvastatin was 16 μg/ml.
RESULT AND DISCUSSION:
Selection of wavelength for Ezetimibe and Fluvastatin
To determine the wavelength for
measurement Ezetimibe (2 μg/ml) and Fluvastatin (16 μg/ml) solutions were
scanned between 400-200 nm.
Absorbance maximum were obtained at their λmax 245 nm and 270 nm for Ezetimibe and Fluvastatin respectively.
RP-HPLC Method
Experimental work:
Instrument and apparatus:
Shimadzu HPLC (LC- 2010 –CHT)
Instrument [software Lab solution]
Column-Thermo C-18 (250×4.6 mm,
5 μm)
Digital Analytical Balance – Wensar
DA 13–220 (India)
pH meter (Systronic India)
Sonicator – Equitron (India)
Volumetric flask – 10, 50 and 100
(Borosilicate)
Pipettes – 1, 2, 5 and 10 ml
(Borosilicate)
Beaker – (Borosilicate)
Chemicals and Materials:
Acetonitrile- Fisher India Ltd.
(HPLC grade)
Methanol- Fisher India Ltd. (HPLC
grade)
Water- Astron Chemical India.
(HPLC grade)
OPA (10% Ortho Phosphoric Acid) –
Krishna Chem Industry
Ezetimibe (Torrent Pharmaceuticals,
Ahmedabad)
Fluvastatin (Intas Pharmaceuticals,
Ahmedabad)
5.2 Selection of Detection Wavelength: The sensitivity of HPLC method that uses UV detection depends upon proper selection
of detection wavelength. Absorbance
maximum was obtained was at 235 nm. So, 235 nm was selected for detection of Ezetimibe and Fluvastatin in synthetic mixture.
5.3 Mobile phase selection:
Various composition and pH of mobile
phase were tried and changed for optimization. After number of trial experiments, it was established that the mobile phase ACN: water (pH 3.3 adjusts with Ortho phosphoric acid) (60:40 % v/v) shows good peak shape and resolution. The pKa value for Ezetimibe and Fluvastatin is 9.73 and 4.5 respectively.
Preparation of 10% Ortho phosphoric acid
10% Ortho phosphoric acid was
prepared by diluting 1.33 ml of
concentrated Orthophosphoric acid
(70%) in 10 ml HPLC grade water.
5.4 Chromatographic condition:
Column: Thermo C-18 (250 mm × 4.6
mm, 5 μm)
Mobile phase: ACN: Water (pH 3.3
adjusts with Ortho phosphoric acid)
(60:40 % v/v)
5336
Run time: 10 min
Detection wavelength: 235 nm
Detector: U.V Detector
Injection volume: 10 μl
5.5 Preparation of standard stock solution:
Ezetimibe (100 μg/ml):
Accurately weighed Ezetimibe (10 mg) was transferred to a 100 ml volumetric flask, dissolved and diluted to the mark with acetonitrile to obtain a standard stock solution (100 μg/ml).
Fluvastatin (100 μg/ml):
Accurately weighed Fluvastatin (10 mg) was transferred to a 100 ml volumetric flask, dissolved and diluted to the mark with acetonitrile to obtain a standard stock solution (100 μg/ml).
Method Validation
The developed method was validated
with respect to specificity, selectivity, linearity, accuracy, precision, limit of detection and limit of quantification, robustness, assay in accordance with the ICH guideline
Specificity
Specificity is the ability to assess unequivocally the analyte in the presence of components which may be expected to be present. Typically these might include impurities, degradants, matrix, etc.
Linearity & Range
The linearity of Ezetimibe and
Fluvastatin was found to be in the range
of 1-6µg/ml and 8-48 µg/ml
respectively.
Preparation of Calibration Curve
An aliquots of stock solution of
Ezetimibe (100 µg/ml) 0.1, 0.2, 0.3, 0.4, 0.5, 0.6 ml and Fluvastatin (100 µg/ml) 0.8, 1.6, 2.4, 3.2, 4, 4.8 ml was pipette out in 6 different 10ml volumetric flask, dissolved and diluted with mobile phase upto the mark to obtain concentration 1, 2, 3, 4, 5, 6 µg/ml of Ezetimibe and 8,
16, 24, 32, 40, 48 µg/ml of
Fluvastatin.10µl of each solution were
injected into HPLC system and
analyzed. Calibration curve was obtained by plotting peak area (µV.s) vs. Concentration (µg/ml). Linearity of both the drugs was checked in term of slope, intercept and correlation coefficient
Precision
The precision of an analytical procedure expresses the closeness of agreement (degree of scatter) between a series of measurements obtained from multiple sampling of the same homogeneous sample under the prescribed conditions. Precision may be considered at three levels: Intermediate (Intraday) precision,
reproducibility (Interday precision),
repeatability.
1. Intraday Precision (n=3): Solution containing 1, 2, 3 µg/ml of Ezetimibe and 8, 16, 24 µg/ml of Fluvastatin were analyzed three times on the same day and %RSD was calculated.
2) Interday Precision (n=3): Solution containing 1, 2, 3 µg/ml of Ezetimibe and 8, 16, 24 µg/ml of Fluvastatin were analyzed three different successive days and %RSD was calculated.
5337
Fluvastatin were analyzed for six times and %RSD was calculated. %RSD was not more than 2%.
Limit of Detection (LOD):
Limit of Detection can be calculated using following equation as per ICH guidelines.
LOD = 3.3 × (σ/S)
Where, σ = standard deviation of the Y intercept of calibration curve
S = Mean slope of the corresponding calibration curve.
Limit of Quantification (LOQ):
Limit of Quantification can be calculated using following equation as per ICH guidelines.
LOQ = 10 × (σ/S)
Where, σ = standard deviation of the Y intercept of calibration curve
S = Mean slope of the corresponding calibration curve
Accuracy:
The Accuracy of an analytical
procedure expresses the closeness of agreement between the value which is accepted either as a conventional true value or an accepted reference value and the value found. Accuracy of the developed method was confirmed by doing recovery study as per ICH guideline at three different concentration levels 50%, 100%, 150% and the values were measured at all wavelengths for Ezetimibe (2 μg/ml) and Fluvastatin (16 μg/ml). This performance was done in triplicate. The amount of Ezetimibe and Fluvastatin were
calculated at each level % recoveries by measuring the peak area and evaluating using specific equation.
Robustness
The robustness of an analytical procedure is a measure of its capacity to remain unaffected by small, but deliberate variation in method parameters and provides an indication of its reliability during normal usage. It should show the reliability of an analysis with respect to deliberate variation in method parameter.
In case of liquid chromatography,
examples of typical variations are:
Influence of variations of pH in
mobile phase;
Influence of variation in mobile
phase composition;
Different columns
Flow rate
System suitability tests
System suitability tests are an
integral part of liquid
chromatography. They are used to
verify that resolution and
reproducibility of chromatography system are adequate for the analysis to be done. The tests include Resolution (R), Column efficiency (N) and Tailing factor (T).
Assay:
Preparation of Synthetic Mixture of Ezetimibe and Fluvastatin:
Accurately weighed powder
5338
80mg Fluvastatin from the prepared synthetic mixture and transferred in 100 ml volumetric flask, dissolved and make up to the mark with
acetonitrile. This solution was
sonicated and filtered. The mixture contains 100 μg/ml of Ezetimibe and 800 μg/ml of Fluvastatin.
Preparation of Sample Solution:
From the above synthetic mixture
solution 0.2 ml was pipetted out into 10 ml volumetric flask and made up to the mark the with mobile phase to
obtain final concentration of
Ezetimibe 2 μg/ml and Fluvastatin 16 μg/ml.
Result and Discussion
Selection of Elution Mode
Reverse phase chromatography was
chosen because of its recommended use for ionic and moderate to non-polar compounds. Reverse phase chromatography is not only simple, convenient but also performs better in terms of efficiency, stability and reproducibility.
C18 column was selected because it
is least polar compare to C4 and C8
columns. C18 column allows eluting
polar compounds more quickly compare to non-polar compounds.
In addition to this UV detector is
used which allows easy detection of the compounds in UV transparent
organic solvents. Hence, C18
(250×4.6mm) column of 5µm
particles packing was selected for
separation of Ezetimibe and
Fluvastatin. Isocratic mode was
chosen due to simplicity in
application and robustness with respect to longer column stability.
Selection of Detection Wavelength:
The sensitivity of HPLC method that
uses UV detection depends upon
proper selection of detection
wavelength. Absorbance maximum was obtained was at 235 nm. So, 235 nm was selected for detection of Ezetimibe and Fluvastatin.
Chromatography
The mobile phase Acetonitrile: Water pH-3.3 (60:40%v/v) was selected because it was found to ideally resolve the peaks with retention time 6.58 min and 8.61 min for Ezetimibe and Fluvastatin, respectively. Thermo C18 (250×4.6 mm, 5 μm) column was used for separation of Ezetimibe and Fluvastatin with flow rate of 1.0 ml/min.
System suitability Parameters
The retention time, resolution, tailing factor and number of theoretical plates are shown in table. The values obtain demonstrated the suitability of the system for the analysis of these drugs in combination.
Method Validation:
SPECIFICITY:
It was prove by comparing the
chromatogram of mobile phase, standard solution and test preparation solution to that there was no peak of mobile phase and no any interference of excipients with the peak of
Ezetimibe and Fluvastatin.
LINEARITY
The linearity of Ezetimibe and
5339 Table 1:- Melting Point of Ezetimibe and Fluvastatin
S.No Drug Reported melting point Observed melting
point
1 Ezetimibe 164-166°C 164-167°C
2 Fluvastatin 194-197°C 194-198°C
IR spectral determination: A) Ezetimibe
Fig 1 Structure of Ezetimibe
5340 Fig 3 Sample IR Spectra of Ezetimibe
TABLE 2:- Interpretation of FT-IR spectra of Ezetimibe
S. No. Functional group Characteristic
Standard Absorption (cm-1)
Observed Absorption (cm-1)
1 C-F 1400-1000 1265.3
2 C=C 1600-1450 1512.19
3 O-H 3550-3200 3286.7
4 C=O 1750-1680 1712.79
5 C-N 1350-1000 1219.01
6 C-H 3040-3010 3029.38
B) Fluvastatin
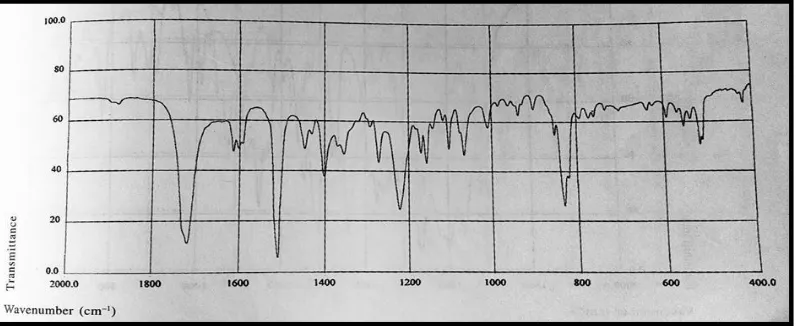
5341 Fig 5 Fluvastatin Reference IR spectra
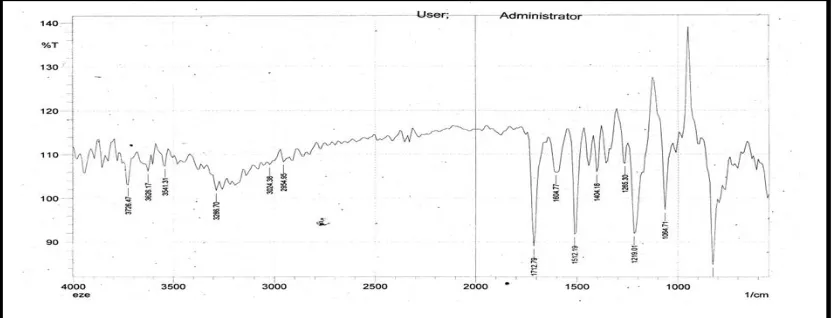
Fig 6 Sample IR Spectra of Fluvastatin
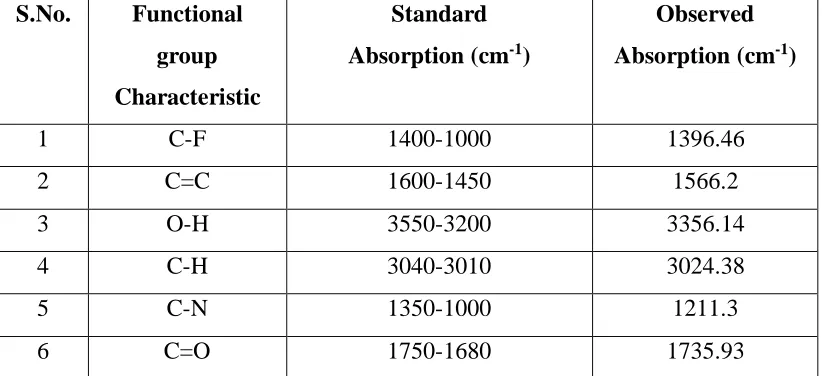
TABLE 3:- Interpretation of FT-IR spectra of Fluvastatin
S.No. Functional group Characteristic
Standard Absorption (cm-1)
Observed Absorption (cm-1)
1 C-F 1400-1000 1396.46
2 C=C 1600-1450 1566.2
3 O-H 3550-3200 3356.14
4 C-H 3040-3010 3024.38
5 C-N 1350-1000 1211.3
5342 UV Identification:
Table 4 Wavelength of Ezetimibe and Fluvastatin
Drug Reported λmax
(Methanol)
Observed λmax (Methanol)
Ezetimibe 230nm 230nm
Fluvastatin 305nm 304nm
Fig 7 UV Spectra of Ezetimibe (2μg/ml)
5343 Table 5:- Solubility of Ezetimibe and Fluvastatin
Solvent Ezetimibe Fluvastatin
Water Insoluble Soluble
Methanol Soluble Soluble
Fig 9: Zero crossing point of Ezetimibe at 245 nm (2μg/ml) and Fluvastatin at 270 nm (16μg/ml)
LINEARITY AND RANGE:
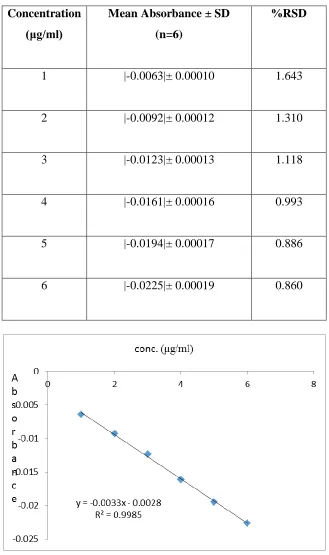
5344 TABLE: 6 Linearity data of Ezetimibe
Concentration (μg/ml)
Mean Absorbance ± SD (n=6)
%RSD
1 |-0.0063|± 0.00010 1.643
2 |-0.0092|± 0.00012 1.310
3 |-0.0123|± 0.00013 1.118
4 |-0.0161|± 0.00016 0.993
5 |-0.0194|± 0.00017 0.886
6 |-0.0225|± 0.00019 0.860
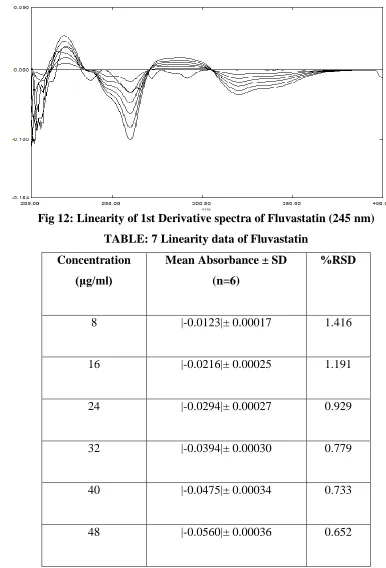
5345 Fig 12: Linearity of 1st Derivative spectra of Fluvastatin (245 nm)
TABLE: 7 Linearity data of Fluvastatin Concentration
(μg/ml)
Mean Absorbance ± SD (n=6)
%RSD
8 |-0.0123|± 0.00017 1.416
16 |-0.0216|± 0.00025 1.191
24 |-0.0294|± 0.00027 0.929
32 |-0.0394|± 0.00030 0.779
40 |-0.0475|± 0.00034 0.733
5346 Fig 13: Calibration Curve of Fluvastatin (8-48 µg/ml)
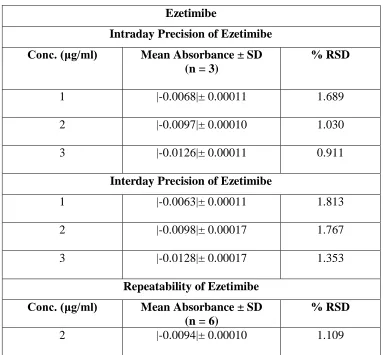
PRECISION:TABLE 8: Precision study of Ezetimibe Ezetimibe
Intraday Precision of Ezetimibe Conc. (μg/ml) Mean Absorbance ± SD
(n = 3)
% RSD
1 |-0.0068|± 0.00011 1.689
2 |-0.0097|± 0.00010 1.030
3 |-0.0126|± 0.00011 0.911
Interday Precision of Ezetimibe
1 |-0.0063|± 0.00011 1.813
2 |-0.0098|± 0.00017 1.767
3 |-0.0128|± 0.00017 1.353
Repeatability of Ezetimibe Conc. (μg/ml) Mean Absorbance ± SD
(n = 6)
% RSD
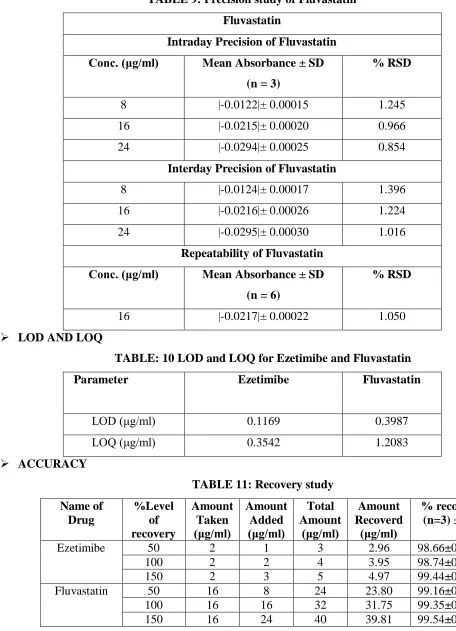
5347 TABLE 9: Precision study of Fluvastatin
Fluvastatin
Intraday Precision of Fluvastatin Conc. (μg/ml) Mean Absorbance ± SD
(n = 3)
% RSD
8 |-0.0122|± 0.00015 1.245
16 |-0.0215|± 0.00020 0.966
24 |-0.0294|± 0.00025 0.854
Interday Precision of Fluvastatin
8 |-0.0124|± 0.00017 1.396
16 |-0.0216|± 0.00026 1.224
24 |-0.0295|± 0.00030 1.016
Repeatability of Fluvastatin Conc. (μg/ml) Mean Absorbance ± SD
(n = 6)
% RSD
16 |-0.0217|± 0.00022 1.050
LOD AND LOQ
TABLE: 10 LOD and LOQ for Ezetimibe and Fluvastatin
Parameter Ezetimibe Fluvastatin
LOD (μg/ml) 0.1169 0.3987
LOQ (μg/ml) 0.3542 1.2083
ACCURACY
TABLE 11: Recovery study Name of
Drug
%Level of recovery
Amount Taken (μg/ml)
Amount Added (μg/ml)
Total Amount
(μg/ml)
Amount Recoverd
(μg/ml)
% recovery (n=3) ± SD
Ezetimibe 50 2 1 3 2.96 98.66±0.0208
100 2 2 4 3.95 98.74±0.0251
150 2 3 5 4.97 99.44±0.0321
Fluvastatin 50 16 8 24 23.80 99.16±0.0264
100 16 16 32 31.75 99.35±0.0351
5348 TABLE: 12 Analysis of synthetic mixture
Name of Drug Amount in Synthetic Mixture Taken
(μg/ml)
Amount Found (μg/ml)
% Assay (n=3) ± SD
Ezetimibe 2 1.97 98.56 ±0.0360
Fluvastatin 16 15.86 99.15 ±0.0416
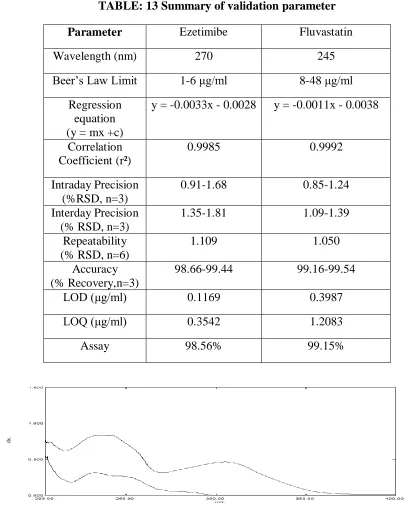
TABLE: 13 Summary of validation parameter
Parameter Ezetimibe Fluvastatin
Wavelength (nm) 270 245
Beer’s Law Limit 1-6 μg/ml 8-48 μg/ml
Regression equation (y = mx +c)
y = -0.0033x - 0.0028 y = -0.0011x - 0.0038
Correlation Coefficient (r²)
0.9985 0.9992
Intraday Precision (%RSD, n=3)
0.91-1.68 0.85-1.24
Interday Precision (% RSD, n=3)
1.35-1.81 1.09-1.39
Repeatability (% RSD, n=6)
1.109 1.050
Accuracy (% Recovery,n=3)
98.66-99.44 99.16-99.54
LOD (μg/ml) 0.1169 0.3987
LOQ (μg/ml) 0.3542 1.2083
Assay 98.56% 99.15%
5349 Optimization of Chromatographic conditions:
Table 7.1: Mobile phase optimization trial for Ezetimibe and Fluvastatin
Trial Mobile Phase Ratio (v/v) Remark
1
ACN : Water(pH= 3.5)
70:30 Less resolution was obtained
2
ACN : Water(pH= 3.5)
65:35 Less resolution was obtained
3
ACN : Water(pH= 3.5)
62:38 Less resolution was obtained
4
ACN : Water(pH= 3.5)
60:40 Less resolution was obtained
5
ACN : Water(pH= 3.3)
60:40 Good resolution, with sharp
peak Retention Time Ezetimibe- 6.5 min Fluvastatin- 8.6 min
Fig 15 Chromatogram of Ezetimibe and Fluvastatin in ACN: Water (pH 3.5) (70:30%v/v)
5350 Fig 17 Chromatogram of Ezetimibe and Fluvastatin in ACN: Water (pH 3.5) (62:38%v/v)
Fig 18 Chromatogram of Ezetimibe and Fluvastatin in ACN: Water (pH 3.5) (60:40%v/v)
Fig 19 Chromatogram of Ezetimibe (2 μg/ml) and Fluvastatin (16 μg/ml) in
5351 Table 14: System suitability parameter
Parameter Retention Time
Tailing Factor
Number of Theoretical
Plate
Resolution
Ezetimibe 6.589 1.134 84266 -
Fluvastatin 8.613 1.112 99565 7.436
Fig 20: Chromatogram of Blank in ACN: Water (pH 3.3) (60: 40 %v/v)
5352 Fig 22: Chromatogram of Fluvastatin (16 μg/ml) in ACN: Water (pH 3.3)
(60: 40 %v/v)
LINEARITY
The linearity of Ezetimibe and Fluvastatin was found to be 1- 6μg/ml and
8-48μg/ml,respectively.
Fig 23: Overlay chromatogram of Ezetimibe and Fluvastatin in ACN: Water (pH 3.3) (60: 40 %v/v)
5353 TABLE 15: Linearity data of Ezetimibe
Concentration (μg/ml) Mean Peak Area (µV*sec) ± SD (n=6)
%RSD
1 138356 ± 1006.51 0.7274
2 268079 ± 1623.04 0.6054
3 410600 ± 2398.83 0.5842
4 556680 ± 2416.24 0.4340
5 686430 ± 2545.84 0.3708
6 853136 ± 2705.57 0.3171
Fig 24: Calibration Curve of Ezetimibe (1-6 µg/ml)
900000
800000
700000 y = 142144x - 11956 R² = 0.9989
600000
500000
400000
300000
200000
100000
0
0 1 2 3 4 5 6 7
5354 TABLE 16: Linearity data of Fluvastatin
Concentration (μg/ml) Mean Peak Area (µV*sec) ± SD (n=6)
%RSD
8 267931 ± 2159.96 0.8061
16 605436 ± 4344.19 0.7175
24 931562 ± 5929.91 0.6365
32 1251983 ± 7311.09 0.5839
40 1550617 ± 8061.51 0.5198
48 1925339 ± 8431.53 0.4379
Fig 25: Calibration Curve of Fluvastatin (8-48 µg/ml)
250000 0
200000 0
y = 40868x - 55488 R² = 0.9993
150000 0
100000 0
50000 0
0
0 10 20 30 40 50 60
5355 PRECISION
TABLE 17: Precision study of Ezetimibe
TABLE 18: Precision study of Fluvastatin Fluvastatin
Intraday Precision of Fluvastatin
Conc. (μg/ml) Mean Peak Area (µV*sec)
± SD (n = 3)
% RSD
8 266943 ± 1917.56 0.7183
16 606834 ± 3881.94 0.6397
24 923116 ± 4625.67 0.5010
Interday Precision of Fluvastatin
8 267043 ± 2175.67 0.8147
Ezetimibe
Intraday Precision of Ezetimibe Conc. (μg/ml) Mean Peak Area (µV*sec)
± SD (n = 3)
% RSD
1 139028 ± 907.98 0.6530
2 266819 ± 1558.35 0.5840
3 408838 ± 1770.13 0.4329
Interday Precision of Ezetimibe
1 138563 ± 994.65 0.7178
2 267436 ± 1699.62 0.6355
3 409182 ± 2032.87 0.4968
Repeatability of Ezetimibe Conc. (μg/ml) Mean Peak Area (µV*sec)
± SD (n = 6)
% RSD
5356
16 606368 ± 4673.54 0.7707
24 924033 ± 5202.91 0.5630
Repeatability of Fluvastatin
Conc. (μg/ml) Mean Peak Area (µV*sec)
± SD (n = 6)
% RSD
16 605453 ± 4189.78 0.6920
ACCURACY
TABLE 19: Recovery study Name of
Drug
%Level of recovery
Amount Taken (μg/ml)
Amount Added (μg/ml)
Total Amount
(μg/ml)
Amount Recoverd
(μg/ml)
% Recovery
± SD (n=3)
Ezetimibe 50 2 1 3 2.98 99.37 ± 0.2250
100 2 2 4 3.98 99.58 ± 0.2451
150 2 3 5 4.99 99.84 ± 0.3629
Fluvastatin 50 16 8 24 23.85 99.36 ± 0.2857
100 16 16 32 31.89 99.62 ± 0.3781
150 16 24 40 39.91 99.71 ± 0.4738
LOD and LOQ
TABLE: 20: LOD and LOQ Data
Parameter Ezetimibe Fluvastatin
LOD (μg/ml) 0.0438 0.2785
LOQ (μg/ml) 0.1330 0.8441
ASSAY
TABLE 21: Analysis of synthetic mixture Name of Drug Amount Taken
(μg/ml)
Amount Found
(μg/ml)
% Assay ± SD
(n=3)
Ezetimibe 2 1.99 99.56 ± 0.3356
5357
ROBUSTNESS
Table 22: Robustness data of Ezetimibe and Fluvastatin
Condition Variation Ezetimibe Fluvastatin
% Assay ± SD (n=3)
% Assay ± SD (n=3)
Detection wavelength
(235 ±2nm)
233 nm 98.39 ± 0.5230 98.52 ± 0.2128 235 nm 99.54 ± 0.3547 99.78 ± 0.4573
237 nm 98.60 ± 0.2343 98.63 ± 0.5392 Change in Mobile
Phase composition ACN: Water (pH
3.3)
(60:40 ±2v/v)
58:42 98.42 ± 0.3774 98.33 ± 0.2663 60:40 99.61 ± 0.2809 99.48 ± 0.3601
62:38 98.36 ± 0.5196 98.28 ± 0.4064
TABLE: 23: Summary of Validation Parameter
Parameter Ezetimibe Fluvastatin
Linearity Range 1-6 μg/ml 8-48 μg/ml
Regression equation
(y = mx +c)
y = 142144x - 11956 y = 40868x – 55488
Correlation Coefficient (r²) 0.9989 0.9993
Intraday Precision (%RSD,
n=3)
0.4329 - 0.6530 0.5010 - 0.7183
Interday Precision
(% RSD, n=3)
0.4968 - 0.7178 0.5630 - 0.8147
Repeatability
(% RSD, n=6)
0.5972 0.6920
Accuracy
(% Recovery, n=3)
99.37 - 99.84 99.36 - 99.71
LOD (μg/ml) 0.0438 0.2785
LOQ (μg/ml) 0.1330 0.8441
5358 CONCLUSION
Simple, rapid, accurate and precise RP-HPLC and UV spectrophotometric methods have been developed and validated for the routine analysis of Ezetimibe and Fluvastatin in synthetic mixture. Both methods are suitable for
the simultaneous determination of
Ezetimibe and Fluvastatin in multi
component formulation without
interference of each other. The amount found from the proposed methods were found in good agreement with the label claim of the formulation. Also the value of standard deviation and coefficient of variation calculated were satisfactorily low, indicating the suitability of the proposed methods for the routine estimation of combination dosage forms.
ACKNOWLEDGEMENT
We are heartly thankful to Dr. K. Pundarikakshudu, Director of L.J Institute of Pharmacy, Ahmedabad for providing all the facilities and the valuable Guidance during the Research work.
REFERENCES:
1. Rang H., Dale M., Ritter J., Flower R.
Rang Dale’s pharmacology; 6th Edn;
Elsevier Publication, 2007, pp 285-291.
2. Roger W., Cate W., Clinical Pharmacy
and Therapeutics; 4th Edn; Elsevier
Publication, 2007, pp 346-366.
3. Winfried Marz," Fluvastatin
combination with ezetimibe in patients with high cardiovascular risk", Clinical
Trail.gov, August 2017.
4. Maryadele NJ., The Merck Index an
Encyclopedia of chemicals drugs and
biological; 14th Edn; Merck Research
Laboratories, UK, 2006, pp 668,722
5. Rowe RC., Sheskey PJ., Quinn ME.
Handbook of Pharmaceutical Excipients;
6th Edn; Pharmaceutical press, London,
2009, pp 129-133, 210-214, 404-407, 663-666, 728-730.
6. Smith., Introduction to Ultraviolet
(U.V.) Spectroscopy; pp 597-599.
7. Skoog DA., Hollar JA., Nieman TA.,
Principle of Instrumental Analysis; 5th
Edn; Thomsan Asia Pvt. Ltd, pp 300-328, 725-744.
8. Owen T., Fundamentals of UV-visible
Spectroscopy; Hewlett-Packard
publication, pp 38-45.
9. ICH Q2 (R1), 2005, Validation of
Analytical Procedure: Text and
Methodology, International Conference on Harmonization, IFPMA, Geneva, Switzerland.
10.Beckett AH., Stenlake JB., Practical
Pharmaceutical Chemistry, 4thEdn; CBS
Publication, 2001 part 1, pp 87.
11.Willard HH., Merritt LL Jr., Dean JA.,
and Settle FJ Jr., Instrumental Method of
Analysis, 7th Edn, CBS Publisher &