DEMOGRAPHIC RESEARCH
VOLUME 29, ARTICLE 5, PAGES 105-132
PUBLISHED 23 JULY 2013
http://www.demographic-research.org/Volumes/Vol29/5/ DOI: 10.4054/DemRes.2013.29.5
Research Article
Distortion of regional old-age mortality due to
late-life migration in the Netherlands?
Eva Kibele
Fanny Janssen
© 2013 Eva Kibele & Fanny Janssen.
This open-access work is published under the terms of the Creative Commons Attribution NonCommercial License 2.0 Germany, which permits use, reproduction & distribution in any medium for non-commercial purposes, provided the original author(s) and source are given credit.
1 Introduction 106
2 Data & methods 109
3 Results 111
3.1 Old-age migration intensities 111
3.2 Differences in regional old-age mortality levels: Observed versus
hypothetical situation 111
3.3 Differences in regional old-age mortality patterns: Observed vs.
hypothetical situation 113
3.4 Summary of results 116
4 Sensitivity analysis 15
5 Explanations of the observed results 117
5.1 Selective migration and health 117
5.2 Distortion explained by the regional distribution of nursing care
institutions 118
5.3 Importance of regional level and migration intensity 119
6 Final conclusion and implications 119
References 121
Distortion of regional old-age mortality due to late-life migration in
the Netherlands?
Eva Kibele1,2 Fanny Janssen1, 3
Abstract
BACKGROUND
Regional mortality differences are an important public health indicator and can serve as the basis for population forecasts and local planning. Health-related migration at old age may distort observed regional mortality.
OBJECTIVE
We assess whether or not internal migration in late life has the potential for distortion of regional old-age mortality rates and differences therein.
DATA AND METHODS
Using data from the Dutch population register, we analyzed migration and death rates in the population aged 80 years and above across the Dutch NUTS 2 regions, NUTS 3 regions and municipalities in the years 2002 through 2006. Observed sex-specific age-standardized death rates—and regional differences therein—are compared to hypothetical mortality rates, which disregard internal migration in the three years prior to death.
RESULTS
Late-life internal migration intensities were highest at municipality level, for women, and for those who died. Almost half of the municipalities showed differences of more than ±5% between the observed and hypothetical mortality rates. Many of the municipalities, whose observed mortality rates differed significantly from the Dutch average, displayed no significant difference from the average in the hypothetical scenario. Regional mortality variation across the municipalities decreased significantly
1 Population Research Centre, Faculty of Spatial Science, University of Groningen, The Netherlands. 2 Healthy Ageing: Population and Society (HAPS), University of Groningen, The Netherlands.
if late-life migration was disregarded. Differences were larger for women than men. Minimal differences appeared between the observed situation and hypothetical scenario at NUTS 2 and NUTS 3 levels.
CONCLUSION
Late-life migration can significantly distort regional old-age mortality. Mortality risk factors therefore appear to be more equally distributed than the observed rates imply. The bias depends on age, regional level, migration intensity, and the role of nursing care.
1. Introduction
Geographical inequalities in mortality are important, and exist not only between countries, but also within countries (Eurostat, 2009). Regional mortality reflects the overall health status of the population in a region (e.g., Ezzati et al. 2008; Strohmeier et al. 2007). It is a frequently used public health indicator, and constitutes important information for health policy makers. Regional population forecasts, on which public planning is based, also require knowledge of differences in regional mortality.
Regional mortality differences may result from differences in the composition of regional populations, according to attributes associated with different mortality risks (e.g., age, socioeconomic status, and lifestyle) and hence from the spatial concentration of individuals with adverse health risks. Furthermore, regional mortality differences may result from differences in area-level contextual factors, such as the availability of health care facilities or the physical environment (Diez Roux and Mair 2010). However, it is often ignored that mortality rates and resulting regional mortality patterns can be biased as a result of selective migration flows as well (Bentham 1988; Boyle 2004; Veugelers and Hornibrook 2002).
Migration is health-selective. At working age, movers tend to be healthier than stayers; at older ages moves are often related to a poor health (Boyle 2004). As a result of health-selective migration, the place of residence where a death is recorded may not adequately reflect the individual's regional exposure over the life course (Bentham 1988; Boyle et al. 2002; Boyle 2004; Litwak and Longino 1987). Consequently, selective migration may distort regional mortality rates and differences therein.
people with poorer health than those who left the region (Boyle et al. 2002; Boyle 2004; Brimblecombe et al. 2000; Connolly et al. 2007; Norman et al. 2005; Verheij et al. 1998). In general, widening health and mortality inequalities across regions due to selective migration were observed at working ages (Boyle 2004; Brimblecombe et al. 2000; Connolly et al. 2007; Norman et al. 2005). However, there is also evidence that migration does not influence, or does even-out area-level health inequalities (Ezzati et al. 2008; Jongeneel-Grimen et al. 2011). Reasons for the latter case include the possibility that migration is less selective based on health, but more based on socioeconomic status. The choice of health indicator, time period, geographical level and age group can also determine whether migration influences area-level health inequalities (Boyle et al. 2002; Jongeneel-Grimen et al. 2011; Verheij et al. 1998).
Given the differential relationship between health and migration across ages, the effect of selective migration on regional mortality differences is likely to change when considering old ages instead of adult ages. At older ages, moves are often related to a decline in health status (Bentham 1988; Boyle 2004). Litwak and Longino (1987) have proposed a distinction between three types of moves among the elderly. The first type of move is retirement migration, and is made while the mover still enjoys reasonable health and income at a relatively young age. A second type of move is associated with declining health status and moderate disability, which introduces the need for informal care. When severe disability occurs, a third type of move to a care institution for formal care may be required. Empirical research has found evidence that supports the relationship between health and migration in late life (e.g., Bloem et al. 2008; Grundy 2011; Uren and Goldring 2007; Wilmoth 2010).
Migration at old age is less frequent than at working age, but is still substantial. The extent of old-age migration depends on several factors, such as regional scale, or age groups considered. Among the elderly, migration rates tend to be highest among the younger elderly, as well as among the older olds (Harrop and Grundy 1991; Sergeant et al. 2008). Sergeant et al. (2008)—in their comparison of different studies involving those aged 55 years and over at different geographical scales in the USA—found migration rates of about 5-30% in a 5-year period among the elderly. Migration rates of about 30-35% for a 9-10 year period were found for elderly in the Netherlands and the United Kingdom (Bloem et al. 2008; Uren and Goldring 2007).
remaining life expectancy is low (Jonker et al. 2013; Veugelers and Hornibrook 2002). Jonker et al. (2013) found that late-life migration into nursing care institutions “artificially” increases neighborhood-level mortality variation in the metropolitan agglomeration of Amsterdam.
The extent of the effect of late-life migration on mortality at different sub-national levels remains yet unknown.
Given that people still move at older ages and the strong relation of age to health, old-age migration has the potential to distort the observed regional old-age mortality rates and existing regional differences therein. Regional mortality differentials exist at all ages, including old age (Caselli and Lipsi 2006; Eurostat 2009; Luy 2006).
Because of the growing importance of old-age mortality in overall mortality—with currently more than half of deaths taking place after the age of 75 in Western countries (Human Mortality Database 2012)—a potential bias of old-age mortality due to late-life migration may even exert its influence on overall mortality measures such as life expectancy at birth.
This study seeks to assess whether or not internal migration in late life has the potential to distort the regional old-age mortality rates and differences therein. We examine the case of the Netherlands and distinguished different regional levels.
In our discussion, we contribute to a generalization for other country settings. The Netherlands exhibits important regional mortality differences, which persist into older ages (Deuning and den Hertog 2012; Eurostat 2009). Regional migration patterns of elderly people in the country are rather extreme at the small-area level. These migration patterns appear to be correlated with the unequal availability of care facilities across municipalities (Fokkema and van Wissen 1994; Rees et al. 1998).
2. Data & methods
In our study, we focus on the effect of late-life migration on regional mortality levels and differences therein for people aged 80 and over in the period 2002-2006 for the Netherlands. We distinguished three regional levels according to the European Nomenclature of Territorial Units for Statistics (NUTS; NUTS 1: 3-7 million, NUTS 2: 0.8-3 million, NUTS 3: 0.15-0.8 million; Eurostat, 2007). The three regional levels studied refer to the Dutch NUTS 2 regions (provinces; N=12; average population size in 2006: 1.36m), NUTS 3 regions (N=40; average population size in 2006: 0.41m) and municipalities (N=431 in 2010; average population size in 2006: 38000). Through the Dutch population register, information on individuals’ age, sex, place of residence, date of death and migration history was retrieved. The Dutch population register has the advantage of covering all those who reside in the Netherlands (Prins 2000).
Mortality rates are calculated by dividing the number of deaths by the exposure time. People enter the study population when they are aged 80 years or above before January 1, 2002, or from the moment they turn 80, between January 1, 2002 and December 31, 2006. Age is defined as the age reached during the year. Exposure time is measured in months. Mortality, migration and birthdays are assumed to take place in the middle of a month. People leaving the country are right-censored, and contribute to the exposure until the time of emigration. Likewise, immigrants contribute to the population exposure from the time of entry into the country. Effects of international migration are negligible in this study, as less than 1% in the age group under study immigrated or emigrated.
Mortality rates that are conventionally calculated (referred to as observed mortality rates) are contrasted with mortality rates in which moves that take place close to death are disregarded (referred to as hypothetical mortality rates). We chose to consider moves that took place three years or less before the last observation point, which is either the date of death or December 31, 2006, for those who were alive. The choice of three years as a threshold follows from our aim to capture all health-related moves, and a comparison of the timing of moves within the five years before the last observation between those who died and the survivors. For this comparison, additional migration data over the period 1997-2006 was used. Among survivors, 69% of the moves in the five years before the last observation were made in the three years before the last observation, and hence, 31% of the moves were made four or five years before the last observation. Among those who died, however, the respective percentages where 74% and 26%. This indicates that among those who died, more moves took place more recently, i.e. closer to the last observation, than among the survivors.
case migration had occurred in the three years prior to death. In order to capture changes in place of residence correctly among survivors and non-survivors, we also considered the moves in the three years before death of those dying in the period 2007-2009. In the case that someone died in the period 2007-2009, and moved in the three years before death, the person years lived in the study period were adjusted if the move took place in the period 2004-2006.
In order to assess the influence of migration movements prior to death, we compare the percentage of people aged 80 years and above who moved in the three years prior to the last observation by different regional level, by sex, and by whether or not they died in 2002-2006, or survived.
We compare the observed and hypothetical mortality rates through directly age-standardized death rates for the population aged 80 years and above (SDRs, per 1,000 population). For this purpose, the rates are calculated in 5-year age groups with age group 95 or more years as the highest age group, by sex and by region. The Dutch sex-specific population aged 80 years or over in 2002-2006 is used as the standard. If the observed SDR is greater than the hypothetical SDR, this means that people moved into the region and died there. Mortality is then higher, compared to what normally takes place in the absence of such moves. We plot the percentage difference between observed and hypothetical SDRs and check for significant differences by comparing the 95% confidence intervals (CI) of observed and hypothetical SDRs per regional unit. SDRs were not considered if the total number of deaths was less than 15 in a municipality for men or for women and in any scenario. This affected the municipalities Schiermonnikoog, Vlieland and Rozendaal, resulting in 428 municipalities with valid SDRs.
A comparison of regional mortality patterns is made for the observed and hypothetical SDRs by examining how many and which regions had SDRs significantly different from the Dutch average, based on 95% confidence intervals. In addition, we assess whether the regional mortality variation differs significantly between the observed and hypothetical situation by means of the F-test of equality of variance, based on population-weighted standard deviation of the SDR. The population-weighted standard deviation is calculated by weighting the SDR in the regions with respective sex-specific population size at age 80 years and above.
3. Results
3.1 Old-age migration intensities
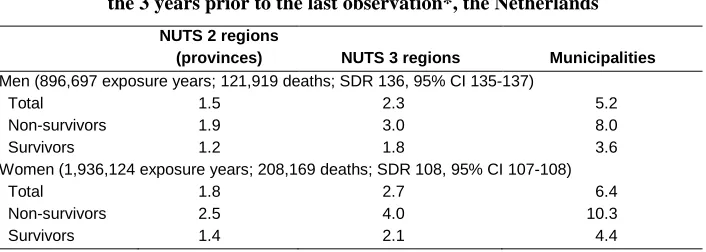
The migration intensity among people aged 80 years or older in the three years prior to the last observation differs greatly according to the regional borders that are crossed (Table 1). Whereas 1.5% of men and 1.8% of women moved to another NUTS 2 region, 2.3% and 2.7% respectively moved to another NUTS 3 region and 5.2% (6.4%) moved to another municipality. In addition, there are clear differences in migration intensities between those who died in 2002-2006 and those who survived until the end of the observation period. The migration intensity of the non-survivors is more than 50% higher compared to survivors, and even more than twice as high for those crossing municipality borders. Women move more frequently than men.
Table 1: Percentage of those aged 80 and above in 2002-2006 who moved in
the 3 years prior to the last observation*, the Netherlands
NUTS 2 regions
(provinces) NUTS 3 regions Municipalities
Men (896,697 exposure years; 121,919 deaths; SDR 136, 95% CI 135-137)
Total 1.5 2.3 5.2
Non-survivors 1.9 3.0 8.0
Survivors 1.2 1.8 3.6
Women (1,936,124 exposure years; 208,169 deaths; SDR 108, 95% CI 107-108)
Total 1.8 2.7 6.4
Non-survivors 2.5 4.0 10.3
Survivors 1.4 2.1 4.4
Note: * date of death for non-survivors; date of censoring for survivors, i.e. mainly December 31, 2006.
3.2 Differences in regional old-age mortality levels: Observed versus hypothetical situation
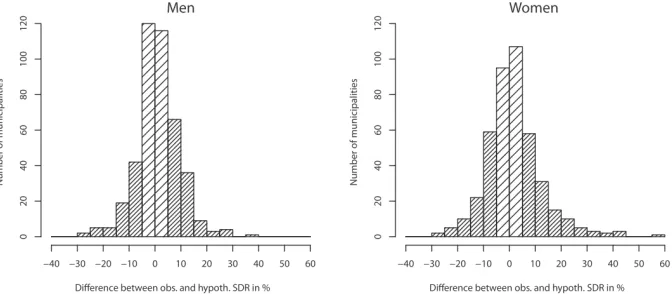
Relative differences between observed and hypothetical SDRs in the municipalities are shown in Figure 1. For men and women, 192 (45%; 119 higher, 73 lower) and 226 (53%; 128 higher, 98 lower) of the 428 municipalities respectively encountered differences of more than ±5% in the mortality rates between observed and hypothetical mortality situations. A difference of more than ±10% between observed and hypothetical mortality rates occurred in 84 (20%; 53 higher, 31 lower) municipalities among men and in 109 (26%; 70 higher, 39 lower) municipalities among women. Men encountered smaller relative differences than did women.
Few significant differences in mortality rates are observed. One municipality in the case of men and six municipalities in the case of women experienced a significant difference between the observed and hypothetical mortality rates.
Figure 1: Percentage difference between observed and hypothetical SDR at
ages 80 and above in the Dutch municipalities studied, by sex (dark shading refers to more than ±5% difference between observed and hypothetical SDRs)
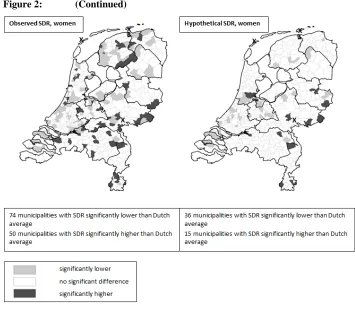
3.3 Differences in regional old-age mortality patterns: Observed vs. hypothetical situation
Differences between the observed and hypothetical SDRs are also related to regional mortality patterns. There are clear regional differences in old-age mortality at the municipality level in the Netherlands over the period 2002-2006 (Figure 2; left plots). Among men, 33 of the 428 municipalities have SDRs significantly (5% level) below the average of 136 deaths per 1000, and 32 municipalities have SDRs significantly above. Among women, the average SDR is 108, and 74 and 50 municipalities respectively exhibit significantly different values below and above the Dutch average. If late-life migration among those who died in the observation period is disregarded (Figure 2; right plots), the regional mortality pattern at the municipality level changes considerably, with far fewer regions experiencing significant differences, compared to the average level. For men, this results in 22 and 17 municipalities with mortality patterns that are significantly below or above the average, respectively. For women, the numbers are 36 and 15 respectively.
For 56 of the municipalities, in the case of men, and 96 municipalities for women, a comparison with the Dutch average yields different results before and after disregarding migration among the non-survivors—mostly from a significant difference to a non-significant difference (39 and 84 for men and women respectively).
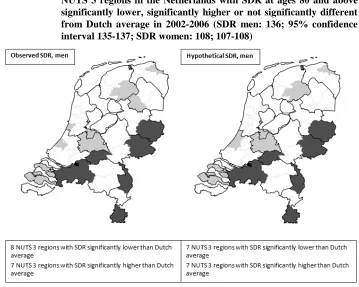
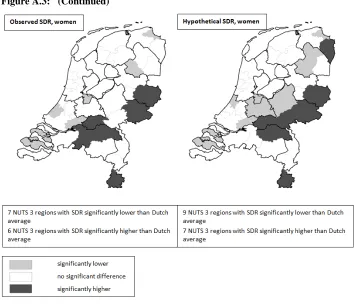
At the NUTS 3 level (N=40; Figure A.3), there are some differences in the regional mortality pattern in the conventional approach as compared to the hypothetical approach, with three regions among men and nine regions among women experiencing a change in significant difference, compared to the average. Overall, the number of regions experiencing either significantly lower or higher mortality than average remains approximately similar.
At the provincial level (NUTS 2; N=12; Figure A.4), there are no differences between the observed and hypothetical regional mortality patterns for females; three provinces are significantly below and above the Dutch average in both approaches. Among men, the conventional situation reveals six provinces with mortality significantly below the Dutch average and three provinces with mortality significantly above the Dutch average. In the hypothetical scenario, the province of North Holland no longer displays a SDR significantly below the Dutch average.
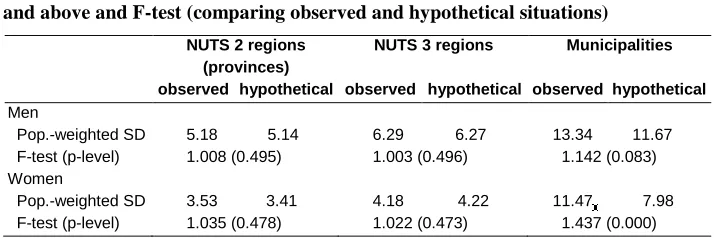
Table 2: Population-weighted standard deviation of SDR per 1,000 at age 80 and above and F-test (comparing observed and hypothetical situations)
NUTS 2 regions (provinces)
NUTS 3 regions Municipalities
observed hypothetical observed hypothetical observed hypothetical
Men
Pop.-weighted SD 5.18 5.14 6.29 6.27 13.34 11.67
F-test (p-level) 1.008 (0.495) 1.003 (0.496) 1.142 (0.083)
Women
Pop.-weighted SD 3.53 3.41 4.18 4.22 11.47 7.98
F-test (p-level) 1.035 (0.478) 1.022 (0.473) 1.437 (0.000)
3.4 Summary of results
Internal migration intensities among those aged 80 years and over in 2002-2006 in the three years prior to the last observation are higher between municipalities than between NUTS 3 and NUTS 2 regions, higher for women than men, and higher for those who died in the observation period.
Almost half of the municipalities demonstrate differences of more than ±5% between the observed and hypothetical mortality rates. Only a few municipalities have SDRs that significantly differ between the observed situation and the hypothetical scenario. However, the mortality patterns differ between the scenarios. Many of the municipalities, whose observed mortality rates differ significantly from the Dutch average, display no significant difference from the Dutch average in the hypothetical situation. Further, the regional mortality variation across the municipalities decreases significantly if migration prior to death is disregarded. Greater differences between the scenarios are observed for women as compared to men.
The comparison between observed and hypothetical mortality rates across NUTS 2 and NUTS 3 regions yields small and statistically insignificantdifferences. Also, non-significant differences are present in the regional mortality variation across NUTS 2 and NUTS 3 regions between the observed and hypothetical situation.
4. Sensitivity analysis
In the hypothetical scenario, we disregard changes in the place of residence in the three years before death for those dying during the observation period 2002-2006. We chose a 3-year period before death because of our aim to include all health-related moves and because of the different timing of moves among survivors and those who died. Among those who died, more moves took place more recently, i.e. closer to the last observation, than among survivors. As mentioned before, considering the moves that took place in a 5-year period before the last observation, 74% of all moves made among those who died and only 69% of all moves made among survivors took place within three years before the last observation. A sensitivity analysis with a migration threshold of one year before death—a value often referred to in view of declining health in the life course as health care costs increase sharply in the last year of life (Polder et al. 2006)—was undertaken. Moves of those who survived until the end of 2006, the end of our study period, but died in 2007, were again considered as moves among survivors. The results of this sensitivity analysis show smaller migration intensities and smaller differences between mortality rates in the observed situation and the hypothetical scenario. In the sensitivity analysis, the regional mortality pattern, showing significant mortality differences from the Dutch average, showed fewer differences between the observed situation and the hypothetical scenario, compared to the main analysis. When comparing the observed and hypothetical mortality rates in the sensitivity analysis, no statistically significant differences were observed between them. However, mortality variation across the municipalities in the hypothetical scenario still decreased significantly, compared to the conventional calculation of mortality rates, and thus leads to the same conclusions as in the main analysis.
5. Explanations of the observed results
5.1 Selective migration and health
These individual and household characteristics are interrelated and can, for a large part, be related to an adaptation of residence once the elderly come to live alone. This might either be a move to a smaller flat when the partner passes away, or a move to nursing care institutions or to their family because of the need for care (Bloem et al. 2008; Grundy 2011; Litwak and Longino 1987; Uren and Goldring 2007; Wilmoth 2010).
5.2 Distortion explained by the regional distribution of nursing care institutions
We observed a possible distortion of old-age mortality patterns across the municipalities, as indicated by significant mortality differences from the Dutch average. Apart from personal characteristics, this seems to be related to the availability and spatial distribution of care institutions, which can influence the direction of migration flows at older ages (Gandarillas et al. 2011; Harrop and Grundy 1991). Moves to nursing care play a major role at old age when health deteriorates (Bloem et al. 2008; Grundy 2011; Uren and Goldring 2007; Wilmoth 2010) and it has been shown for very small area units, that the unequal distribution of nursing care institutions can indeed confound the mortality level (Gandarillas et al. 2011 on 3906 census tracts in the Madrid region, Spain; Jonker et al. 2013 on neighbourhoods in the census metropolitan agglomeration of Amsterdam, the Netherlands; Veugelers and Hornibrook 2002 on 64 entities in the Halifax area, Canada; Williams et al., 2004, on 155 electoral wards in West Sussex, England).
In the Netherlands, a considerable share of the population aged 80 years and above (11% of men and 20% of women) resides in nursing care institutions (Statistics Netherlands, Statline 2012), where mortality is higher than among the non-institutionalized population (Grundy 2011; Jonker et al. 2013; Shah et al. 2013; Veugelers and Hornibrook 2002; Williams et al. 2004). Of all deaths of those aged 80 and above, 23% of all men and 53% of all women passed away in an institutional household. Nursing care institutions are, however, unequally distributed in the Netherlands, especially across municipalities(Deuning 2009).
smaller than the observed SDR if the number of beds in a municipality is very high, reflecting elevated observed mortality as people move into nursing homes of the municipality in the last days of their life. Mortality risk factors are thus in fact more equally distributed than the observed SDRs imply. In combination with the knowledge that the availability of institutionalized nursing care is not equally distributed across the municipalities, this confirms our findings that regional mortality is more equally distributed if migration prior to death is disregarded.
5.3 Importance of regional level and migration intensity
We showed the possible distortion of regional old-age mortality due to late-life migration at different regional levels. A significant distortion of regional mortality patterns was apparent at the municipality level. At NUTS 3 and NUTS 2 levels, only few differences showed, which proved to be not statistically significant.
Two factors are likely to play a key role here. First, the availability of nursing care is more equally distributed at the more aggregate NUTS 3 and NUTS 2 levels as compared to the municipality level. Accordingly, the proportion of deceased aged 80 and older who have resided in an institutional household greatly varies across the municipalities (IQR men 17-28%, women 36-61%), but less so across NUTS 3 regions (IQR men 20-27%, women 48-58%), and with very little variation across provinces.
Secondly, the migration intensity is much lower at NUTS 3 and NUTS 2 levels, as compared to the migration intensity between the municipalities. Both factors combined do not seem to have the potential to significantly distort regional old-age mortality at the more aggregate levels.
Comparing observed and hypothetical old-age mortality levels and patterns therein, greater differences are found for women than men. The generally higher migration intensity of women might explain why more differences were found among women than among men.
6. Final conclusion and implications
point in the same direction for neighborhood mortality variation within Amsterdam. It appears that at municipality level, mortality risk factors are in fact more equally distributed than the observed mortality rates imply.
It should be noted that implications from this study are only applicable to other settings in which late-life migration is considered. This is because such migration is largely health-induced (Bloem et al. 2008; Uren and Goldring 2007; Wilmoth 2010). Considering migration at younger ages would loosen the link to health decline and moving to care institutions, and would therefore most likely result in fewer differences between the observed and the hypothetical situation. For other countries, it is possible as well that health-related migration at old age may produce distortion of mortality levels and differences therein. The level of distortion will, however, be affected by the level of area aggregation, the associated level of migration intensity, and the regional distribution of nursing care homes. Other important factors are the potential role of nursing care or the family, as well as societal, medical and technical advances that enable prolonged independent living.
A possible distortion that migration may exert on regional old-age mortality differences is very likely to show its influence on regional differences in more general measures related to the health situation of a country, such as the life expectancy at birth and mortality irrespective of age. For example, under the mortality conditions in the Netherlands in the study period, a mortality decrease (increase) by 10% at all ages above 80 would lead to a change in male life expectancy at birth of 0.23 (-0.20) years and in female life expectancy at birth of 0.35 (-0.30) years. A 10% mortality difference above age 80 naturally exerts a stronger effect on remaining life expectancy at age 65. Life expectancy at age 65 among men would change by 0.27 (-0.24) years and among women by 0.39 (-0.34) years. Note that a fifth of the municipalities experienced a change of at least ±10% in male mortality and a quarter of the municipalities in female mortality.
References
Bentham, G. (1988). Migration and morbidity: Implications for geographical studies of disease. Social Science & Medicine 26(1): 49-54. doi:10.1016/0277-9536(88) 90044-5.
Bloem, B., van Tilburg, T., and Thomése, F. (2008). Residential mobility in older Dutch adults: Influence of later life events. International Journal of Ageing and Later Life 1(3): 21-44. doi:10.3384/ijal.1652-8670.083121.
Boyle, P. (2004). Population geography: Migration and inequalities in mortality and morbidity. Progress in Human Geography 28(6): 767-776. doi:10.1191/ 0309132504ph518pr.
Boyle, P., Norman, P., and Rees, P. (2002). Does migration exaggerate the relationship between deprivation and limiting long-term illness? A Scottish analysis. Social Science & Medicine 55(1): 21-31. doi:10.1016/S0277-9536(01)00217-9.
Brimblecombe, N., Dorling, D., and Shaw, M. (2000). Migration and geographical inequalities in health in Britain. Social Science & Medicine 50(6): 861-878. doi:10.1016/S0277-9536(99)00371-8.
Caselli, G. and Lipsi, R.M. (2006). Survival differences among the oldest old in Sardinia: Who, what, where, and why? Demographic Research 14(13): 267-294. doi:10.4054/DemRes.2006.14.13.
Connolly, S., O'Reilly, D., and Rosato, M. (2007). Increasing inequalities in health: Is it an artefact caused by the selective movement of people? Social Science & Medicine 64(10): 2008-2015. doi:10.1016/j.socscimed.2007.02.021.
Deuning, C.M. (2009). Nursing care institutions by municipality, 2009 [Verpleeg- en verzorgingshuizen per gemeente 2009; electronic resource]. In: Dutch National Public Health Atlas. Bilthoven: RIVM, zorgatlas.nl, Zorgatlas\Zorg\Langdurige zorg\Verpleging en verzorging.
Deuning, C.M. and den Hertog F.R.J. (2012). Life expectancy for men and women by municipality [Levensverwachting mannen/vrouwen bij geboorte per gemeente; electronic resource]. In: Dutch National Public Health Atlas. Bilthoven: RIVM, zorgatlas.nl, Zorgatlas\Gezondheid en ziekte\(Gezonde) levensverwachting.
Eurostat (2007). Regions in the European Union. Nomenclature of territorial units for statistics, NUTS 2006/EU-27. Office for Official Publications of the European Communities.
Eurostat (2009). Health statistics-Atlas on mortality in the European Union. Office for Official Publications of the European Communities.
Ezzati, M., Friedman, A.B., Kulkarni, S.C., and Murray, C.J.L. (2008). The reversal of fortunes: Trends in county mortality and cross-county mortality disparities in the United States. PLoS Medicine 5(4): e66. doi:10.1371/journal.pmed.0050066. Fokkema, T. and van Wissen, L. (1994). Verhuizen om verzorgd te worden:
ouderenmigratie en het aanbod van voorzieningen [Moving to be taken care of: migration among the elderly and the availability of institutions]. Demos 10(1): 5-8.
Gandarillas, A., Domínguez-Berjón, M.F., Zorrilla, B., Galán, I., Duque, I., and del Pozo, J.S. (2011). Deaths in collective dwellings and inequalities in small-area mortality: An ecological study in the Madrid region (Spain). Journal of Epidemiology and Community Health 65(4): 310-314. doi:10.1136/jech. 2009.094847.
Grundy, E. (2011). Household transitions and subsequent mortality among older people in England and Wales: Trends over three decades. Journal of Epidemiology and Community Health 65(4): 353-359. doi:10.1136/jech.2009.089383.
Harrop, A. and Grundy, E.M.D. (1991). Geographic variations in moves into institutions among the Elderly in England and Wales. Urban Studies 28(1): 65-86. doi:10.1080/00420989120080051.
Human Mortality Database (2012). Human Mortality Database [electronic resource]. University of California, Berkeley (USA), and Max Planck Institute for Demographic Research (Germany). [www.mortality.org].
Jongeneel-Grimen, B., Droomers, M., Stronks, K., and Kunst, A.E. (2011). Migration does not enlarge inequalities in health between rich and poor neighbourhoods in The Netherlands. Health & Place 17(4): 988-995. doi:10.1016/j.health place.2011.03.008.
Litwak, E. and Longino, C.F. (1987). Migration patterns among the Elderly: A developmental perspective. The Gerontologist 27(3): 266-272. doi:10.1093/ geront/27.3.266.
Luy, M. (2006). Differential mortality: The unequal distribution of life expectancy in Germany [Differentielle Sterblichkeit: Die ungleiche Verteilung der Lebenserwartung in Deutschland]. Rostock: Rostock Centre for the Study of Demographic Change (Rostocker Zentrum Diskussionspapier 6).
Norman, P., Boyle, P., and Rees, P. (2005). Selective migration, health and deprivation: A longitudinal analysis. Social Science & Medicine 60(12): 2755-2771. doi:10.1016/j.socscimed.2004.11.008.
Polder, J.J., Barendregt, J.J., and van Oers, H. (2006). Health care costs in the last year of life—The Dutch experience. Social Science & Medicine 63(7): 1720-1731. doi:10.1016/j.socscimed.2006.04.018.
Prins, C.J.M. (2000). Dutch population statistics based on population register data.
Maandstatistiek van de bevolking 48(2): 9-15.
Rees, P., van Imhoff, E., Durham, H., Kupiszewski, M., and Smith, D. (1998). Internal Migration and Regional Population Dynamics in Europe: Netherlands Case Study. Council of Europe (Directorate of Social and Economic Affairs, Population and Migration Division) and European Commission (Directorate General V, Employment, Industrial Relations and Social Affairs, Unit E1, Analysis and Research on the Social Situation) (Working Paper 98/06).
Sergeant, J.F., Ekerdt, D.J., and Chapin, R. (2008). Measurement of late-life Residential relocation: Why are rates for such a manifest event so varied? The Journals of Gerontology: Series B 63(2): S92-S98. doi:10.1093/geronb/63.2.S92.
Shah, S.M., Carey, I.M., Harris, T., DeWilde, S., and Cook, D.G. (2013). Mortality in older care home residents in England and Wales. Age and Ageing 42(2): 209-215. doi:10.1093/ageing/afs174.
Statistics Netherlands (2008). Maps of regional divisions in the Netherlands, 2008 [Kaarten regionale indeling 2008] [electronic resource]. [cbs.nl/nl-NL/menu/themas/dossiers/nederland-regionaal/publicaties/publicaties/archief/ 2008/2008-regionale-kaarten-pub.html].
Strohmeier, K.P., Schultz, A., Bardehle, D., Annuss, R., and Lenz, A. (2007). Health indicator-based cluster analysis of districts and urban districts in North Rhine-Westphalia [Sozialräumliche Clusteranalyse der Kreise und kreisfreien Städte und Gesundheitsindikatoren in NRW]. Das Gesundheitswesen 69(1): 26-33. Uren, Z. and Goldring, S. (2007). Migration trends at older ages in England and Wales.
Population Trends 130: 31-40.
Verheij, R.A., van de Mheen, H.D., de Bakker, D.H., Groenewegen, P.P., and Mackenbach, J.P. (1998). Urban-rural variations in health in the Netherlands: Does selective migration play a part? Journal of Epidemiology and Community Health 52(8): 487-493. doi:10.1136/jech.52.8.487.
Veugelers, P.J. and Hornibrook, S. (2002). Small area comparisons of health: Applications for policy makers and challenges for researchers. Chronic Diseases in Canada 23(3): 100-110.
Williams, E.S., Dinsdale, H., Eayres, D., and Tahzib, F. (2004). Impact of nursing home deaths on life expectancy calculations in small areas. Journal of Epidemiology and Community Health 58(11): 958-962. doi:10.1136/jech. 2003.017608.
Appendices
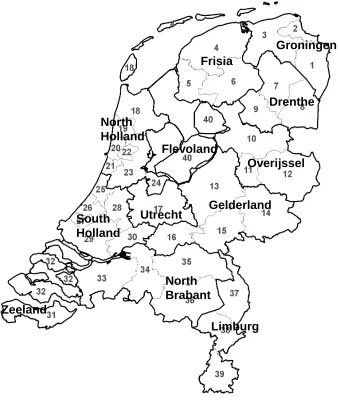
Figure A.1: Map of NUTS 2 regions (provinces) and NUTS 3 regions in the Netherlands
South
Holland
Zeeland
North
Brabant
Limburg
Overijssel
Gelderland
Frisia
North
Holland
Groningen
Drenthe
Flevoland
Figure A.1: (Continued)
1 Eastern Groningen 15 Arnhem and Nijmegen 29 Great Rijnmond
2 Delfzijl and surroundings 16 South-western Gelderland 30 South-eastern South
Holland
3 Remaining Groningen 17 Utrecht 31 Zeeuwsch-Vlaanderen
4 Northern Frisia 18 Upper north North Holland 32 Remaining Zeeland
5 South-western Frisia 19 Alkmaar and surroundings 33 Western North Brabant
6 South-eastern Frisia 20 IJmond 34 Mid North Brabant
7 Northern Drenthe 21 Agglomeration Haarlem 35 North-eastern North
Brabant
8 South-eastern Drenthe 22 Zaanstreek 36 South-eastern North
Brabant
9 South-western Drenthe 23 Great Amsterdam 37 Northern Limburg
10 Northern Overijssel 24 The Gooi and Vechtstreek 38 Mid Limburg
11 South-western Overijssel 25 Agglomeration Leiden and
Bollenstreek
39 Southern Limburg
12 Twente 26 Agglomeration The Hague 40 Flevoland
13 Veluwe 27 Delft and Westland
14 Achterhoek 28 Eastern South Holland