DEMOGRAPHIC RESEARCH
VOLUME 32, ARTICLE 23, PAGES 691
722
PUBLISHED 6 MARCH 2015
http://www.demographic-research.org/Volumes/Vol32/23/ DOI: 10.4054/DemRes.2015.32.23
Research Article
On the age-specific correlation between fertility
and female employment: Heterogeneity over
space and time in OECD countries
Uta Brehm
Henriette Engelhardt
©2015 Uta Brehm & Henriette Engelhardt.
This open-access work is published under the terms of the Creative Commons Attribution NonCommercial License 2.0 Germany, which permits use, reproduction & distribution in any medium for non-commercial purposes, provided the original author(s) and source are given credit.
1 Introduction 692
2 Analytical framework 694
2.1 Age-specificity 694
2.2 Heterogeneity in space and time 696
2.3 Heterogeneous age-specificity 697
3 Data and methods 698
3.1 Data 698
3.2 Methods 699
4 Results 701
4.1 Descriptive results 701
4.2 Multivariate results 704
5 Discussion 708
References 712
On the age-specific correlation between fertility and female
employment: Heterogeneity over space and time in OECD countries
Uta Brehm1
Henriette Engelhardt2
Abstract
BACKGROUND
Though there has been profound research on the curious change in correlation between total fertility rate (TFR) and female labor force participation (FLP) in the mid-1980s, aspects of the compositional character of age-specific effects and the nature of countries’ heterogeneity have been neglected.
OBJECTIVE
The present paper aims to contribute to filling this gap by analyzing annual total fertility rates and their equivalents for four age groups between 20 and 39 years as well as the respective lagged FLP from 17 OECD countries between 1985 and 2010.
METHODS
Random Intercept and Random Coefficient Models are applied, allowing us to assess both effects and country heterogeneity in slopes and intercepts.
RESULTS
The analyses reveal that the development of the correlation between FLP and TFR after 1985 is comprised of very different relations between age-specific fertility and labor participation. The youngest group’s situation is determined by a decrease in both fertility and FLP, while countries’ effects differ increasingly. The oldest women’s fertility decisions seem to be detached from labor market influences, though country variation is high. Women in their late 20s and early 30s, in contrast, appear to be most affected by the incompatibility of childbearing and gainful employment. Though these effects seem to have overcome their low points during the mid-1990s, only women in their early 30s show country-convergence.
1 Bamberg Graduate School of Social Sciences (BAGSS), University of Bamberg, Feldkirchenstraße 21, 96052 Bamberg, Germany. E-Mail: [email protected].
CONCLUSION
The results highlight the fact that total and age-specific fertility behavior, FLP-effects and country variances are distinct concepts that add considerably to the broad understanding of the correlation between fertility and FLP.
1. Introduction
In studying the correlation between fertility and female labor force participation, a common hypothesis states that women with small children face, to some extent, an incompatibility with engaging in gainful employment. As a result, women are supposed to choose between the two alternatives, which is expected to result in a negative correlation between the total fertility rate (TFR) and female labor force participation (FLP), empirically. Up to the mid-1980s, this assumption is supported by data for OECD member states. Since then, research has registered a positive correlation as is shown in Figure 1.
Figure 1: Correlations between total fertility rate and female labor force participation between 1960 and 2010
Data: see Appendix.
-.6
0
.6
correlatio
n
1960 1970 1980 1990 2000 2010
Countries: Belgium, Canada, Denmark, Finland, France, Germany, Greece, Ireland, Italy, Japan, Luxembourg, Norway, Portugal, Spain, Sweden, United Kingdom, United States
While previous research has been focusing on underlying factors, such as social and labor market policies as well as changes in values and attitudes (e.g., Pampel 2001; Ahn and Mira 2002; Adserà 2004; Laat and Sevilla Sanz 2005; Engelhardt 2009; Luci and Thévenon 2010) some crucial aspects remain almost unconsidered. First, one can assume compositional effects in the total rates that are specifically due to age-specific differences. More precisely, the interplay of fertility and employment in different age groups has been influenced by various factors, all of which have undergone long-term changes themselves. These factors include, for example, the increasing enrollment in higher education, women’s growing orientation towards both labor market and individual careers, as well as changing gender roles and family norms. These well-researched developments provide a theoretical basis for this study’s assumption of empirically very different relationships between age-specific fertility and the respective FLPs.
Second, countries can be expected to vary clearly in their association between fertility and employment, as they follow very different policies, guiding motives and mentalities. These lead to highly variant country situations, both in cross-section as well as concerning long-term developments. Hence, very complex country heterogeneity may conceal the true nature of the association between FLP and TFR – an issue that, however, has so far been acknowledged rather insufficiently in previous research (e.g., Beck and Katz 2007).
The aim of this paper is to address both of the described aspects. Specifically, it scrutinizes if and how the puzzling relationship between TFR and FLP is attributable to a composition of varying age-specific associations between fertility rates and FLP. Furthermore, the paper contemplates on the complex nature of underlying country heterogeneity. To do so, it goes beyond merely controlling for varying country-specific intercepts and slopes while estimating the association between total and age-specific fertility and the respective FLPs. In fact, it aims to additionally pinpoint the specific scope of country heterogeneity and its long-term development.
2. Analytical framework
From a theoretical point of view, the difficulties in combining gainful employment and childbearing urge women to choose between these alternatives. Consequently, this decision should result in a negative correlation between fertility and female labor participation (Becker 1960, 1991; Mincer 1963; Willis 1973; Butz and Ward 1979). Empirical evidence, however, suggests a change in OECD countries’ correlation between TFR and FLP from negative to positive values in the mid-1980s (e.g., Esping-Andersen 1999; Brewster and Rindfuss 2000; Pampel 2001; Ahn and Mira 2002; Rindfuss, Guzzo, and Morgan 2003; Engelhardt, Kögel, and Prskawetz 2004). Recent studies concentrate on finding reasons for this change in correlation, mainly based on pooled time series from OECD countries. Particularly, elements of family policy are considered to be relevant. Several authors attribute capital importance to childcare institutions (Ahn and Mira 2002; Engelhardt 2009; Luci and Thévenon 2010) and, to a lesser degree, to maternity benefits and part-time employment (Adserà 2004; Engelhardt 2009). Besides, the changes of attitudes and gender roles towards individualism and equality are considered to be similarly relevant (de Laat and Sevilla Sanz 2007; Pampel 2001; Castles 2003; Engelhardt 2009; Luci and Thévenon 2010; Luci 2011). Beyond that, however, research has left a gap in the study of the causal association between fertility and FLP. While it has focused on finding reasons for the overall relation, crucial aspects, such as the correlation’s composition of age-specific associations, as well as the complex nature of underlying country heterogeneity have often only been acknowledged superficially or neglected altogether.
2.1 Age-specificity
The described periods are connected to a certain age – a relation, however, that has changed clearly over the last decades. As a result of an interplay between the educational expansion and more accurate and extended predictions regarding future working lives (Goldin 2006), women prolonged their periods of education, viz. by more than five years across the OECD between 1970 and 2009, and almost two and a half years since 1990 (Gakidou et al. 2010). Subsequent to graduation, women enter the labor market increasingly with the intention of pursuing occupational success (Goldin 2006). Both aspects contribute to postponing the period of childcare: over the last decades, family formation has been delayed by three to four years (e.g., Sobotka 2008). Drawing upon these considerations, we hypothesize a decrease of both fertility rates and FLP in younger age groups up to the mid-20s, and hence a positive association. In the mid- to late 20s, in contrast, we assume a negative association, since fertility makes way for increasing FLP. Throughout the 30s, we expect increasing figures for both rates, reflecting in their competition and hence in a negative association. Altogether, we assume the rise into a positive correlation between TFR and FLP to be due to a compositional effect of greatly varying correlations at different ages. Figure 2, illustrating the crude correlation between age-specific fertility rates and FLP, conveys a first impression of the variety of associations. Curiously, the correlations for the age groups 25 to 29 and 30 to 34 do not meet our hypotheses of negative associations. While puzzling at first, this might be an indication of the great relevance of underlying country heterogeneity.
Figure 2: Age-specific correlations between fertility and female labor force participation between 1985 and 2010
Data: see appendix
-.6
0
.6
c
or
rel
at
ion
1985 1990 1995 2000 2005 2010
20-24 25-29
age 20 to 29
-.6
0
.6
1985 1990 1995 2000 2005 2010
30-34 35-39
age 30 to 39
2.2 Heterogeneity in space and time
Some authors direct an additional focus on country- and time-specific heterogeneity, arguing that due to a disregard of these aspects, the observed change in correlation is perhaps questionable altogether (Kögel 2004; Engelhardt, Kögel, and Prskawetz 2004). There have been different approaches to coping with countries’ heterogeneity: Ahn and Mira (2002), for example, divide countries into three groups according to their FLP, unveiling their differences in the association with the respective TFR: while countries with low FLP also proceeded from formerly very high (2.75 in 1970) to very low levels of fertility (1.5 in 1995), high-participation countries’ fertility rates only experienced a comparatively slight drop (from 2.2 in 1970 to 1.75 in 1977) and slightly increased again during the late-1980s. These contradicting trends may have contributed to the observed change in correlation. In a slightly different line of thought, Rindfuss, Guzzo, and Morgan (2004) control for each country’s sensitivity of fertility to changes in FLP – this however apparently without allowing for variances across time – and derive institutionally different groups of countries: while the TFR in Scandinavia and the former British colonies is fairly insensitive to changes in the FLP, the opposite applies to Southern European countries. The authors argue that the changing cross-sectional correlation of TFR and FLP can also be explained by these differences. Going one step further, Kögel (2004) controls for unmeasured country-specific factors as well as for slope-heterogeneity across European regions (i.e. Scandinavian, Mediterranean and other countries) in fixed and random effects estimations. While other researchers uphold the positive cross-country correlation after 1985, he argues these findings have been due to the neglect of these aspects of country heterogeneity. In his empirical analysis, Kögel finds evidence for a persistently negative, though only marginally significant, correlation between TFR and FLP. He detects this to be particularly true for the Mediterranean countries while effects in other regional groups are insignificant. Implementing the idea of unobserved variation differently, Engelhardt (2009) chooses to control for unobserved country-specific as well as time-specific heterogeneity by incorporating respective fixed effects into one model. Simultaneously, her model attempts to accommodate restrictions of temporally and spatially correlated errors in pooled time series. Following this method, she finds support for the positive bivariate correlation between FLP and TFR after 1985.
2.3 Heterogeneous age-specificity
Due to different cultural, political and economic structures, both total and age-specific developments do not only differ across time, but also between countries. Different rates and intensities of development reflect this suggestion: the expansion of (higher) education varies clearly across countries (e.g., Schofer and Meyer 2005), the impact on females’ school attendance ranging between 2.7 (USA) and 7.5 (Netherlands) additional years in 2009 compared to 1970 (Gakidou et al. 2010). The FLP also grew at different speeds and from different starting points in various countries: Sweden, for example, featured a rate around 55% in the early 1960s, with an increase of about 25 points in the 1970s and early 1980s. Since then, the rate holds steady at almost 80%. Spain’s FLP, in contrast, was still at about 35% in the late 1970s, with steadily growing values in the last decades, up to about 65% in 2010 (Appendix 1). Concerning family formation, in 1983 Finland was one of the first countries to show a postponement of two years compared to the formerly stable mean age at first birth – one of the last OECD countries was Portugal in 1997 (Sobotka 2008). Still, the median ages at first birth differ clearly: van Bavel and Nitsche (2013) cite differences of up to four years across Europe’s Western countries alone (Portugal: 26 years – Netherlands, Spain, Switzerland: 30 years).
The differing compatibility of the described age-specific periods of education, gainful employment, and childcare across countries results in varying patterns of subsequence or concurrence of periods, and therefore in different age-specific associations between fertility and FLP. To explain the differing compatibility, consideration of conditions at the societal level is requisite. To this end, Laat and Sevilla Sanz (2005) put forward a model on norms and attitudes regarding gender equality, concluding that social externality effects and their interaction with household attitudes lead to the change in the cross-country correlation between TFR and FLP: while traditional labor division is conductive to a higher number of children on the micro-level, on the macro-level more egalitarian values lead to an on average higher male share of home production which allows fertility, a function of the sum of time devoted to household services, to increase. The related attitudes, social norms, and culture, however, differ substantially across countries, constituting long-term differences that have only been uncovered by rather short-term increases of the FLP.
prompting women to reduce and postpone births. As soon as family-oriented institutions catch up on gender equality, fertility can be expected to recover.
Interdependently, a complex of political and economic institutions determines opportunities and costs of childbearing and -rearing relative to gainful employment. Particularly relevant in this respect are child daycare and/or women’s part-time employment. The occurrence of such institutions can be assumed to depend on a country’s overall regime: while some liberal countries rely almost solely on the market’s ability to facilitate the compatibility of family and career, others consider the state to be responsible for the provision of childcare. Still others have traditionally relied on subsidiarity, and therefore on families to take care of their children (Esping-Andersen 1990), resulting in a fairly consecutive order of employment and childcare. A clustering along these ascribed and observed lines, however, is only partly expedient, as variation is high even within these groups3.
Instead, this paper aims to pay due regard to countries’ factual variation without drawing on grouping assumptions. Specifically, we orient our research towards Kögel’s approach, which estimated fixed and random effects in order to control for unmeasured country-specific factors and slope-heterogeneity, respectively (cf. page 697). However, we aim at going one step further by applying a method that integrates both aspects, i.e. heterogeneous intercepts as well as slopes, into one comprehensive model. This allows us to pursue our first objective of estimating the correlation between total and age-specific fertility and FLP, while simultaneously controlling for and precisely predicting various forms of country heterogeneity, as suggested by our second objective.
In order to satisfy our research purposes, we apply Random Coefficient Modeling as suggested by Beck and Katz (2007) to a sample of 17 OECD countries, both of which are elaborated upon in the following section.
3. Data and methods
3.1 Data
For the empirical analysis, we assembled annual time series of both total and age-specific fertility rates and female labor force participation rates for OECD member states. Data was drawn from data banks provided by the OECD (OECD.Stat Extracts), World Bank (World Development Indicators), European Commission (Eurostat), and
the Max Planck Institute for Demographic Research (Human Fertility Database) (see Appendix). As studies do not differ with respect to the negative correlations prior to the mid-1980s, we focus on the much-disputed time after 1985. This procedure ties in with Kögel’s (2004) strategy of considering the time periods before and after 1985 separately. Also, as the collection of age-specific data is a rather new concept, this premise enables us to include data from as much as 17 OECD member states widely scattered over Europe (Belgium, Denmark, Finland, France, Germany, Greece, Ireland, Italy, Luxembourg, Norway, Portugal, Spain, Sweden, United Kingdom), North America (Canada, USA) and Asia (Japan).
Providing an overview, Appendix 1 displays each country’s total and age-specific fertility and FLP behavior from 1960 until 2010. We assume women’s main childbearing age to fall between 20 and 39 years, which is why we focus on age groups of between 20 and 24, 25 and 29, 30 and 34 as well as 35 and 39 years. While the TFR is calculated by summing the single-year age-specific figures, the fertility of aggregated age groups is provided mainly in the form of averages from the corresponding age-specific rates. As a result, the values’ ranges differ quite substantially, with TFR-values between approximately 1.1 and 4.3, and age group-specific rates between 0.01 and 0.26 (below serving as proxies for age-specific fertility rates). While this does not affect the relative impression of the age-group fertility description in Appendix 1, readers must be aware that in the following multivariate analyses, these small rates result in even smaller slope coefficients which are, however, not negligible.
3.2 Methods
To pay regard to the causal order of fertility decisions, the bivariate causal analyses are carried out with lagged variables for FLP. This is based on the assumption that individual-level decisions for or against childbearing are made approximately one year prior to measurable events such as births and, consequently, to macro-level fertility. At the time of decision-making, current economic issues, like the FLP, are taken into account (e.g., Örsal and Goldstein 2010). The relevance of this theoretical premise mirrors in the finding that, in a minimum of two lags, the unadjusted total as well as age-specific FLPs Granger-cause the respective fertility rates. This, however, does not apply in the opposite direction. This finding from time series between 1985 and 2010 contradicts Michael’s (1985) results using data from 1950 to 1980, who reports the age-specific fertility rates to Granger-cause (married women’s total) FLP.
This method enables us to model the variation of the effect of total and age-specific female labor force participation on the respective fertility rates while, at the same time, allowing for heterogeneous country intercepts and slopes. In their Monte Carlo experiments, Beck and Katz highlight the superiority of the maximum likelihood RCM estimator to those with pooled data, even if the latter allow for fixed country effects and hence intercept heterogeneity.
To present the model’s general idea, we follow Beck and Katz’ depiction and assume standard time-series cross-section data with 𝑥𝑖𝑡 being the vector of 𝐾 independent variables for unit 𝑖 and period 𝑡. To work out the issue of parameter heterogeneity, we assume serially independent and normally distributed errors 𝜀𝑖𝑡 with zero mean and constant variance. By allowing 𝛽𝑖 to take on a variety of patterns, we get to the equation
𝑦𝑖𝑡= 𝑥𝑖𝑡𝛽𝑖+ 𝜀𝑖𝑡 𝑖 = 1, … , 𝑁; 𝑡 = 1, … , 𝑇. (1)
However, the RCM assumes the 𝛽𝑖 to be related and hence adds the assumption of
𝛽𝑖= 𝛽 + 𝑢𝑖 (2)
with
𝑢 ~ 𝑁(0, 𝛤). (3)
In this, 𝛤 reflects a matrix of variance and covariance terms and hence the heterogeneity of the unit parameters. As a result, the full model with its complex error term (in braces) reads
𝑦𝑖𝑡 = 𝑥𝑖𝑡𝛽 + {𝑥𝑖𝑡𝑢𝑖+ 𝜀𝑖𝑡}. (4)
countries. Resulting in an overall equation that sets the foundation for a gradual empirical compilation, the model reads as follows:
𝐹𝑅𝑖𝑡= 𝛽0+ 𝑣𝑡+ 𝛽1𝐹𝐿𝑃𝑖𝑡−1+ 𝛽2𝐹𝐿𝑃𝑖𝑡−1× 𝑣𝑡+ 𝑢0𝑖+ 𝑢1𝑖𝑌𝑖𝑡+ 𝜀𝑖𝑡. (5)
In order to deal with temporally and spatially correlated errors, the residuals’ nuisance is modeled as a first-order autoregression or AR(1) process (details in Engelhardt and Prskawetz 2005)
𝜀𝑖𝑡= 𝜌𝜀𝑖,𝑡−1+ 𝛾𝑖𝑡. (6)
Though tests for both contemporaneous correlations and residual heteroskedasticity have also been positive, we disregard these error structures in our models, as they do not alter the model's explanatory power. Specifically, contemporaneously correlating countries appears to be rather random,4 while estimations with due regard for residual heteroskedasticity do not modify results substantially.
4. Results
4.1 Descriptive results
The graphs in Figures 3 to 5 emphasize the relevance of considering both age-specificity and time as well as country heterogeneity by giving an overall impression of countries’ relational developments of fertility and FLP5. Regarding the respective total rates in Figure 3, the TFR ranged at a high level between 2.0 and 3.8 in 1960. This variation went down to 1.3 and 2.5 respectively until 1985, and has only slightly changed since (2010: 1.3 to 2.1). This suggests that most of the changes in fertility took place before 1985. Regarding the total FLP, in contrast, countries vary considerably in their pace of development: long established high-participation countries had already increased their rates by the late 1980s, moving at fairly constant high paces after that. In contrast, an increase of FLP in traditionally low-participation countries does not show until the mid-1980s, with signs of a further increase beyond the observation period. This is reflected in comparatively little country variation during both the 1960s and
4 For instance, Belgium’s errors correlate strongly with Japan’s – as do Luxembourg’s with Ireland’s. Rather obvious contemporaneous correlations, in contrast, like those between Norway and Sweden or Italy and any of the other Mediterranean countries, do not prove to be nearly as strong, if existent at all.
2000s, though at considerably different levels, and a very wide variation during the decades in between.
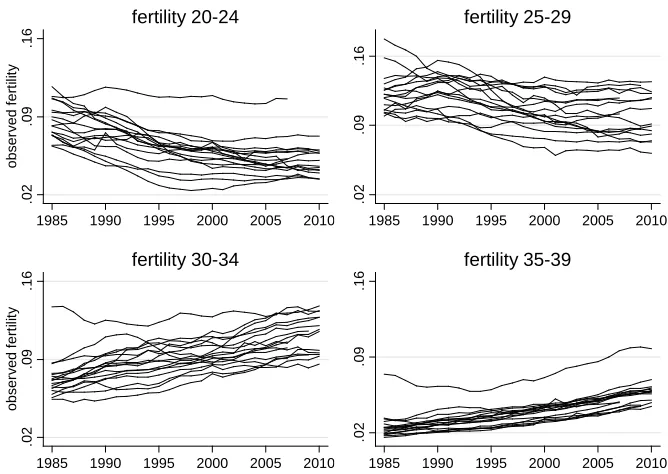
In age-specific terms, however, the picture looks very different, as Figures 4 and 5 suggest for the decades after 1985. The youngest age group does not only show a strong decrease in fertility but also a slighter one in FLP. In the next oldest group, fertility decreases similarly while the countries’ FLPs converge to a fairly high level. In the two oldest age groups, in contrast, both levels of fertility and FLP show, on average, increases. The development of the latter, however, is driven by a considerable amount of convergence, with many low-participation countries almost catching up on a level others have been holding for the entire observation period.
Figure 3: The development of total fertility rate and total female labor force participation rate between 1960 and 2010
Data: see appendix
Overall, Figure 4 shows that fertility in the late 1980s ranges highest for the age group between 25 and 29 years and by far lowest for women between 35 and 39 – with Ireland as a very pronounced outlier. In 2010, in contrast, women between 30 and 34 exhibit the highest average fertility rates, closely followed by women between 25 and 29 – though rates are considerably lower than in the high-fertility group of the 1980s. At the same time, fertility rates in the youngest and the oldest age group have converged from initially different levels in the course of time. In sum, countries’ fertility rates appear to have harmonized across the observed age groups: while they differ greatly in 1985 with figures between 0.02 (age group 35 to 39 years) and 0.18 (25 to 29), their rates vary less and at lower levels in 2010, ranging between 0.03 (20 to 24) and 0.14 (30 to 34).
1
2
3
4
o
bs
er
v
ed
f
er
ti
li
ty
1960 1970 1980 1990 2000 2010 total fertility
30
60
90
o
bs
er
v
ed
F
LP
1960 1970 1980 1990 2000 2010 total FLP
Figure 4: The development of age-specific fertility rates between 1985 and 2010
Data: see appendix
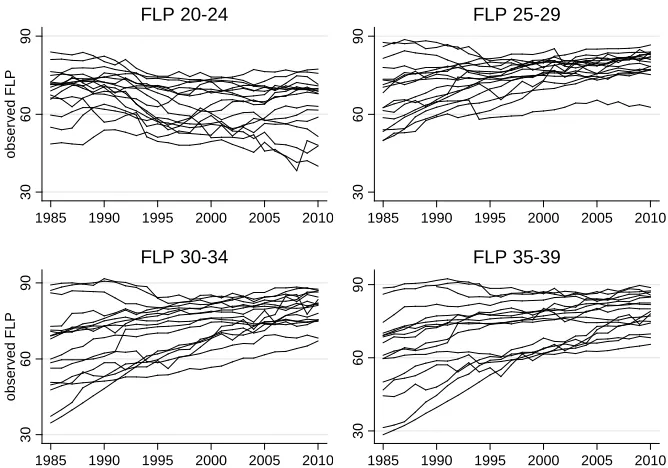
Regarding the FLP, Figure 5 demonstrates that countries vary considerably across all age groups in 1985, with wider variation for older women (a range from approximately 30% to 90% in age groups 30 to 34 and 35 to 39). Apart from the youngest women’s FLP, which continuously and even increasingly differs across countries at a decreasing average level (1985: range from 49% to 83%; 2010: 39% to 75%), this picture changes into one of remarkable convergence at very high levels across both countries and age groups until 2010 (range from 61% [25 to 29] to 90% [30 to 34, 35 to 39]). However, the development is composed of different paces of FLP-increase at different ages: the penetration of the labor market at higher rates even for low-participation countries started earlier – seemingly even well before the observation period – for younger age groups.
.02
.09
.16
obs
er
v
ed f
er
ti
lit
y
1985 1990 1995 2000 2005 2010 fertility 20-24
.02
.09
.16
1985 1990 1995 2000 2005 2010 fertility 25-29
.02
.09
.16
obs
er
v
ed f
er
ti
lit
y
1985 1990 1995 2000 2005 2010 fertility 30-34
.02
.09
.16
1985 1990 1995 2000 2005 2010 fertility 35-39
Figure 5: The development of age-specific female labor force participation rates between 1985 and 2010
Data: see appendix
Similar to the emerging comparison of the bivariate correlations in Figures 1 and 2, these observations strongly point to a compositional effect of TFR and total FLP from different age group-specific conditions. Hence they suggest that it is shortsighted to refer only to total rates when studying the correlation of fertility and FLP. In addition to that, the figures convey an idea of country variability over the course of time, and imply that it is indeed worthwhile to minutely consider time-specific country heterogeneity.
4.2 Multivariate results
To extract the cross-country association between FLP and fertility, multivariate methods are applied. In order to find a model that does justice to each of the observed groups’ particular data basis, we make step-by-step estimations, gradually adding effect
30
60
90
obs
er
v
ed F
LP
1985 1990 1995 2000 2005 2010 FLP 20-24
30
60
90
1985 1990 1995 2000 2005 2010 FLP 25-29
30
60
90
obs
er
v
ed F
LP
1985 1990 1995 2000 2005 2010 FLP 30-34
30
60
90
1985 1990 1995 2000 2005 2010 FLP 35-39
terms to the model. While considering countries’ varying intercepts in fertility proves to be crucial for all observed groups, slopes show significant country variation for the total rate and the three youngest groups (though only marginally significant for women in their early 20s). Hence, further analysis has to account for country heterogeneity in both intercepts and slopes over the course of time. It is of course possible that further year-level explanatory variables lessen the extent to which countries vary. In any case, though, this has to be analyzed thoroughly. For women in their late 30s, in contrast, slopes do not differ between countries.
With regard to the effect of FLP on fertility rates, the relation proves to be rather complex. Surprisingly, the main effect does not help to explain either the total fertility rate or the fertility of women in their early 20s. In fact, in these cases the FLP does neither offer a significant fixed coefficient nor does it help to explain some of the countries’ heterogeneity. In the age groups between 25 and 39 years, in contrast, the FLP offers a significant though small main effect according to which a 10% increase in FLP accounts for a fertility decrease of between 1.8% (30 to 34 years) and 3.3% (35 to 39 years) and helps to explain between-country variance by up to 34.7% (25 to 29 years).
Despite these diverse main effects of FLP, the cross-level-interaction term of FLP and year6 contributes significantly to the model’s quality. This implies that the influence of FLP on fertility differs significantly by year. Testing for its country-specific effects, in contrast, does not improve the comprehension significantly for any of the groups. Evidently, the effect of FLP on fertility does not vary between countries. The final models of both the total and age-specific estimations are summarized in Appendix 2.
Based on these compiled models, Figure 6 illustrates within-country effects of FLP more specifically by describing its yearly effect on fertility in both total and age-specific terms. As a result of considering country heterogeneity in intercepts and slopes, the graphs differ clearly from the ones drawn on the basis of crude correlations, as seen in Figures 1 and 2. Nonetheless, it becomes apparent that the overall FLP’s effect on TFR since 1988 indeed ranges in a slightly positive area, yet with a distinct decrease to a null relationship around 2000. Age-specifically, however, the picture is much more diverse, and reveals compositional effects. While up to about 1990, the effect of FLP on fertility seems to develop quite steadily towards more positive figures for all age groups and the total rates respectively, the effects start to diverge in about 1992. Young women between 20 and 24 show a positive age-specific correlation between FLP and fertility in the 1990s. Yet women in their late 20s and early 30s already exhibit a repeated decline of correlation in the mid-1990s. For the rest of the observation period, this holds true
for women in their late 20s, although the situation improves temporarily during the early 2000s. Those in their early 30s, in contrast, even show a slight though not solid positive correlation in the mid- and late-2000s. The oldest women’s fertility, instead, proves to be fairly little influenced by FLP right from the start of the observation period, but even more so from the early 90s onwards.
Drawing inferences from these age-specific effects about the total effects, a positive correlation during the early 90s seems to be mainly contingent on the age group between 20 and 24, but declines steeply around 1995, when the effects of younger and intermediate age groups compensate. The increasingly positive effect in the late 2000s, again, seems to be determined by the youngest women, as well as those in their early 30s.
Figure 6: The effect of female labor force participation on fertility
Displayed values at p <.05, gaps smoothed. Data: see appendix
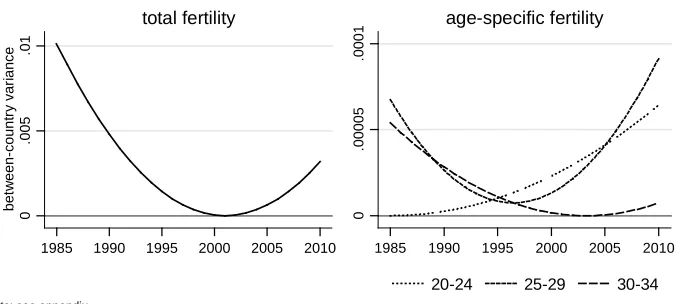
As we discussed earlier, however, these mean effects cannot be expected to convey the full extent of the association between the factors. Though the stated effects are thoroughly controlled for country- and time-specific variances, the variances themselves add valuably by giving an insight into country heterogeneity and its development across time. Figure 7 accentuates the change in the predicted fertility’s variation due to country differences as a function of year. Coinciding with the quickly changing mean effect of FLP from negative to positive and almost zero figures, countries’ predicted fertilities converge steadily until 2000 – the between-country variance declines to an OECD-wide harmonization. In the early years of the new millennium, though, along with the progressively positive effect of FLP on TFR,
-.
005
0
.005
ef
fec
t of
F
LP
1985 1990 1995 2000 2005 2010 total effects
-.
0005
0
.0005
1985 1990 1995 2000 2005 2010
20-24 25-29
30-34 35-39
age-specific effects
fertility’s variance is on the rise again: countries’ correlations develop at increasingly varying positive paces.
Figure 7: Between-country variance as a function of time
Data: see appendix
Figure 7 also illustrates the between-country variance in FLP- and year-based fertility age-specifically across time. Young women in their early 20s show an increasing variance, implying that countries increasingly differ in their participation-related fertility at that age: during times of positive FLP-effects on fertility, but especially when mean effects imply a zero impact, which suggests country-specifically varying effects into areas of both negative and positive correlations. The next group, consisting of women between 25 and 29 years of age, portrays a u-shaped between-country variance. Countries differ considerably in this age group’s participation-based fertility in the beginning and at the end of the observed period, even though they show a similar pattern in-between. More precisely, countries’ variance decreases to a minimum in 1996, while at the same time FLP’s mean effect hits the negative low point, and increases again until 2010, along with a slight shift into less negative areas of correlation. For women in their early 30s, in contrast, countries vary strongly in their correlation between fertility and FLP in 1985, but converge remarkably after that: variance decreases until the mid-2000s while FLP’s effect on fertility changes in rather negative areas and increases very slightly after that, partially into areas of positive effects. The oldest women’s slopes, as formerly implied, do not vary significantly across countries, but consistently move at a fairly high total level of variation while effects imply that FLP’s mean impact is consistently rather low. The high variation is
0
.005
.01
bet
w
een-c
ount
ry
v
ar
ianc
e
1985 1990 1995 2000 2005 2010
total fertility
0
.00005
.0001
1985 1990 1995 2000 2005 2010
20-24 25-29 30-34
age-specific fertility
particularly contingent upon one outlying country, Ireland, whose fertility is continuously much higher than that of any other country. An addition to the given total and age-specific picture is offered in Appendix 3, illustrating the relative Variance Partition Coefficient, which expresses the share of between-country variance in the total variance.
5. Discussion
Ever since researchers have observed a change in the correlation between fertility and female labor force participation (FLP), the issue itself, its nature and its influential factors have been a focus of the social sciences. Aspects of the compositional character of age-specific effects as well as the nature and scope of countries’ heterogeneity, however, have been neglected. The present paper aims to fill this gap by first scrutinizing if and how the relationship between TFR and FLP is composed of varying age-specific associations between fertility rates and FLP. Secondly, the paper demonstrates the complex nature of underlying country heterogeneity by both controlling for its relevance in the analyses of total and age-specific associations between fertility and FLP, as well as by identifying the specific scope of country heterogeneity and its long-term development.
Our study’s pursuit of these questions is based on annual total fertility rates and their equivalents for age groups between 20 and 39 years, as well as the respective lagged FLP from 17 OECD countries between 1985 and 2010. Random Intercept and Random Coefficient Models are applied, allowing us to assess both heterogeneous slopes and intercepts across countries. The estimations clearly show that total and age-specific fertility behavior, FLP-effects and country variances are very distinct concepts that all add to the broad understanding of the compositional character of the correlation between TFR and FLP and its multifaceted underlying country heterogeneity.
the effect of FLP on TFR. In summary, the picture appears to be rather complex and inconsistent, and calls for a detailed analysis for compositional effects.
Descriptive analyses show distinctly differing developments across age groups. Observed fertility rates of young women in their early 20s exhibit a decrease, particularly during the late 1980s and 1990, that goes along with a slight decrease of the FLP. Mirroring a positive mean effect of FLP on TFR, this development is in line with theoretical suppositions regarding the postponement of occupation and, even more so, fertility, as expanding periods of (higher) education concur with economic dependency and social norms of incompatibility. Beyond that, the timing of the decrease in FLP that partly drives the positive relation during the 1990s and late 2000s can be ascribed to periods of high youth unemployment that coincide with a continuing decrease in fertility, for similar economic and normative reasons. Simultaneously, between-country variance increases. Apparently, countries’ association between fertility and FLP starts to vary along with unemployment developments, by which countries are heterogeneously affected and to which they react heterogeneously. Obviously, these heterogeneities increase over time. This hinders the evaluation of OECD states within a single uniform classification, and makes any overarching statements practically impossible.
As expected, women in their late 20s similarly give evidence of decreasing fertility rates, though some countries show much steeper declines than others. These coincide with rising FLP, mirroring one another in consistently negative relations, though they show slight improvements during the early 1990s and the early 2000s. In line with our assumption of an almost exclusive occupational period right after a prolonged educational one, these developments imply that these women’s internal ideas and the external demands of life are particularly incompatible with and happen at the cost of fertility. This seems especially true during the second half of the 1990s, when countries jointly hit a low: the effect of FLP is at a negative mode while country variation is fairly small. Possibly, this development is supported by the emergence of lowest-low fertility in Europe that can mainly be traced back to a further postponement of births (cf. Kohler, Billari, and Ortega 2002) while, at the same time, the high youth unemployment rates exhibit some improvement, and animate women to increasingly strive towards the labor market. Before and after that period, in any case, analysis proves to be more complicated, as country variations are high. Countries reach the low point from very diverse and quickly-changing preceding situations, and also proceed to widely differing, though on average less incompatible, circumstances for fertility and FLP.
occupation-oriented periods at younger ages. Simultaneously, though, the FLP increases and converges over time, which is reflected in a decreasing estimated heterogeneity across countries. Much like the slightly younger age group, and congruent with our hypothesis, the age group displays a considerably negative association between FLP and fertility. Again, the greatest incompatibility is observed during the mid-1990s, when women can be supposed to surge to the again more promising labor market. After that, the effects develop towards a null or temporally even slightly positive correlation, which implies that the incompatibility between gainful employment and childbearing has been decreasing for women of this age group. This seems to be a particularly positive notion considering the concurrent convergence of countries.
As expected, the oldest observed women, between 35 and 39, also show increasing fertility rates. From the beginning of the observed period, however, these rates are less affected by the FLP and, thus, labor market arrangements. Inconsistent with our hypothesis, these women apparently can rely on their acquired experience and occupational status, their financial and psychological autonomy, as well as supporting partners, friends and relatives. Furthermore, countries develop homogeneously across time, while the high variation is mainly imposed by single deviants. Comparing this oldest group’s long-term development into apparent compatibility to the estimates for the women in their early 30s late 20s, one might assume a premonition of the future developments of younger age groups. Possibly, the negative relationship between fertility and FLP will be a thing of the past in some decades.
Altogether, the results on the age-specific associations highlight the importance of considering age-specificity when analyzing the correlation between fertility rates and FLP. By only focusing on the total rates TFR and FLP, students of this association commit themselves to the assumption of a somewhat unilinear relationships and developments across age groups. As the analyses have shown, this assertion is inapplicable, and disregards the association’s composition of sometimes greatly contradictory age-specific developments.
Beyond the actual scope of country heterogeneity, another striking aspect yielded by these results is the great relevance of controlling for it in analyses. Even a brief comparison of the crude correlations in Figure 2 and the profound association in Figure 6 accentuates the major bias caused by neglecting the various aspects of country heterogeneity. Controlling for country-specific variances in intercepts and slopes proves to be crucial to a meaningful analysis of the association between fertility and FLP.
control, the lack of data obtainability unfortunately puts an early end to one of the most pressing questions concerning a more long-term comparison of age-specific associations and compositional effects. Apart from that, it was not within the scope of this paper to control for further variables’ influence on fertility rates, though this would be of major interest for future research. To include the influencing factors of time and country heterogeneity, however, future research may want to deploy a different model, as this paper’s complex modeling would hardly tolerate additions. Alternatively, a very insightful approach would be to analyze the underlying mechanisms more minutely by using the example of a few particularly prominent countries.
Moreover, our consultation of female labor force participation rates did not allow us to accurately apportion the influence of the subjacent employment and, in contrast, unemployment rates on women’s childbearing. In order to understand these associations without drawing upon inferences, a systematic comparison of the effects of FLP as stated in this paper on the one hand, and the effects of actual employment rates on the other, would be yet another valuable starting point for future research.
References
Adserà, A. (2004). Changing Fertility Rates in Developed Countries. The Impact of Labor Market Institutions. Journal of Population Economics 17(1): 17–43.
doi:10.1007/s00148-003-0166-x.
Ahn, N. and Mira, P. (2002). A Note on the Changing Relationship Between Fertility and Female Employment Rates in Developed Countries. Journal of Population Economics 15(4): 667–682. doi:10.1007/s001480100078.
Beck, N. and Katz, J.N. (2007). Random Coefficient Models for Time-Series Cross-Section Data. Monte Carlo Experiments. Political Analysis 15(2): 182–195.
doi:10.1093/pan/mpl001.
Beck, N. and Katz, J.N. (1995). What to Do (and Not to Do) With Time-Series Cross-Section Data. The American Political Science Review 89(3): 634–647.
doi:10.2307/2082979.
Becker, G.S. (1960). An Economic Analysis of Fertility. In: Roberts, G.B. (ed.). Demographic and Economic Change in Developed Countries. Princeton: Princeton University Press: 209–231.
Becker, G.S. (1991). A Treatise on the Family. Cambridge: Harvard University Press.
Brewster, K.L. and Rindfuss, R.R. (2000). Fertility and Women’s Employment in Industrialized Nations. Annual Review of Sociology 26(1): 271–296.
doi:10.1146/annurev.soc.26.1.271.
Butz, W.P. and Ward, M.P. (1979). The Emergence of Countercyclical US Fertility. American Economic Review 69(3): 318–328.
Castles, F.G. (2003). The World Turned Upside Down. Below Replacement Fertility, Changing Preferences and Family-Friendly Public Policy in 21 OECD Countries. Journal of European Social Policy 13(3): 209–227. doi:10.1177/
09589287030133001.
de Laat, J. and Sevilla Sanz, A. (2007). Working Women, Men’s Home Time and Lowest Low Fertility. Oxford: University of Oxford, Department of Economics (Discussion Paper Series: 308).
Engelhardt, H., Kögel, T., and Prskawetz, A. (2004). Fertility and Female Employment Reconsidered. A Macro-Level Time Series Analysis for developed countries, 1960–2000 Population Studies 58(1): 109–120. doi:10.1080/
0032472032000167715.
Engelhardt, H. and Prskawetz, A. (2005). A Pooled Time-Series Analysis on the Relation Between Fertility and Female Employment. Vienna: Vienna Institute of Demography of the Austrian Academy of Sciences (European Demographic Research Papers: 1).
Engelhardt, H. (2009). Zum Wandel der Korrelation von Fertilität und Frauenerwerbstätigkeit in Raum und Zeit. Eine empirische Analyse unter Berücksichtigung der Effekte ausgewählter sozialer Indikatoren. Zeitschrift für Familienforschung 21(3): 245–263.
Esping-Andersen, G. (1990). The Three Worlds of Welfare Capitalism. Cambridge: Polity Press.
Esping-Andersen, G. (1999). Social Foundations of Postindustrial Economies. Oxford: Oxford University Press. doi:10.1093/0198742002.001.0001.
Gakidou, E., Cowling, K., Lozano, R., and Murray, C.J.L. (2010). Increased Educational Attainment and Its Effect on Child Mortality in 175 Countries Between 1970 and 2009. A Systematic Analysis. Lancet 376(9745): 959–974.
doi:10.1016/S0140-6736(10)61257-3.
Goldin, C. (2006). The Quiet Revolution that Transformed Women’s Employment, Education, and Family. Cambridge: National Bureau of Economic Research (NBER Working Paper: 11953). doi:10.3386/w11953.
Kögel, T. (2004). Did the Association Between Fertility and Female Employment Within OECD Countries Really Change Its Sign? Journal of Population Economics 17(1): 45–65. doi:10.1007/s00148-003-0180-z.
Kohler, H.-P., Billari, F., and Ortega, J.A. (2002). The Emergence of Lowest-Low Fertility in Europe during the 1990s. Population and Development Review 28(4): 641–680. doi:10.1111/j.1728-4457.2002.00641.x.
Luci, A. (2011). Frauen auf dem Arbeitsmarkt in Deutschland und Frankreich. Warum es Französinnen besser gelingt, Familie und Beruf zu vereinbaren. Berlin: Friedrich-Ebert-Stiftung (Internationale Politikanalyse).
McDonald, P. (2000). Gender Equity in Theories of Fertility Transition. Population and Development Review 26(3): 427–439. doi:10.1111/j.1728-4457.2000.00427.x.
Michael, R.T. (1985). Consequences of the Rise in Female Labor Force Participation Rates. Questions and Probes. Journal of Labor Economics 3(1/2): 117–146.
doi:10.1086/298078.
Mincer, J. (1963). Market Prices, Opportunity Costs and Income Effects. In: Christ, C., Friedman, M., Goodman, L.A., Griliches, Z., Harberger, A.C., Liviatan, N., Mincer, J., Mundlak, Y., Nerlove, M., Patinkin, D., Telser, L.G., and Theil, H. (eds.). Measurement in Economics. Studies in Mathematical Economics and Econometrics. Stanford: Stanford University Press.
Örsal, D.D.K. and Goldstein, J.R. (2010): The Increasing Importance of Economic Conditions on Fertility. Rostock: Max-Planck-Institute for Demographic Research (MPIDR Working Paper, WP-2010-014).
Pampel, F.C. (2001). The Institutional Context of Population Change. Chicago: University of Chicago Press. doi:10.7208/chicago/9780226645278.001.0001.
Rindfuss, R.R., Guzzo, B.K., and Morgan, S.P. (2003). The Changing Institutional Context of Low Fertility. Population Research and Policy Review 22(5-6): 411– 438. doi:10.1023/B:POPU.0000020877.96401.b3.
Schofer, E. and Meyer, J.W. (2005). The Worldwide Expansion of Higher Education in the Twentieth Century. American Sociological Review 70(6): 898–920.
doi:10.1177/000312240507000602.
Sobotka, T. (2008). Does Persistent Low Fertility Threaten the Future of European Populations? In: Surkyn, J., Deboosere, P. and van Bavel, J. (eds.). Demographic Challenges for the 21st Century. A State of Art in Demography. Brussels: VUBPRESS: 27–89.
van Bavel, J. and Nitsche, N. (2013). ‘The Proper Age for Parenthood’ and Second Birth Rates in Europe. European Sociological Review 29(6): 1149–1161.
doi:10.1093/esr/jct003.
Appendix
Total fertility rate:
Average number of children that would be born alive to a woman during her lifetime, based on a given set of age-specific fertility rates observed in a population during a given year
Sources: World Bank – World Development Indicators (all countries except Germany): http://data.worldbank.org/ [January 2013]; Max-Planck-Institute of Demographic Research – Human Fertility Database (West Germany until 1990, Reunited Germany since 1991): http://www.humanfertility.org [January 2013]
Age-specific fertility rates:
Estimated average from observed fertility rates of ages within five-year ranges (20 to 24, 25 to 29, 30 to 34, 35 to 39) in a population during a given year
Sources: European Commission – Eurostat (all countries except the following): http://epp.eurostat.ec.europa.eu [January 2013]; Max-Planck-Institute of Demographic Research – Human Fertility Database (Canada, West Germany until 1990, Reunited Germany since 1991, Japan, United States): http://www.humanfertility.org [January 2013]
(Age-specific) female labor force participation:
Number of females working part- or full-time or actively seeking employment at ages 15 to 64, for the total and in five-year groups (20 to 24, 25 to 29, 30 to 34, 35 to 39) for the age-specific rates divided by the total female population at the respective age
Appendix 1A: Total and age-specific fertility and FLP by country
Data: see Appendix
15 55 95 1 .1 2 .7 4 .3
1960 1970 1980 1990 2000 2010 TFR FLP
15 55 95 1 .1 2 .7 4 .3
1960 1970 1980 1990 2000 2010
15 55 95 1 .1 2 .7 4 .3
1960 1970 1980 1990 2000 2010
15 55 95 1 .1 2 .7 4 .3
1960 1970 1980 1990 2000 2010
15 55 95 1 .1 2 .7 4 .3
1960 1970 1980 1990 2000 2010
15 55 95 1 .1 2 .7 4 .3
1960 1970 1980 1990 2000 2010
total values TFR FLP .0 1 .1 3 .2 5
1960 1970 1980 1990 2000 2010 United States .0 1 .1 3 .2 5
1960 1970 1980 1990 2000 2010 Canada .0 1 .1 3 .2 5
1960 1970 1980 1990 2000 2010 United Kingdom .0 1 .1 3 .2 5
1960 1970 1980 1990 2000 2010 Ireland .0 1 .1 3 .2 5
1960 1970 1980 1990 2000 2010 Sweden .0 1 .1 3 .2 5
1960 1970 1980 1990 2000 2010 Norway age-specific fertility 20-24 25-29 15 55 95
1960 1970 1980 1990 2000 2010
15
55
95
1960 1970 1980 1990 2000 2010
15
55
95
1960 1970 1980 1990 2000 2010
15
55
95
1960 1970 1980 1990 2000 2010
15
55
95
1960 1970 1980 1990 2000 2010
15
55
95
1960 1970 1980 1990 2000 2010
age-specific FLP
30-34 35-39
Appendix 1B: Total and age-specific fertility and FLP by country
Data: see Appendix
15 55 95 1 .1 2 .7 4 .3
1960 1970 1980 1990 2000 2010 TFR FLP
15 55 95 1 .1 2 .7 4 .3
1960 1970 1980 1990 2000 2010
15 55 95 1 .1 2 .7 4 .3
1960 1970 1980 1990 2000 2010
15 55 95 1 .1 2 .7 4 .3
1960 1970 1980 1990 2000 2010
15 55 95 1 .1 2 .7 4 .3
1960 1970 1980 1990 2000 2010
15 55 95 1 .1 2 .7 4 .3
1960 1970 1980 1990 2000 2010
total values TFR FLP .0 1 .1 3 .2 5
1960 1970 1980 1990 2000 2010 Finland .0 1 .1 3 .2 5
1960 1970 1980 1990 2000 2010 Denmark .0 1 .1 3 .2 5
1960 1970 1980 1990 2000 2010 Belgium .0 1 .1 3 .2 5
1960 1970 1980 1990 2000 2010 Luxembourg .0 1 .1 3 .2 5
1960 1970 1980 1990 2000 2010 France .0 1 .1 3 .2 5
1960 1970 1980 1990 2000 2010 Germany age-specific fertility 20-24 25-29 15 55 95
1960 1970 1980 1990 2000 2010
15
55
95
1960 1970 1980 1990 2000 2010
15
55
95
1960 1970 1980 1990 2000 2010
15
55
95
1960 1970 1980 1990 2000 2010
15
55
95
1960 1970 1980 1990 2000 2010
15
55
95
1960 1970 1980 1990 2000 2010
age-specific FLP
30-34 35-39
Appendix 1C: Total and age-specific fertility and FLP by country
Data: see Appendix
15 55 95 1 .1 2 .7 4 .3
1960 1970 1980 1990 2000 2010 TFR FLP
15 55 95 1 .1 2 .7 4 .3
1960 1970 1980 1990 2000 2010
15 55 95 1 .1 2 .7 4 .3
1960 1970 1980 1990 2000 2010
15 55 95 1 .1 2 .7 4 .3
1960 1970 1980 1990 2000 2010
15 55 95 1 .1 2 .7 4 .3
1960 1970 1980 1990 2000 2010
total values TFR FLP .0 1 .1 3 .2 5
1960 1970 1980 1990 2000 2010 Italy .0 1 .1 3 .2 5
1960 1970 1980 1990 2000 2010 Spain .0 1 .1 3 .2 5
1960 1970 1980 1990 2000 2010 Portugal .0 1 .1 3 .2 5
1960 1970 1980 1990 2000 2010 Greece .0 1 .1 3 .2 5
1960 1970 1980 1990 2000 2010 Japan age-specific fertility 20-24 25-29 15 55 95
1960 1970 1980 1990 2000 2010
15
55
95
1960 1970 1980 1990 2000 2010
15
55
95
1960 1970 1980 1990 2000 2010
15
55
95
1960 1970 1980 1990 2000 2010
15
55
95
1960 1970 1980 1990 2000 2010
age-specific FLP
30-34 35-39
Appendix 2: Effects of female labor force participation on total and age-specific fertility and the underlying country heterogeneity between 1985 and 2010
total 20-24 25-29 30-34 35-39
b b b b b
FLP -7.6E-03 ** -7.1E-04 ** -9.5E-04 ** -5.0E-04 ** -3.1E-04 **
year (ref.: 1985)
1986 -.048 -.016 ** -6.0E-03 4.5E-04 -1.1E-03
1987 -.290 ** -.024 ** -.017 ** -3.7E-03 -5.1E-03 **
1988 -.380 ** -.029 ** -.025 ** -6.6E-03 + -9.0E-03 **
1989 -.540 ** -.050 ** -.040 ** -.013 ** -.012 **
1990 -.590 ** -.065 ** -.046 ** -.014 ** -.013 **
1991 -.630 ** -.068 ** -.053 ** -.013 * -.014 **
1992 -.640 ** -.071 ** -.058 ** -.019 ** -.014 **
1993 -.670 ** -.082 ** -.055 ** -.016 * -.017 **
1994 -.700 ** -.085 ** -.053 ** -.011 -.016 **
1995 -.690 ** -.089 ** -.057 ** -.010 -.015 **
1996 -.560 ** -.090 ** -.050 ** 4.1E-03 -7.9E-03 +
1997 -.500 ** -.087 ** -.054 ** .012 -5.7E-03
1998 -.490 ** -.089 ** -.055 ** .016 + -6.8E-03
1999 -.480 ** -.083 ** -.057 ** .013 -7.5E-03
2000 -.440 * -.077 ** -.067 ** .013 -2.1E-03
2001 -.460 * -.081 ** -.074 ** .013 -1.6E-03
2002 -.460 * -.079 ** -.075 ** 8.2E-03 4.8E-04
2003 -.540 ** -.083 ** -.079 ** -2.3E-03 3.5E-04
2004 -.520 * -.079 ** -.081 ** -5.8E-04 5.8E-03
2005 -.580 * -.079 ** -.088 ** -.013 5.6E-03
2006 -.590 * -.081 ** -.084 ** -8.7E-03 9.9E-03
2007 -.600 * -.089 ** -.072 ** 3.9E-03 .016 *
2008 -.500 + -.091 ** -.073 ** 3.7E-03 .023 **
2009 -.540 + -.091 ** -.073 ** 3.7E-03 .025 **
2010 -.670 * -.092 ** -.078 ** -4.7E-03 .020 *
cross-level interaction
FLP*
1986 8.5E-04 1.9E-04 ** 1.0E-04 + 2.7E-05 3.2E-05 +
1987 4.9E-03 ** 2.6E-04 ** 2.6E-04 ** 1.2E-04 ** 1.1E-04 **
1988 6.8E-03 ** 3.2E-04 ** 4.2E-04 ** 2.2E-04 ** 1.9E-04 **
1989 9.5E-03 ** 5.9E-04 ** 6.2E-04 ** 3.4E-04 ** 2.5E-04 **
1990 .011 ** 8.1E-04 ** 7.4E-04 ** 3.9E-04 ** 2.7E-04 **
Appendix 2: (Continued)
total 20-24 25-29 30-34 35-39
b b b b b
1992 .011 ** 8.2E-04 ** 8.6E-04 ** 5.0E-04 ** 3.2E-04 **
1993 .011 ** 9.2E-04 ** 7.7E-04 ** 4.6E-04 ** 3.6E-04 **
1994 .012 ** 9.4E-04 ** 7.1E-04 ** 4.2E-04 ** 3.6E-04 **
1995 .011 ** 9.6E-04 ** 7.1E-04 ** 4.2E-04 ** 3.6E-04 **
1996 8.5E-03 ** 9.5E-04 ** 6.0E-04 ** 2.4E-04 * 2.8E-04 **
1997 7.6E-03 ** 8.7E-04 ** 6.3E-04 ** 1.6E-04 2.7E-04 **
1998 7.2E-03 ** 8.9E-04 ** 6.1E-04 ** 1.2E-04 3.0E-04 **
1999 7.1E-03 ** 7.9E-04 ** 6.3E-04 ** 1.7E-04 3.3E-04 **
2000 6.8E-03 * 6.9E-04 ** 7.6E-04 ** 2.1E-04 2.8E-04 **
2001 7.0E-03 * 7.2E-04 ** 8.2E-04 ** 2.2E-04 2.9E-04 **
2002 7.0E-03 * 6.7E-04 ** 8.2E-04 ** 2.9E-04 * 2.8E-04 **
2003 8.5E-03 * 7.1E-04 ** 8.6E-04 ** 4.7E-04 ** 3.1E-04 **
2004 8.5E-03 * 6.5E-04 ** 8.9E-04 ** 4.8E-04 ** 2.5E-04 **
2005 9.5E-03 * 6.4E-04 ** 9.7E-04 ** 6.5E-04 ** 2.8E-04 **
2006 .010 * 6.8E-04 ** 9.3E-04 ** 6.4E-04 ** 2.5E-04 **
2007 .011 * 8.0E-04 ** 7.7E-04 * 4.9E-04 ** 2.1E-04 *
2008 9.6E-03 * 8.6E-04 ** 8.0E-04 ** 5.3E-04 ** 1.6E-04
2009 .010 * 8.4E-04 ** 7.9E-04 * 5.2E-04 ** 1.4E-04
2010 .012 * 8.5E-04 ** 8.6E-04 ** 6.5E-04 ** 2.2E-04 +
constant 2.094 ** .135 ** .187 ** .105 ** .045 **
country variances:
intercept
variance .010 * 1.6E-07 6.7E-05 5.4E-05 ** 8.7E-05 **
slope variance 4.0E-05 ** 1.0E-07 ** 4.6E-07 ** 1.6E-07 **
intercept-slope
covariance -6.3E-04 -1.3E-08 -5.2E-06 -3.0E-06
residuals - AR(1):
variance .064 ** 2.3E-04 ** 3.9E-04 ** 2.4E-04 ** 5.1E-05 **
rho .990 ** .990 ** .991 ** .991 ** .985 **
log-likelihood 803.53 2017.46 1909.68 2024.12 2116.26
Appendix 3: The share of between-country variance in the total variance
Data: see Appendix
0
.1
.2
v
ar
ianc
e par
ti
ti
on c
oef
fi
c
ient
1985 1990 1995 2000 2005 2010 total fertility
0
.1
.2
.60
.65
1985 1990 1995 2000 2005 2010
20-24 25-29
30-34 35-39
age-specific fertility