ENGINEERING & GINNING
Impact of Gin Saw-tooth Design on Fiber and Textile Processing Quality
S.E. Hughs* and Carlos B. Armijo
S.E. Hughs and C.B. Armijo, USDA, ARS, Southwestern Cotton Ginning Research Laboratory, 300 E. College Dr., P.O. Box 578, Mesilla Park, NM 88047
*Corresponding author: [email protected] ABSTRACT
Toothed gin saws have been used to separate cotton fiber from the seed for more than 200 years. A scientific analysis of saw-tooth design has never
been published and the optimum saw-tooth design has not been found. Initial laboratory ginning evaluations of some modern gin saw teeth have shown differences among designs in ginning rate, fiber length measurements, and textile processing quality. The saw gin stand used for testing was a Continental Double Eagle that had been cut down to 46 saws. Four different sets of 16-in diameter, commercially available replacement saws were obtained from independent suppliers. These four sets, along with the standard Continental saw set, were used for five test saw treatments. The test saws varied in the number of teeth per saw from 328 to 352. Testing of the five saw treatments was replicated four times for a total of 20 ginning lots. Each ginning lot was analyzed for raw fiber qual -ity and textile spinning performance. Most of the raw fiber properties were not significantly affected by the saw treatments. However, HVI length and length uniformity after one stage of lint cleaning and seed cotton processing rate were significantly different among saw treatments. The ginning rates varied by 34% from the lowest to the highest at 75% gin stand motor load. The ginned fiber was processed into both open-end and ring-spun yarns. There were few significant differences among saw treatments for the open-end yarn, but there were significant differences for the ring-spun yarn in ends down (a measure of spinning efficiency), yarn evenness, and yarn strength. This indicates that gin saw-tooth design might significantly affect spinning efficiency and yarn quality. Research is currently being done to further understand how gin saw-tooth design affects ginned fiber quality and textile processing quality factors.
T
he history of saw-tooth design started with Eli Whitney’s spike tooth gin patent on 14 March 1794 and Hodgen Holmes’ circular toothed saw patent on 12 May 1796 (Bennett, 1960). Since these original patents, there have been many attempts by private individuals and gin machinery manufacturers to design the perfect gin saw tooth that was durable, resulted in high ginning capacity, and caused minimalfiber damage. The names of some of these teeth were
wire teeth, sheathing wire claws, brier thorn spikes, gin saw with buckhorn needles, and wire needle teeth. The impetus behind the design of these gin saw teeth is unknown and their picturesque names have faded into history. By 1935, these earlier tooth designs had been abandoned and saw-tooth design had evolved to include a few designs that varied from approximately 32° to 48° in saw pitch angle and saw back designs of straight, moderate roach (slightly curved back), or heavy roach (more curve) (Bennett, 1960). The curved or roach-back designs were to give the tooth more mechanical strength than the simpler straight-backed tooth. These designs probably evolved more out of practical experience as to tooth wear, some subjective evaluation of ginning rate, and overall tooth life rather than organized research.
There have been some attempts by the USDA
to evaluate scientifically gin saw-tooth designs. In some of the first work by the USDA, Martin and
Stedronsky (1939) evaluated saw-tooth designs, saw diameters, and numbers of teeth per saw. They found that the number of teeth, pitch of the tooth, and tooth shape all affected ginning capacity.
Grif-fin and McCaskill (1969) reported on a number of
ginning experiments conducted at Stoneville, MS. There were several failures, but their positive conclu-sion was that the number of teeth on a saw should be limited to approximately 264 teeth or less on a
30.5-cm (12-in.) gin saw. Mayfield and McCaskill
(1970) evaluated a straight-back and a moderately roached-back tooth design. Their primary conclusion
was that the roached-back tooth caused significantly
as to differences in saw-tooth design, if any, that existed between the various gin saw manufacturers. Vandergriff (1997) noted that current saw thickness varied from 0.914 to 1.143 mm (0.036 to 0.045 in.) depending on the gin machinery manufacturer, and gave some of the current tooth dimensions. He also noted that the pitch angle of modern 30.5-cm (12-in.) gin saws has been nearly standardized and that there is some variation in number of teeth per saw.
Mayfield and McCaskill (1970) stated, “A complete analysis of the effects of each individual property of a saw on its performance has never been attempted. Saws have been designed at random and then their performance has been tested. Thus, no one has ever been positive that the best saw-tooth design has been found”. This statement is still true today.
Hughs and McAlister (2004) reported on
pre-liminary research that investigated raw fiber dif -ferences due to variety, ginning rib design, and gin saw-tooth design. They found that gin saw-tooth
design resulted in ginned fiber quality differences.
Hughs and Armijo (2013) released a preliminary report on a subsequent ginning test that investigated
the effects of gin saw design on raw fiber quality as
well as textile processing quality. Their tests found
that gin saw-tooth design affected not only raw fi -ber quality but also textile processing quality. The objective of this research was to test current gin
saw-tooth designs and evaluate their effects on fiber
quality, ginning performance parameters, and textile processing quality.
MATERIALS AND METHODS
The gin stand used for testing was a Conti-nental Double Eagle (ContiConti-nental Eagle Corp., Prattville, AL) that had been cut down to 46 saws. Four different sets of 16-in diameter, commercially available replacement saws for the Double Eagle gin stand were obtained from suppliers other than Continental. These four saw sets, along with the standard Continental saw set, were used for the
five test saw treatments. All of the saw sets were
manufactured to be interchangeable for the standard 16-in diameter Continental saws. The noticeable
difference between saw sets was that the number of teeth per saw varied from 328 to 352. Each saw set was stacked on a separate saw mandrel for rapid ease of installation and removal of different saws during the test. Each saw design was arbitrarily
as-signed an ID number from 1 to 5. Each saw mandrel
was randomly installed for each of the five gin saw
test conditions. A limiting factor of saw mandrel randomization was that although numbers were assigned randomly to each mandrel, once each mandrel was installed, all four replications were
run sequentially for that mandrel. The difficulty
of removal, installation, and adjustment of a given mandrel after each ginning lot and the probably of saw damage were judged too great to do otherwise. As each set of saws was mounted and adjusted in the
gin stand, the relationship of the saw-teeth leading edges to the ginning ribs was checked randomly at nine places along the saw mandrel, as
recom-mended by Columbus et al. (1994). All five sets of
test saws met the criteria for the general industry standards of saw-tooth leading edge to ginning rib at the ginning point.
The test cotton was a Delta Pine upland variety, typically grown in the Mesilla Valley of New Mexico using normal production practices for the area. All seed cotton came from one module that had been spindle-picker harvested after frost from a uniform
field. For testing, the seed cotton was transferred
to three separate trailers that were then randomly chosen for the ginning test lots. The assumption was that randomizing the input test seed cotton would compensate for not being able to completely randomize all of the ginning lots.
Testing of the five gin saws was replicated four
times resulting in a total of 20 ginning lots. Each gin-ning lot weighed 204 kg (450 lb) and was processed through seed cotton cleaning using two six-cylinder cleaners and one stick machine. No drying was needed on any of the ginning lots as the seed cotton had been harvested dry in the Mesilla Valley of New Mexico and then stored for a long period in trailers under covered storage. The seed cotton was ginned on the 46-saw gin stand, followed by one lint cleaner and the bale press. The gin stand was operated so as to maintain the same motor horsepower (approxi-mately 75% full load) for each ginning lot throughout the test. Gin stand motor load was maintained by adjusting the gin stand feeder seed cotton feed rate for each test saw. Seed cotton samples were taken at the trailer and the gin stand feeder apron. Ginned lint samples were taken after the gin stand and after
lint cleaning for moisture, trash, and raw fiber quality
analysis. The ginned lint lots, approximately 68 kg (150 lbs) each, were baled and sent to the USDA-ARS, Clemson Pilot Spinning Plant, Clemson, SC
Raw ginned fiber analysis consisted of High Volume Instrument (HVI, Uster Technologies, Uster, Switzerland), Advanced Fiber Information System (AFIS, Uster Technologies, Uster, Switzerland), and
Shirley Analyzer tests. Textile processing consisted of both open-end spinning (20 singles yarn count) and ring spinning (35 singles yarn count), and knit-ted fabric that was scoured and dyed for white speck count. Each ginning lot was split into two lots of approximately 34 kg (75 lbs) each for open-end and ring spinning. All spinning lots were carded at a rate of 68 kg (150 lbs) per hour with the ring-spun lots also being combed to produce 35-g sliver for spinning. Yarn testing included ends down, yarn evenness, yarn strength, and carding waste. Fabric testing only included counting of dying imperfec-tions commonly known as white specks.
Analysis of variance was performed with the General Linear Model (GLM) of SAS at the 5%
level of significance (version 9.1, SAS Institute, Inc., Cary, NC), and differences among main effect
treatment means were tested with Duncan’s new multiple-range test.
RESULTS AND DISCUSSION
An interesting result is shown in Table 1 with the average ginning rate in terms of the average weight of seed cotton processed through the saw gin stand per minute. The gin stand was operated at a constant 75% average motor load at all times, but many of
the saw treatments were significantly different from
each other and varied from a low of 30.4 kg (67 lb) to a high of 40.7 kg (90 lb) of seed cotton per minute. The saw with the highest ginning rate had the fewest number of teeth, 328. The saw with the second highest ginning rate had the same number of teeth, 352, as did the saw with the lowest ginning rate. Hughs and McAlister (2004) showed almost the same results for seed cotton processing rate using a different upland cotton but using the same test saws that were used for this test. When viewed under a
magnifying glass, the saw teeth of the five test saws
were somewhat different from each other in tooth shape (Fig. 1). Saw #2 is the standard Continental saw tooth and the other four are from other suppli-ers. The saw numbers in Fig. 1 correspond to the
test treatment number. In some way, unknown at the present, the saw-tooth shape has a more significant
effect on seed cotton ginning rate than does the total number of teeth per saw.
Table 1. Average gin saw processing performance and nep
countz
Saw Number
Number of Teeth per Saw
Kg (lbs)
Seed Cotton
per Minute
AFIS Nep Count,
no./g Before Lint
Cleaner
After Lint
Cleaner
1 328 40.7 (89.8) a 214 c 320 c 2 352 36.7 (81.0) b 220 bc 326 bc
3 352 36.4 (80.2) b 248 abc 351 abc 4 330 32.4 (71.5) c 268 a 371 a
5 352 30.4 (67.0) d 256 ab 358 ab
z Means followed by a different letter are significantly
different at the 5% level by Duncan’s new multiple-range test.
Figure 1. Profiles of test saw teeth.
Table 1 also shows an interesting difference in nep count before and after lint cleaning. The saws with the fewest teeth (numbers 1 and 4) also had the
lowest and the highest AFIS nep counts, respectively,
The ginned fiber was then processed into both open-end and ring-spun yarns. The only significant
differences between gin saw treatments for the open-end yarn were single strand elongation and
coefficient of variation of drawing sliver. These
measurements are relatively minor factors and so
these results are not shown. It is speculated that few
differences were found in the open-end yarn because the open-end yarn spinning system is used to make relatively coarse yarn counts. These coarser yarns
are less sensitive to raw fiber length parameters than are finer ring-spun yarns.
There were several significant differences in
spinning parameters and yarn properties for the ring-spun yarn. Table 4 shows some of the more important ring-spun yarn differences with ends down being one of the more important to the spin-ner. Table 4 shows that the gin saw (#1) with the
highest seed cotton processing rate had significantly
higher ends down compared to the other four saws. The saw with the lowest seed cotton ginning rate (#5) had one of the lowest number of ends down per 1000 spinning hours. Another gin saw (#2), which had an intermediate seed cotton processing rate, also was equivalent to gin saw #5 in the lower number of ends down. Ends down are a measure
of spinning efficiency with the lower the number meaning higher spinning efficiency, which equates to higher productivity and ultimately higher profit -ability to the spinner. This test indicates that gin
saw-tooth design has a significant effect on spinning efficiency at the textile mill. Table 4 also shows
that the higher variation in yarn strength and yarn evenness, as indicated by yarn neps, follows the
same pattern as ends down for the five test saws.
The higher the variation in yarn strength and the more neps, the more ends down.
did not show a significant difference in nep count
between saws. Not shown in Table 1 are the average moisture contents for the seed cotton and lint for each test. Moisture content differences could con-tribute to differing nep levels. However, seed cotton moisture averaged 6.8% (dry base) and lint moisture averaged 5.9% (dry base) across treatments, with no statistical difference in moisture content between test treatments. These moisture levels are in the recom-mended range for ginning cotton and therefore, it can be assumed that moisture level did not contribute
to significant differences in nep levels between test saws. Significant differences in nep levels shown in
Table 1 from this test and not shown in earlier tests by Hughs and McAlister (2004) might be a factor of this test cotton being grown in a different year, or that it was a different variety than used in the earlier test.
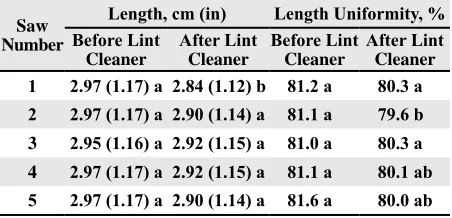
HVI average length and length uniformity before
and after one stage of lint cleaning are shown in Table 2. The trends are the same for both measure-ments as those reported by Hughs and McAlister
(2004); however, the only significant difference between saws for this test was fiber length and
length uniformity after lint cleaning. The saw with
the significantly highest seed cotton ginning rate had the significantly shortest length but one of the
higher uniformities, although the differences in
both cases were relatively small. The average AFIS raw fiber length parameters shown in Table 3 did not result in any significant differences before or
after lint cleaning between saw-tooth designs. The earlier test by Hughs and McAlister (2004) showed
significant differences in these same AFIS measure -ments after lint cleaning. Even though the average
AFIS measurements were not significantly different
between saws, the overall trends are what would be expected with both length and length uniformity being decreased by lint cleaning.
Table 2. Average raw fiber HVI dataz
Saw Number
Length, cm (in) Length Uniformity, % Before Lint
Cleaner
After Lint
Cleaner
Before Lint
Cleaner
After Lint
Cleaner
1 2.97 (1.17) a 2.84 (1.12) b 81.2 a 80.3 a 2 2.97 (1.17) a 2.90 (1.14) a 81.1 a 79.6 b
3 2.95 (1.16) a 2.92 (1.15) a 81.0 a 80.3 a 4 2.97 (1.17) a 2.92 (1.15) a 81.1 a 80.1 ab
5 2.97 (1.17) a 2.90 (1.14) a 81.6 a 80.0 ab
z Means followed by a different letter are significantly
different at the 5% level by Duncan’s new multiple-range test.
Table 3. Average raw fiber AFIS lengthz
Saw Number
Upper-Quartile Length
(w), cm (in) Short Fiber Content (w), % Before Lint
Cleaner
After Lint
Cleaner
Before Lint
Cleaner
After Lint
Cleaner
1 3.10 (1.22) a 3.02 (1.19) a 11.6 a 14.2 a 2 3.12 (1.23) a 3.02 (1.19) a 11.6 a 14.2 a
3 3.05 (1.20) a 3.02 (1.19) a 12.8 a 14.3 a 4 3.07 (1.21) a 3.02 (1.19) a 13.4 a 14.2 a
5 3.07 (1.21) a 3.05 (1.20) a 13.0 a 13.5 a
z Means followed by a different letter are significantly
Table 5 shows some additional measures of yarn evenness where there are also significant
differences between the five gin saws. In all cases
for the measurements of yarn; thick places, thin
places, and coefficient of variation (CV) of yarn
irregularity, the gin saw that had the lowest number
of ends down also resulted in significantly more
uniform yarn. Conversely the gin saw with the highest numbers of ends down resulted in higher yarn irregularity.
The ring-spun yarns were knit into fabric and dyed to test for their level of white specks or dying imperfections. The level of white specks for the
dyed fabrics was low and not significantly different between any of the five gin saws ( data not shown).
No other fabric properties were tested.
SUMMARY
This is a report of the test results of gin
process-ing of a uniform upland cotton usprocess-ing five different
gin saw designs all manufactured to be compatible with a Continental Double Eagle saw gin stand.
Specific quality measurements were taken at each
processing step including ginning, yarn spinning,
and dyed cloth. Significant observations from the
test are as follows:
1. The major difference in ginning performance
between the five different saw sets was that,
at constant gin-stand motor load, their seed cotton processing rate varied by as much as 34% from lowest to highest.
2. The number of teeth per saw ranged from 328 to 352; the saw with the fewest teeth had the highest seed cotton ginning rate and one of the saws with the most teeth had the lowest ginning rate.
3. There were almost no significant differences
in raw ginned fiber quality as measured by the HVI or AFIS.
4. There were no important significant differ -ences in 20/1 open-end yarn processing pa-rameters or yarn quality from the test cottons
produced by the five different gin saw designs.
5. There were important differences in 35/1 ring-spun yarns made from test cottons ginned by
Table 4. Average ring-spun 35/1 yarn quality averagesz
Saw Number
Ends Down,
no./1000 hrs Strength, CVSingles Yarn Neps/914.4 m (1000 yd) 1 87.0 a 11.9 a 1070 a 2 32.8 b 11.1 b 930 b
3 66.5 ab 11.2 b 1054 a 4 51.8 ab 11.6 a 1042 a
5 29.5 b 10.6 c 898 b
z Means followed by a different letter are significantly
different at the 5% level by Duncan’s new multiple-range test.
Table 5. Average ring-spun 35/1 evenness valuesz
Saw Number
Thick Places,
no./914.4 m (1000 yds)
Thin Places,
no./914.4 m (1000 yds)
Yarn
Irregularity,
CV 1 2268 a 859 a 24.1 a 2 2075 cd 711 cd 23.4 cd
3 2150 bc 748 bc 23.6 cb 4 2177 b 789 b 23.7 b
5 2002 d 666 d 23.2 d
z Means followed by a different letter are significantly
different at the 5% level by Duncan’s new multiple-range test.
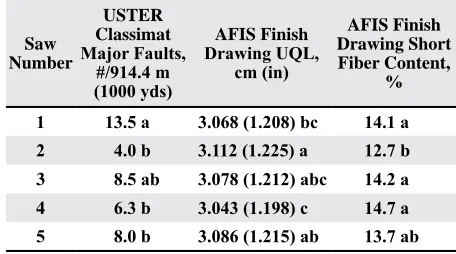
Table 6 shows additional significantly differ -ent quality measurem-ents for the ring-spun yarn. These data do not show as clear a pattern as do the data in Tables 4 and 5, but the gin saw with
the highest number of ends down had significantly
higher major yarn faults as well as intermediate
length and short fiber content after combing (fin -ish drawing). The upper-quartile length and short
fiber percentage differences, although significant, are not large between the different tests. Raw fiber
length measurements discussed earlier were not
significantly different for the most part and so it is difficult to ascribe significantly different yarn evenness and processing faults to raw fiber length
differences at this point.
Table 6. Average ring spinning yarn quality valuesz
Saw Number
USTER Classimat
Major Faults, #/914.4 m (1000 yds)
AFIS Finish
Drawing UQL, cm (in)
AFIS Finish Drawing Short Fiber Content,
%
1 13.5 a 3.068 (1.208) bc 14.1 a 2 4.0 b 3.112 (1.225) a 12.7 b
3 8.5 ab 3.078 (1.212) abc 14.2 a 4 6.3 b 3.043 (1.198) c 14.7 a
5 8.0 b 3.086 (1.215) ab 13.7 ab
z Means followed by a different letter are significantly
the five different gin saw designs. These dif
-ferences included textile spinning efficiency,
yarn evenness, and yarn strength.
6. There were no significant differences in dy -ing imperfections of knitted cloth made from either the open-end or the ring-spun yarns.
In summary, there were important and significant
differences between gin saws of different designs made for the same gin stand. These differences are
related to processing efficiency in both the ginning
process as well as the spinning process for higher
quality ring-spun yarns. In addition, yarn quality
for ring-spun yarns, as measured by yarn evenness, strength, and yarn faults, was affected by the design of the saw tooth used to produce the raw ginned
fiber. Further testing needs to be done to determine
what saw-tooth design parameters contribute to the
significantly different ginning and textile processing
performance.
DISCLAIMER
Mention of trade names or commercial prod-ucts in this publication is solely for the purpose of
providing specific information and does not imply
recommendation or endorsement by the U.S. Depart-ment of Agriculture. USDA is an equal opportunity provider and employer.
REFERENCES
Bennett, C.A. 1960. Saw and toothed cotton ginning develop-ments. Texas Cotton Ginners Association, Dallas, TX.
Columbus, E.P, D.W. Van Doorn, B.M. Norman, and R.M. Sutton. 1994. Gin stands. p. 90–102 In W.S. Anthony
andW.D.Mayfield (eds). Cotton Ginners Handbook.
USDA-ARS Handbook 503, Washington, DC.
Griffin, A.C., and O.L. McCaskill. 1969. Gin-stand research
at Stoneville, Mississippi: 1956-66. USDA Tech. Bull. 1407. Washington, DC.
Hughs, S.E., and C.B. Armijo. 2013. Impact of gin saw
tooth design on textile processing. p. 988–989 In Proc. Beltwide Cotton Conf., San Antonio, TX. 7-10 Jan. Natl. Cotton Counc. Am., Memphis, TN.
Hughs, E., and D. McAlister. 2004. Evaluation of selected gin saw tooth designs. p. 969–972 In Proc Beltwide Cotton Conf., San Antonio, TX. 5-9 Jan.. Natl. Cotton Counc. Am., Memphis, TN.
Martin, W.J., and V.L. Stedronsky. 1939. Effects of variations in design of gin-saw teeth on lint quality and ginning
ef-ficiency. USDA, Agr. Market. Serv. Bur. Agr. Chem. Eng.
Washington, DC.
Mayfield, W.D., and O.L. McCaskill. 1970. An evaluation of
the performance of two gin saw tooth designs. USDA, ARS, ARS 42-175. Washington, DC.