The Influence of Structural Changes in Volatility
on Shock Transmission and Volatility Spillover
among Iranian Gold and Foreign Exchange
Markets
1Mohammad Mahdi Shahrazi Zahra (Mila) Elmi Esmaiel Abounoori
Saeed Rasekhi
Received: 2013/11/3 Accepted: 2014/1/15
Abstract
he increasing integration of financial markets has generated strong interest in understanding the interaction between these markets. The direction of shock transmission and volatility Spillover from one market to another may affect by structural changes in volatility. However, a shortcoming of traditional GARCH models is that ignore these structural changes. This study investigates the effect of structural changes in volatility on shock transmission and volatility Spillover among Iranian gold and foreign exchange markets during 2007-2013. For this purpose, first we detect the time points of structural breaks in volatility of gold and exchange rate returns endogenously using the modified iterated cumulative sums of squares algorithm. Then, we incorporate this information to modeling volatility process. The results of applying bivariate GARCH model in off-diagonal BEKK parameterization suggest that volatility spillover among Iranian gold and foreign exchange markets is bidirectional but shock transmission is unidirectional from the gold market to the foreign exchange market. Based on findings, ignoring structural breaks in volatility mislead the researcher about the dynamics of shocks and volatilities among these two important markets.
Keywords: Structural Changes, Volatility, Shock Transmission, Spillover Effect, Modified ICSS Algorithm, GARCH Process.
1- This article is extracted from a doctoral dissertation
PhD Student, Department of Economics, University of Mazandaran
Associate Professor, Department of Economics, University of Mazandaran
Professor, Department of Economics, University of Semnan
Associate Professor, Department of Economics, University of Mazandaran
1- Introduction
The liberalization and integration of the financial markets have pushed researchers to focus on the process of information transmission between these markets. The information of one market can be incorporated into the volatility process of another market (Arago and Fernandez, 2007). In another hand, financial markets often experience structural breaks in volatility. These regime shifts in volatility could be caused by domestic or global economic, political, social or natural events (Ewing and Malik, 2010). Incorporating structural changes in volatility may affect the direction of shock transmission and volatility spillover between financial markets (Darrat and Benkato, 2003).
Volatility, in general, represents risk or uncertainty associated with an asset and, hence, exploring the behavior of volatility of asset returns is relevant for the financial assets pricing, risk management, portfolio selection and trading strategies. Correctly estimating volatility dynamics in financial markets is important for building accurate asset pricing models, forecasting future price volatility, designing optimal portfolios and optimal hedging strategies (Poon and Granger, 2003).
In the literature of financial economics, one of the popular approaches for capturing the volatility of asset markets is generalized autoregressive conditional heteroscedasticity (GARCH) models by specifying the conditional mean and conditional variance equations. However, the standard GARCH model does not incorporate sudden changes in variance and hence, maybe inappropriate for investigating volatility dynamics(Kang et al, 2011).The direction of shock transmission and volatility Spillover from one market to another may affect by structural changes in volatility. Thus, in analyzing the volatility of asset prices it is necessary to consider these structural changes.
remainder of this paper is organized as follows. Section 2 briefly presents the literature review. Section 3 describes data and the methodology used. The empirical results are discussed in the section4, and conclusion is presented in the final section.
2- Literature Review
Since the pioneer studies in international transmission of shocks in returns, most of the studies have focused on the analysis of relations in mean among different markets. It was in the 1990s when academics started to realize the importance of modeling, as well, interactions in the second moments. In fact, it seems that some markets have even more interdependence in volatility than in returns (Soriano and Climent, 2006).The arrival of information on the market comes in waves and causes volatility as it is incorporated into the price. The existence of the spillover effect implies that one large shock not only in its own asset or market but also in other assets or markets. Ross (1989) shows that volatility in asset returns depends upon the rate of information flow, suggesting that information from one market can be incorporated into the volatility generating process of the another market. Since the flow of information and the time used in processing that information vary across markets, one may expect different volatility patterns across markets (Ewing and Malik, 2013). If information comes in clusters, prices may exhibit volatility even if the market perfectly and instantaneously adjusts to the news. Thus, studies on volatility spillover can help us understand how information is transmitted across markets. Fleming, Kirby, and Ostdiek (1998) show that cross-market hedging and sharing of common information can transmit volatility across markets over time. There are some studies in empirical literature that detect structural breaks in variance and then, investigate the dynamics of shocks and volatilities among different markets incorporating these break points.
the modified iterated cumulated sums of squares (ICSS) algorithm. The results showed strong evidence of significant transmission of volatility between gold and oil returns when structural breaks in variance are accounted for in the model.
Kang et al (2011) examined the influence of structural changes in volatility on the transmission of information in two crude oil prices namely, West Texas Intermediate (WTI) Cushing (US) and Brent (North Sea, Europe) using weekly data from 1990 to 2009. In an effort to assess the impact of these structural changes, they first identified the time points at which structural changes in volatility occurred using the ICSS algorithm, and then incorporated this information into their volatility modeling. From the estimation results using a bivariate GARCH framework with and without structural change dummies, they found that ignoring structural changes may distort the direction of information inflow and volatility transmission between crude oil markets.
Arago and Fernandez (2007) analyzed the influence of structural changes in volatility on the transmission of information in European stock markets during the period 1995–2004. In order to include structural changes in variance, they followed Sanso et al. (2004) modification of the methodology proposed by Inclan and Tiao (1994), which detects these changes endogenously. To study the existence of transmission of volatility they used an asymmetric bivariate GARCH model, specifically, the time-varying covariance asymmetric BEKK model. They concluded that when structural changes in unconditional variance are taken into account, the scheme of transmission changes. Their results showed the significance of the variables that represent these changes. In light of these findings, they asserted that structural change should be considered in this type of research, since it influences the scheme of transmission. If the changes in variance detected in this type of study are not incorporated, bias will appear in the conclusions derived from results of studies on stock market information transmission and therefore, structural changes in volatility should be incorporated into this type of study.
the transmission in volatility and, in essence, removes the spillover effects. They concluded that ignoring regime changes may lead one to significantly overestimate the degree of volatility transmission that actually exists between the conditional variances of small and large firm returns.
3- Data and Methodology
3-1- DataIn this paper, we used exchange rate data which includes daily spot data between the US Dollar (USD) and the Iranian Rial (IRR). Also, as an index of Iranian gold market we used new plan coin data. All of the data were obtained via the Central Bank of the Islamic Republic of Iran.
The sample covers the period from 25/03/2007until 19/08/2013, which provided a total of 1544 observations. The series of daily returns were calculated as the difference between the logarithms of the prices between two consecutive days:
(1)
wherePt and Rt respectively denote the price and return at time t.
3-2- Methodology
This section documents how we detect structural breaks in variance. We also describe our bivariate GARCH models and discuss how we incorporate structural breaks into our models to illustrate the change in volatility dynamics.
3-2-1- Detecting Points of Structural Change in Variance
Inclan and Tiao (1994) proposed a test procedure that is based on “Iterative Cumulative Sum of Squares” (ICSS) to detect structural breaks in the unconditional variance of a stochastic process. It assumes that the variance of a time series is stationary over an initial period of time, until a structural change occurs as the result of a sequence of financial events; the variance then reverts to stationary until another market shock occurs. This process is repeated over time, generating a time series of observations with an unknown number of changes in the variance. In order to test null hypothesis of constant unconditional variance against the alternative
ln 1
Pt Rt
Pt
hypothesis of a break in the unconditional variance, Inclan and Tiao (1994) propose using the statistic given by:
(2)
Where
0
- 1,..., 0
K
K T
T
C K
D K T D D
C T
(3)
2 1
K=1,...,T K
K t
t
C
(4)
t
denote an independent time series with a zero mean and an unconditional variance,
t2 for t=1, 2,…,T.CKis the cumulative sum of squares from the first observation to the kth point in time and CT is the sum of the squared residuals from the whole sample period. By letting Kas thevalue at which
max
KD
K is reached, ifmax
2
K K
T
D
exceeds the criticalvalue, then K is taken as an estimate of the change point. At the 5% significance level, the critical value computed by Inclan and Tiao (1994) is 1.358.
Sanso et al. (2004) find certain drawbacks in the ICSS algorithm that invalidates its use for financial time series. The most serious drawback of the IT-statistic is that it assumes independently and identically distributed random variables. To wit, the ICSS algorithm neglects kurtosis properties of the process and also it does not take into consideration the conditional heteroskedasticity. To circumvent these problems, they propose the adjusted IT (AIT) algorithm as a modification of IT algorithm (Kumar and Maheswaran, 2012). The AIT test statistic given by:
(
5
)
1
2
sup
K KK=1,...,T
AIT
T G
2
KWhereGk ˆ4 1/ 2 CK KCT T
and
ˆ4 is a consistent estimatorof
4.A non-parametric estimator of
4 is given by:
2 2
2
2 2
2 2
4 1
1 1 1
1 2
ˆ ˆ , ˆ ˆ
T m T
t t t
t l t
l m
T T
(6)Wherel 4( / 100)T 1/5 and ω(l, m) is a lag window, such as the Barlett, defined as
l m, 1 l/
m1
. The lag truncation parameter m is estimated using the procedure in Newey and West (1994) estimator. The 95thpercentile critical value for the asymptotic distribution of AIT statistic is 1.4058 (Korkmaz et al., 2012).3-2-2- Bivariate GARCH Model without Structural Change Dummies
In this study, we use the popular BEKK parameterization given by Engle and Kroner (1995) for the bivariate GARCH (1,1) model. A bivariate GARCH model can be characterized by the following expressions.
(
7)
1
, , ~ (0,1)
t t i t t t t
p
i t
i
R
R
z h z N
(
8
)
1 1
+
1t t t t
H
C C
A
A B H B
(
9
)
211, 12, 11 11 11 12 1, 1 1, 1 11 12
2
21, 22, 21 22 21 22 21 22 2, 1 2, 1 21 22
11, 1 12, 1 11 12
21, 1 22, 1 21 22
t t t t
t t t t
t t
t t
h h c c a a a a
h h c c c c a a a a
h h b b h h b b 11 12 21 22 b b b b
Expression (7) shows the first order moments expressed according to a bivariate VAR model. Rt represents the corresponding gold or exchange rate
return series and εt is normally distributed with a zero mean.
Ht in Expression (8) is a 2 × 2 matrix of conditional variance–covariance
by past squared errors, respectively), whereas the diagonal elements in matrix B measure their own GARCH effect (significant lagged variance, b11
and b22 would suggest that current conditional variance is affected by their
own past conditional volatility, respectively). Additionally, the off-diagonal elements (a12, a21 and b12, b21) in matrices A and B reveal the manner in
which shock and volatility are transmitted over time and across the crude markets. For example, the cross-product of the error terms a12 and a21 would
interpret the direction of shocks or news, whereas the covariance terms b12
and b21 would demonstrate the direction of volatility transmission (Kang et
al, 2011). The conditional variance for each equation can be expanded for the bivariate GARCH(1,1) as:
2 2 2 2 2 2 2
11,t 11 11 1, 1t 2 11 21 1, 1 2, 1t t 21 2, 1t 11 11, 1t 211 21 12, 1t 21 22, 1t
h c a
a a
a
b h b b h b h (10)
2 2 2 2 2 2 2 2
22,t 12 22 12 1, 1t
2
12 21 1, 1 2, 1t t 22 2, 1t 12 11, 1t2
12 22 12, 1t 22 22, 1th
c
c
a
a a
a
b h
b b h
b h
(11)
Eqs. (10) and (11) reveal how shocks and volatility are transmitted across the two series over time. The total number of estimated elements for the variance equations for bivariate case is 11.The parameters of the bivariate GARCH model can be estimated via the maximum likelihood method optimized with the Berndt, Hall, Hall, and Hausman (BHHH) algorithm. The conditional log likelihood function L(θ) is expressed as follows:
(
12
)
11 1
( ) log 2 0.5 log ( ) 0.5 ( ) log ( )
T T
t t t t
t t
L
T
H
H
in which T is the number of observations and θ denotes the vector
of all the unknown parameters(ibid).
3-2-3- Bivariate GARCH Model with Structural Change Dummies
By incorporating a set of dichotomous variables, which captures
regime changes in variances, Eq. (8) can be rewritten as follows:
1
1
+B H B+
t
N
t t t i i i i
i
H C C A D X X D
(13)
where Di is a (2×2) square diagonal matrix of parameters, Xi is a (1×2)
by the ICSS algorithm. The elements in Xi row vector represent the dummy
for each series. If a volatility break at time t is occurred in the first series, the first element takes a value of zero before time t and a value of one from time t onwards. These step dummies are endogenously identified by the modified ICSS algorithm, which allows common or independent shifts in the variances of the Iranian Gold and Foreign Exchange Markets (Ewing and Malik, 2013).
4- Empirical Results
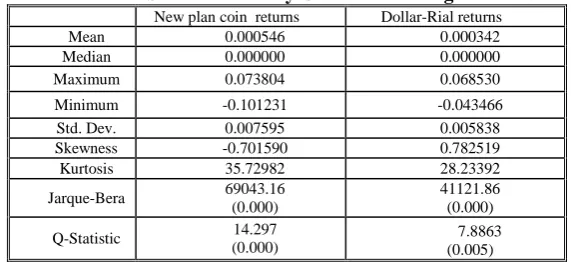
Table 1 summarizes the descriptive statistics of gold and exchange rate returns. The Ljung-Box Q-statistic calculated for the return series indicates the presence of significant dependencies in the returns of each two markets. The measures for skewness and kurtosis indicate that the distributions of returns for each two markets are skewed and leptokurtic relative to the normal distribution. The Jarque-Bera (JB) statistic rejects normality at any level of statistical significance for both the returns.
Table 1: Main Statistics of Daily Goldand Exchange Rate Returns
Dollar-Rial returns New plan coin returns
0.000342 0.000546
Mean
0.000000 0.000000
Median
0.068530 0.073804
Maximum
-0.043466 -0.101231
Minimum
0.005838 0.007595
Std. Dev.
0.782519 -0.701590
Skewness
28.23392 35.72982
Kurtosis
41121.86 (0.000) 69043.16
(0.000) Jarque-Bera
7.8863 (0.005) 14.297
(0.000) Q-Statistic
Source: Research findings (computed using Eviews 7.0)
Similar to many financial series, Iranian gold and exchange rate return series show a high degree of kurtosis. So, to detect possible changes in variance, we use AIT test statistic that modifies the IT test proposed by Inclan and Tiao (1994) and is appropriate for the case where the normality assumption does not hold.
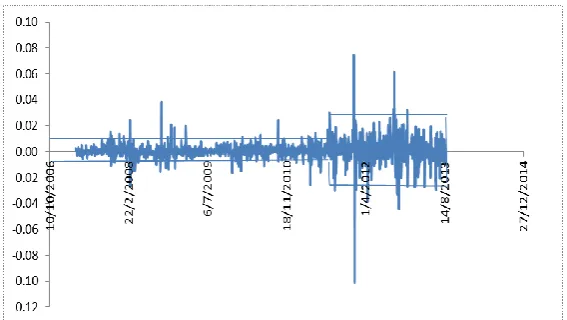
changes in volatility as identified by the adjusted ICSS algorithm. The gold return series evidence one structural change points, corresponding to two distinct volatility regimes and, the US Dollar/Rial return series evidence two structural change points, corresponding to three distinct volatility regimes.
Fig 1: Daily New Plan Coin Returns and Detected Change Points Estimated Using modified ICSS algorithm.
According to Fig. 1, Fig. 2 and table 2, the structural changes obtained are not common to gold and foreign exchange markets. Specifically, the date of structural change occurred in gold market is 2011/08/03; while variance break dates detected for foreign exchange market are on 2010/09/04 and 2011/04/23.
Table 2: Detected Number of Breaks in Variance with Sanso et al. (2004) Methodology
Markets Number of Break Points Change Dates
Gold Market 1 03/08/2011
Foreign Exchange Market 2 20/09/2010
08/05/2011 Source: Research findings (Estimated using GAUSS 9.0)
Table 3: Bivariate GARCH– BEKK Model Without and with Structural Changes in Variance
Coefficient Without dummies (P-value) With dummies (P-value)
c11 0.0076(0.1136) 4.1323e-003(0.0000)
c21 0.0030(0.3941) 9.4435e-004(0.0109)
c22 0.0050(0.0685) 9.6899e-004(0.0392)
a11 0.2236(0.1092) 0.9915(0.0000)
a12 0.06329(0.3614) 0.0857(0.0948)
a21 0.05337(0.7912) 0.3092 (0.1479)
a22 0.2236(0.10045) 2.2340 (0.0000)
b11 0.8660(0.0000) 0.8990(0.0000)
b12 -0.03509(0.5177) -0.0401(0.0011)
b21 0.03031(0.5471) -0.0758(0.0611)
b22 0.8660(0.0000) 0.7562(0.0000)
Source: Research findings (Estimated using RATS 8.30)
The estimated parameters of matrices A and B with associated p-values (parenthesis), both with and without considerations of changes in variance, are reported in Table 3.
The diagonal elements in matrix A capture their own ARCH effect, whereas the diagonal elements in matrix B measure their own GARCH effect. In the case of the bivariate GARCH–BEKK model with dummies, the diagonal parameters (a11, a22 and b11, b22) are statistically significant, thereby
implying that their own past shocks and volatility affect conditional variance in the Iranian gold and foreign exchange markets. However, in the case of the model without dummies, the insignificant diagonal parameters a11 anda22
GARCH(1,1) model is not appropriate for estimations of the conditional variance.
The off-diagonal elements a12 and a21 of matrix A capture cross-market
effects such that shocks occurring in one market influence the volatility of another market. When ignoring structural change dummies, we find no impact between two markets owing to the insignificance of the parameters a12 and a21. It can be clearly appreciated that news regarding shocks on the
Iranian gold market does not significantly affect the volatility of the Iranian foreign exchange market, and vice versa. According to the results in the model with structural dummies, a12 is statistically significant at 10% level of
statistical significance. So, in this case shock transmission is only unidirectional, from the gold market to the foreign exchange market.
The off-diagonal elements of matrix B (b12 and b21) measure volatility
spillover across the Iranian gold and foreign exchange markets. As is shown in Table 3, when we didn’t take into consideration the structural change dummiesb12 and b21 were statistically insignificant, respectively at 5% and
10% level of statistical significance, implying no spillover effect between these markets. Whereas, by taking into consideration the structural change dummies, the estimation results evidence the bidirectional causality between these markets owing to the significance of parameters b12 and b21 volatility
linkages from the gold to the foreign exchange market and vice versa. This finding indicates that when structural changes are not included in the volatility models, emerging bias in the given results may cause misinterpretations of the direction of shock transmission and volatility spillover between Iranian gold and foreign exchange markets.
5- Conclusion
It is well known that the volatility of asset prices is substantially affected by infrequent regime shifts in variance, corresponding to domestic, global economics, and political events. The popular approaches in capturing the volatilities in financial markets are generalized autoregressive conditional heteroscedasticity (GARCH) models. However, a shortcoming of this approach is that assume no shift in volatility occurs.
transmission and volatility spillover between Iranian gold and foreign exchange markets for the period 2007-2013.
We detected endogenously the time periods which structural breaks in volatility of these markets occurred using the modified version of the ICSS algorithm, developed by Sanso et al. (2004). Then, we incorporated this information into the volatility modeling.
According to the estimation results, when we ignored structural breaks in variance we didn’t find any linkage between these two important markets. But, by considering structural changes in modeling market volatility there was a bidirectional volatility spillover effect and a unidirectional shock transmission effect from the gold market to the foreign exchange market. Consequently, ignoring structural changes in variance might distort the direction of shock transmission and volatility spillover between Iranian gold and foreign exchange markets.
References
1- Arago V. & Fernandez M.A. (2007). Influence of Structural Changes in Transmission of Information between Stock Markets: A European Empirical Study, Journal of Multinational Financial Management, 17,112-124.
2- Baba, Y., Engle R.F., Kraft D.F. & Kroner K.F. (1991). Multivariate Simultaneous Generalized ARCH. Discussion paper 89-57, University of California, San Diego, Department of Economics.
3- Berndt, E., Hall B., Hall R.
&
Hausman J. (1974). Estimation and Inference in Nonlinear Structural Models. Annals of Economic and Social Measurement, 3, 653-665.4- Darrat, A.F.
&
Benkato O.M. (2003). Interdependence and Volatility Spillovers under Market Liberalization: The Case of Istanbul Stock Exchange, Journal of Business Finance and Accounting, 30, 1089–1114. 5- Engle, R.F., Kroner, K.F., 1995. Multivariate simultaneous generalized ARCH. Econometric Theory 11, 122–150.6- Ewing B.T.
&
Malik F. (2005). Re-examining the Asymmetric Predictability of Conditional Variances: The Role of Sudden Changes in Variance, Journal of Banking & Finance, 29, 2655-2673.8- Ewing B.T.
&
Malik F. (2013). Volatility Transmission between Gold and Oil Futures under Structural Breaks, International Review of Economics and Finance, 25, 113–121.9- Fleming J., Kirby C. & Ostdiek B. (1998). Information and Volatility Linkages in the Stock, Bond and Money Markets. Journal of Financial Economics, 49, 111–137.
10- Inclan C. & Tiao G.C. (1994). Use of Cumulative Sums of Squares for Retrospective Detection of Changes of Variance, Journal of the American Statistical Association, 89, 913-923.
11- Kang S.H., Cheong C. & Yoon S.M. (2011). Structural Changes and Volatility Transmission in Crude Oil Markets, Physica A, 390, 4317-4324. 12- Wang K.M.
&
Thi T.B. (2007). Testing for contagion Under Asymmetric Dynamics: Evidence from The Stock Markets between U.S. and Taiwan, Physica A, 376, 422-432.13- Kumar D. & Maheswaran S. (2012). Modeling Asymmetry and Persistence under the Impact of Sudden Changes in the Volatility of the Indian Stock Market, IIMB Management Review, 24, 123-136.
14- Poon S. H. & Granger C. W. J. (2003). Forecasting Volatility inFinancial Markets: A Review, Journal of Economic Literature, 41, 478-539.
15- Ross S.A. (1989). Information and Volatility: The No-Arbitrage Martingale Approach to Timingand Resolution Irrelevancy, Journal of Finance, 44, 1-17.
16- Sanso, A., Arago, V., Carrion, J.Ll. (2004). Testing for Changes in the Unconditional Variance of Financial Time Series. Revista de Economía Financiera, 4, 32–53.
17- Soriano, P., Climent, F. J. (2006). Volatility Transmission Models: A Survey, Revista de EconomíaFinanciera, 10, 32-81.