DESERT
DESERT Online at http://jdesert.ut.ac.ir
DESERT 17 (2012) 15-25
The Impacts of Different Kinds of Dust Storms in Hot and Dry
Climate, A Case Study in Sistan Region
A. Pahlavanravi
a*, A. Miri
a, H. Ahmadi
b, M.R. Ekhtesasi
ca
Faculty of Natural Resources, University of Zabol, Zabol, Iran
b
Islamic Azad University, Science and Research Branch, Tehran, Iran
c
Faculty of Natural Resources, University of Yazd, Yazd, Iran
Received: 12 June 2009; Received in revised form: 14 September 2010; Accepted: 22 January 2011
Abstract
Dust storms are catastrophic natural disasters that beside other disasters frequency occur in the arid and semiarid regions worldwide. Drought occurrence, climate aridity, dryness of the Hamoun Lake cause strong winds to below. These conditions have been prepared for dust storms in Sistan region. The damages to Sistan society have been measured using different criteria. The result shows that, peak of dust storms takes place at 10:30 am and the particular minimum was recorded at 6:30 pm. The maximal frequency of dust storms has been occurred in June and July. Since the dust storms cause extensive damages, an attempt has been made to quantify the damage costs using an analytical-descriptive method based on questionnaires completed by the local community and organizations. The cumulative losses in terms of physical damage and loss of productive man-hours have been estimated US$ 99.190 million, over a five year period between 2000-2005.
Keywords: Dust storm; Local community; Damage costs; Sistan
1. Introduction
Dust storms are a kind of severe natural disaster that frequently occurs in the arid and semiarid regions. These are the severest of the three different dust weather events (floating dust, blowing dust, and dust storm). Dust storms not only occur in the areas of dust origin, for the dust is also transported over large distances (Sun et al. 2001; Zhao and Zhao 2006). The wide availability of fine grained sediments, long summer drought periods, scarcity of vegetation cover and strong winds create favorable conditions for dust storms to take place in the Sistan region. Dust storms are the severest environmental problem in the area and thus have received increasing attention by the government and by the public.
Orlovsky and Orlovsky (2002) gave the general characteristics of frequency, distribution
Corresponding author. Tel.: +98 542 2232961,
Fax: +98 542 2226765.
E-mail address:[email protected]
and seasonality of dust storms in Central Asia. This research dealt more with the so-called ‘‘white’’ dust storms-dust storms originating from the exposed and dried bottom of the Aral Sea. Dust and salt raising sources, transportation routes, places of salty dust fall, and ecological consequences of salt and dust transfer and deposits are reviewed.
Orlovsky and Orlovsky (2005) showed that the Karakum Desert and western regions of Turkmenistan are some of the most active sources of dust storms in Asia. The maximum frequency of dust storms in most plain areas of Turkmenistan occurs in spring and summer with additional activity being experienced in winter or autumn in mountainous regions.
Pahlavanravi et al. / DESERT 17 (2012) 15-25
٢
morning to midday occupy only 34.6% of the total frequency.
In Mexico City, the most frequent cases of sand storms took place in March (that normally receives less than 13 mm of rainfall in three months) and minimum frequency took place in September (Jauregui 1989).
A prolonged storm that raged for 31 hours on May 5th 1993, in northwest China, reported
damages to economic incomes as follows: 1) Destruction of more than 373000 hectares of cultivated land and 16300 hectares of orchards and gardens. The storms eroded an average 10 cm from the surface soil in most areas and more than 50 cm in some areas.
2) Blackouts due to fallen electric poles and destruction of electrical infrastructure exceeded US$ 10 million and affecting more than 83 million populations.
3) More than 4412 houses were destroyed or buried by sands.
4) 85 people were dead, 31 people were lost and 246 injured. Of the livestock, 120000 were dead and more than 730000 missing.
5) More than 1,000 km of irrigation channels was buried by sand accumulation.
6) The Lanzhou-Xinjiang Railway line was interrupted for 31 hours and the Wuhai-Jilantai Special Railway Line in Inner Mongolia was stopped for 4 days. About 37 freight trains were stopped or delayed. Approximately 28,000 tons of industry-use salt and nitre was blown away in Inner Mongolia, 4,412 houses were buried and numerous sheds and stalls for breeding animals collapsed. It is estimated that 560 million RMB Yuan (about USD $70 million) was lost.
Further assessment revealed that 11.5% of the total land area in China is threatened by dust storms. Data collected from 72 states and cities of China, comprising a population of 12 million, showed that dust storms had taken 85 lives and injured 246 people. In addition, 100 of the 1000 livestock in the area were dead. Hundred of thousands of hectares of arable land, orchards and greenhouses were devastated. Highways, railways, and power generation plants were also destroyed.
A survey in New Mexico by Piper and Huszar (1989), showed that external-regional erosion was 50 times the internal-regional erosion. 90-95% of the evaluated damage costs related to home clean up expenditure. The highest assessed damage costs were in regions that had the highest frequency of dust storms and air pollution.
In South Australia, damages from wind erosion included community health, flights, roads and road accidents. The highest costs involved health, and the lowest was related to flight canceling.
At the midday of 24th of May 1997 , most of southern parts of South Australia was covered by a dust storm. Some of the immediate effects were: traffic accidents, power failures, as distribution lines were destroyed, closure of airports and diversion of planes, closure of roads and railways, loss of soil fertility, distress to asthmatics. During recent years it has become increasingly apparent that desert dust has an important role in the global system. There have been major advances in our understanding of transport ways and their enormous impacts both on humans and the environment, their global distinction and sources, their frequency at different time scales, and the reasons why their frequencies have varied. The purpose of this paper is to review some of the latest work that has been undertaken on these themes, to highlight areas of uncertainty and to consider some of the research priorities for the future (Goudie, 2008).
To the best of our knowledge, no report has as yet been published on the impact of dust storm in Iran.
2. Materials and Methods
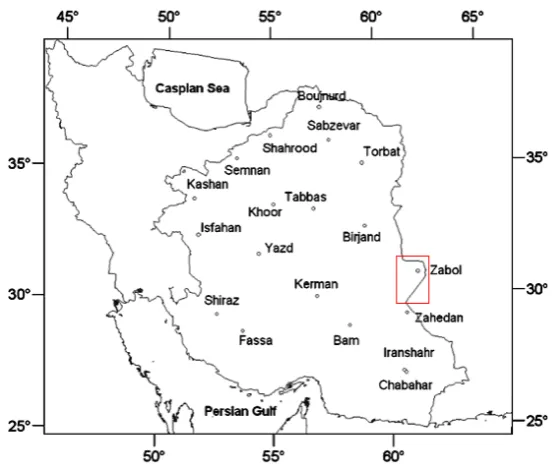
The Sistan region lies between 60°15′ E and 61°50′ E longitude, and 30°5′ N and 31°28′ N latitude; it is in the southeast part of Iran (Fig. 1). It covers an area of approximately 15,197 square kilometers and has a population of about 400,000. The Hamoun lake, shaped like a horseshoe, is located in north part of the region. Sistan has an arid and semi-arid climate. The aridity of the climate is manifested by very low precipitation (59 mm), low air humidity, low cloudiness, high evaporation rates (nearly 4820 mm), high annual temperature (22°C) and frequent droughts. The region is subject to severe winds; occasionally wind speeds reach 120 kilometers per hour. Land used changed from agricultural to waste land after the 1999 drought. It caused the Hamoun Lake to dry up and left much of the soil susceptible to erosion. A wide portion of the region is subject to soil erosion which in turn is a cause for dust storms. Figure 2 shows views of the Hamoun Lake before and after the drought.
Pahlavanravi et al. / DESERT 17 (2012) 15-25
٢
Fig. 1. The location of Sistan region is indicated by the red square
Fig. 2. Views of Hamoun Lake: (a) before the drought (b) after the drought
In Figure 3 the direction of dust storms direction is shown with arrows. The whole study area is represented with yellow color as
well as Zabol city limitation with a yellow colour cycle and some villages with green colour points.
Fig. 3. View of Zabol city, its surrounding villages; and dust storms direction
Pahlavanravi et al. / DESERT 17 (2012) 15-25
١
Data regarding dust storm and horizontal visibility were collected from the Zabol synoptic station. Data were recorded at 3, 6, 9, 12, 15, 18, 21 and 24 hours. Based on WMO1, a
dust storm is considered as a windy day in which the wind speed exceeds 15 ms-1 and the
visibility is reduced to less than 1000 metres (codes 30-35). Variation of daily dust stormslity for each hour was achieved based on a monthly average in June during 1999-2004 and the monthly variation were assessed at 10:30 am during 1999-2004. Furthermore, the annually variation during 1991-2003 were evaluated at 10:30 am in June.
Because of far distance of study area and distribution of statistical population affected, systematic-random based racemes methods were employed in this study.
In order to determine adequacy of sample size, Cochron formula (Cochron, 1975) was used that its application is for qualitative variables such as questionnaire method.
p
p t Nd P p Nt n 1 1 2 2 2
n= number of statistical samples, N= number of statistical society, t= coefficient of error, P= percent of success, d= estimation of accuracy
From 5 districts of Poshte Ab, Shibe Ab, Sharaki and Naroi, Markasi and Miankangi located in the study area, only 30 villages were selected and for each village 30 questionnaires (150 for each damage centre) were filled on the basis of available information such as household, area of agriculture lands, service and racemes model. Excel and SPSS software were used to analyze data and identify total amount of damages caused by dust storms and compare and generalize results to total statistical population.
3. Results, Discussion and Conclusion
3.1. Diurnal, monthly and yearly variation of dust storms
The results show that, the dust storms start at mid night and continue into the afternoon of the next day. They reach a peak at 10:30 am, and then gradually decrease and reach a minimum at 6:30 pm. The main factor stimulating this diurnal pattern of dust storms was diurnal variation in wind speed. The wind speed
1. World Meteological Organisation
maximum happened in the evenings and mornings, and its minimum in the afternoons. The maximum frequency of dust storms was registered in summer, particularly in June and July. The lack of cohesion of the soil particles, the limited amount of precipitation, rapid drying of the upper layer of the Hamuon Lake, lack of vegetation cover and high wind speeds (>25 m/s) are all factors increasing favorable conditions for dust storm formation in summertime.
The monthly average of dust storms was 12 days in June and 11 days in July, during the recorded period. Drought commencement in Sistan region in 1999 created suitable conditions to form dust storms. The average of annual of dust storms increased from an annual average of 10 days per year1990-1998 to the annual average of 54 days during 1999-2004 (Fig. 4). The maximum number of dust storm registered in 2001was 74 days.
3.2. Damage costs of Dust storms
As it is difficult to assess the entire damage caused by dust storms the assessment was limited to extent of damage due to blackouts, decline in the market economy, blocking of irrigation channels, agriculture, and roads, and flight cancellations. Additional damages caused by drought have not been included in the study. Damages caused by the dust storms are described in detail.
3.2. 1. Regional electricity net
a a) Damages of undistributed energy arising from electricity blackout by dust storms.
The amount of energy that is not distributed in the electricity net in each blackout is called undistributed energy. The dust storms caused blackouts in the main electricity net because of breaks in electrical poles wire. The results obtained from data analysis revealed that in the studied period, the highest electricity black outs and the undistributed energy were related to dust storms (Fig. 5).
The amount of undistributed energy arisen from dust storms was higher in Jun, July and August when higher dust storms took place.
The amount of undistributed energy has recently increased. The blackout rate has been enhanced because of drought and intensive dust storm occurrence after 1999. The greatest blackout took place in 2001 when the dust storm frequencies was maximum. Figure 6 shows the portion of undistributed energy in different months and years from dust storms
Pahlavanravi et al. / DESERT 17 (2012) 15-25
١
8 9 10 11 12 13 14 15
01:30 04:30 07:30 10:30 13:30 16:30 19:30 22:30
Local Time (h)
A
ver
a
g
e W
in
d
S
p
eed
(
m
/s
)
0 2 4 6 8 10 12 14
JAN FEB MAR Apr MAY JUNE JUL AUG SEP OCT NOV DEC
Month
M
ean
m
o
n
th
0 10 20 30 40 50 60 70 80
1990 1992 1994 1996 1998 2000 2002 2004
Years
N
u
m
b
er
o
f d
ays
Fig. 4. Diurnal, Monthly and annual variation of the dust storm data in Sistan region (Period 2000-2004)
0 10 20 30 40 50 60
dust storm repairmen energy deficiency miscellaneous issues
blakeout agents
%
blackouts
undistributed energy arisen
Fig. 5. The percentage of blackouts arisen from different factors and undistributed energy arisen from different blackout agents
Pahlavanravi et al. / DESERT 17 (2012) 15-25
٢
0 5 10 15 20 25 30 35 40
JAN FEB MAR Apr MAY JUNE JUL AUG SEP OCT NOV DEC
Month
%
0 5 10 15 20 25 30 35 40
1996 1997 1998 1999 2000 2001 2002 2003 2004
Year
%
Fig. 6. The portion of undistributed energy in different months and years from dust storms
Each kilowatt energy costs 30 cents. Therefore, the damage arising from each kw undistributed energy is equivalent of 30 cents.
The undistributed energies and the damages arisen from them are described in Table 3.
Table 1. A sample table for estimating damages caused by dust storms and resultant blackout in different sectors of service, industries caused in Sistan region
Type of damage Amount of damage in dollar per year
Blackout caused by dust storm in industrial sector
Blackout caused by dust storm in service and commercial sectors Blackout caused by dust storm in residential sector
Total
Table 2. A sample table for estimating damages to agricultural sector caused by dust storm in Sistan region
Type of damage Amount of damage in dollar per year
Seed falling, flower, crops losses
Sand invading agricultural lands and necessity of its evacuation Entering sand in wells, water resources, channels
Abandoned lands buried by sand Non- work days caused by dust storm
Table 3. The undistributed energies and the damages arise from them during 2000-2004.
Thus, the total damages during 2000-2004 exceeded US$ 48.2 million.
b) Damages to electricity installations.
Intensive dust storms caused the collapse of electricity poles, breakage of electricity cables, burnt transformers and electricity sings. Society
spends a lot of money for their repair and replacement. The damage varieties and their costs are shown in Table 4.
The total damages imposed to the electricity installations by dust storms during 2000-2004 was estimated US$ 696.125 million.
Damage rate(×1000 US$) Undistributed energy (kw) blackout as a result of dust storm
Year
2260 75600
2000
20670 689231
2001
7590 253155
2002
8900 296785
2003
8600 288899
2004
48200 1603670
Total
Pahlavanravi et al. / DESERT 17 (2012) 15-25
٢
Table 4. The damage varieties and their costs to electricity installations in Zabol region during 2000-2004.
Damage Variety Numbers Repairmen paid for each(×1000 US$) Total repairmen costs in five years (×1000 US$)
Extra fixation of turtle lights
per annum 9356 1 46780
Extra fixation of transformations, and painting
them once in four years. 1351 100 135100
Extra fixation and cleaning up
of electricity sings per annum 1151 15 86325
Extra fixation of customer electricity counters once in
five years
126666 3 379900
Total - - 648105
3.2.2. Irrigation channels
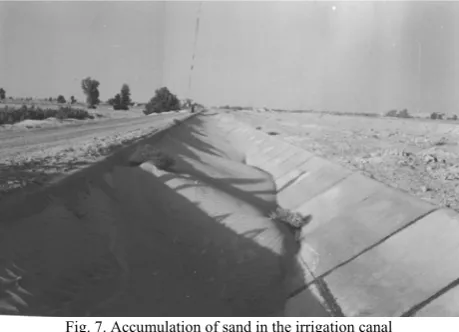
Plenty of sands annually enter into the irrigation channels. Accumulation of sands into the irrigation channels in some area is so much resulted in absolute interruption of flow of the
channel (Fig.7). The length of irrigation channels intensively exposed to sands is about 50 km. the society annually imposes lots of money to get raid of sands from the channels.
Fig. 7. Accumulation of sand in the irrigation canal
The expenditures required to remove 1 m3 sand from channels, streams and rivers is estimated to be 50 cents. The annual estimated damage is shown in Table 5.
Table 5. Accumulation of sands into irrigation channels
Annum The volume of gathered sands from the first and second grade
channels and streams, and Sistan river((×1000 m3) Damage rate(×1000 US$)
2000 1382.4 691.2
2001 1770.3 885.15
2002 1266 633
2003 1768.6 884.3
2004 1591.2 795.6
Total 7778.5 3889.25
The total damage to the society during 2000-2004 was estimated to be US$ 3.89925 million.
3.2.3. Flight cancellation:
Because of the geographical position of Zabol airport, located in north-east of the region, it is exposes to intensive dust storm attack. Dust particles arising from dust storms penetrate into electronic instruments existed in
the airport building. The particles disorder or occasionally devastate the instruments. The damages to the tools and instrument of Zabol airport during 2000-2004 arising from dust storms was estimated to be US$ 240000. Meanwhile, dust storms decreased horizontal visibility and caused flight cancellations. 22 flight cancellation were experienced during 2000-2004, as is shown in Table 6.
Pahlavanravi et al. / DESERT 17 (2012) 15-25
١
Table 6. The damage variety and rate arising from flight cancellation as a result of dust storms during 2000-2004. Damage variety Damages rate storms during 2000-2004 (×1000 US $)
Flight cancellation and the lost profits 57
Serving expenditures 3.5
No landing and return to departure (the expenses include, fuel price, pilot and crew salaries, passengers and crew food, airplane and passengers insurances and
soon) 48.24
The expenses of passenger fetching 10
Total 118.74
Therefore, the total damages to society as a result of flight cancellations during 2000-2004 exceeded US$ 0.358 million.
3.2.4. Market economic:
The influence of dust storms on market economic was assessed using 9000 questionnaires fulfilled by shopkeepers. The results of the analysed data of questionnaires revealed that 56% of shopkeepers closed their shops in dusty days, because of entrance of dusts into their shops, having no or low client, and respiratory problems. The rest shopkeepers (44%) open their shops. Thirty eighth percent of
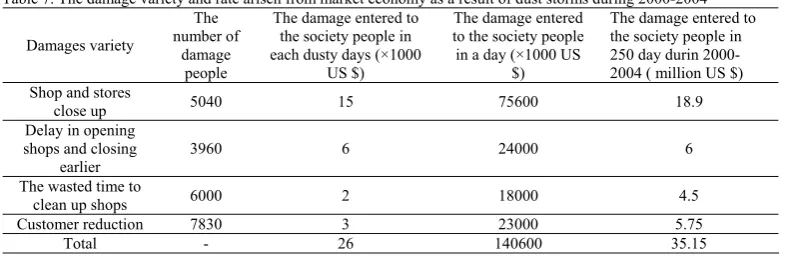
the latter group did postpone in opening their shops. They did delay 2 hours a day. In addition, the last group left their shops daily 2 hours earlier. All the shopkeepers believed that the dust storms decreased the worth output between 50 to 70 %. Furthermore, the shopkeepers spent daily 3-4 hours to clean up their shops that wasted approximately 40% of their times. Eighty seven percent of the shopkeepers believed that in the dusty days the number of their clients severely came down where they lost 40-60 % of their incomes. The damage varieties and their costs is shown in Table 7.
Table 7. The damage variety and rate arisen from market economy as a result of dust storms during 2000-2004 The damage entered to the society people in 250 day durin 2000-2004 ( million US $) The damage entered
to the society people in a day (×1000 US
$) The damage entered to
the society people in each dusty days (×1000
US $) The number of damage people Damages variety 18.9 75600 15 5040
Shop and stores close up
6 24000
6 3960
Delay in opening shops and closing
earlier
4.5 18000
2 6000
The wasted time to clean up shops
5.75 23000 3 7830 Customer reduction 35.15 140600 26 - Total
The total damage entered to the society in the centre of market economic was calculated more than US$ 35.15 million.
3.2.5. Clean-Up operations after storms in the residential areas
Dust particles shifted by dust storms and caused because substantial damages to residential areas. When wind blows, sand particles accumulate behind the house walls. Gradually sands mounds are built up there and consequently buries the houses. The situation is critical in the places directly in the path of the dust storm, as in Khoshdad and Khaleghda villages.
Thirteen villages, with 550 houses are located directly in the path of sand movement, and need intensive cleaning up after storms (Fig.8). During 2000-2004, 568 villages were invaded by flow sands. The volume of sands was calculated 1840 ton m3. The cost of
evacuating sand from residential areas is estimated to be 1.3-1.5 US$/m3. The total
estimated expenditures was US$ 3.13 million. Dust particles shifted by intensive dust storms result in the erosion of buildings, particularly those built in mud and adobe which is a highly prevalent building material in the region. Over a period of time many walls become thin and eventually fail. Hitherto 3600 houses have been damaged, of which 2520
Pahlavanravi et al. / DESERT 17 (2012) 15-25
٢
houses suffered 30-40% damages that meant that they needed to be rebuilt and 1080 houses needed repair and renovation. The rebuilt costs for each building was US$ 200 and the repair
costs for each building was US$ 10000. The total estimated expenditure for rebuilt and repair of the total build was US$ 7.776 million.
Fig. 8. Sand accumulation in a residential area
The total damage entered to the society in the centre of residential areas during 2000-2004 was exceeded US$ 10.789 million.
3.2.6. Agriculture:
Drought occurrence in the region caused that arable areas change to waste lands. As 120000 hectares of arable lands decreased to 1050 hectares. The cultivation using wells was experienced just in the areas where the underground water level was near to ground surface. The damages to agriculture products arisen from dust storms are as following: - Accumulation of dust particles on the plant foliage causes disorders in the photosynthesis resulted in the product reduction.
- Accumulation of dusts into agricultural lands lead to the buriness of the lands, and reduction of the land fertility.
- Soil erosion
- Destruction and buriness of wells and streams by sands
- Destruction of gardens and cultivations. The damages caused to agricultural section by dust storms in drought time were assessed using questionnaires filled in by well owners.
There were 9600 wells in the region. 90% of these well owners (8640 out of 9600) mentioned that their wells have been damaged by dust storms.
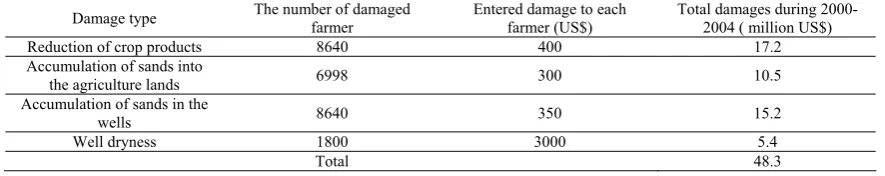
The area irrigated by each well ranged from 0.5 to 4 hectares, and the cultivated plants were wheat, barley and cucurbits. The entered damages crop plants and cucurbits were 20-40 % and 40-60 % respectively. Based on the results obtained from questionnaires, 80 % of farmers experienced accumulation of sand into their land and 64% of the farmers annually experienced US$ 300-600 to evacuate sand from their lands. All well owners (farmers) faced the deposition of dust and sand into their wells. 54% of them evacuated their wells once to five times per annum, 29% did it 5-10 times per annum and the rest (17%) 10-20 times per annum. The data analysis revealed that 56% of farmers spent US$ 300-500, 37% US$ 100-300 and 7% US$ 500-1000 to remove the accumulated dusts and sands from their wells. The damage variety and rate arising from dust storms during drought times is shown in Table 8.
Table 8. The damage type and rate to well owners during 2000-20004
Damage type The number of damaged farmer Entered damage to each farmer (US$) Total damages during 2000-2004 ( million US$)
Reduction of crop products 8640 400 17.2
Accumulation of sands into
the agriculture lands 6998 300 10.5
Accumulation of sands in the
wells 8640 350 15.2
Well dryness 1800 3000 5.4
Total 48.3
The total damage during 2000-2004 to farmer using wells was calculated to be US$ 48.3 million.
Dust storms were serious in the southwest part of Iran, particularly during 1999-2004. The
storms caused serious economic and ecological losses to Sistan people. The Sistan region has recently been one of the active sources of dust storms. The maximum frequency of dust storms occurs in spring and summer with additional
Pahlavanravi et al. / DESERT 17 (2012) 15-25
٢
activity being experienced in winter or autumn. A significant decrease in frequency of dust storms in Sistan region was observed in early 2001. The study results have provided decision-makers and governmental agencies with important scientific evidence for formulating policies and determining measures to control of dust storms and land desertification. These results set a substantial foundation for further studies on the issues in the future. The environmental situation in certain regions will gradually worsen if more effective efforts and approaches are not adopted as soon as possible. It is estimated that the occurrence and development of dust storms will be more frequent than in previous decades in the world’s dry land regions. Consequently, the possibility of intensive sand-dust storms will be crucial, the threat will be widened and issues that need to be studied will become more complicated. The
research on sand-dust storms is now facing challenges, and long-term efforts are required for future strategies.
The total damages arising from dust storms are a sum of the damages to different sections of the community. The current practice is to pay compensation costs to families and organizations.
However, in light of the fact that this catastrophic phenomenon is recurring with increasing frequency, it seems wiser to control it by combating desertification of the land, before it gets out of hand. In the final analysis, the costs of containing and preventing the disaster are much less than the tangible and intangible social costs in the aftermath of the storms.
The damage caused by dust storms in damage centers in Zabol region during 2000-2004 is shown in Table 9.
Table 9. Cumulative damage costs of dust storms in Zabol region during 2000-2004
Damage center Damage percentage (%) Damage Costs ( million US $)
Blackouts 0.69 0.694
Irrigation channels 3.93 3.899
Flight cancellation 0.37 0.358
Market economic 35.44 35.15
Sand aggregation in residential areas 10.87 10.789
Agriculture 48.7 48.3
Total 100 99.190
The total damage costs from dust storm during 2000-2004 in Zabol region were estimated at US$ 99.190 million. The highest costs involved agriculture, and the lowest was related to flight canceling.
As Hamoun lake is the origin of dusts in the studied region, creation of a green belt using native plants such as Tamarix, Atripelex, Haloxylon, Stipagrostis, Citrullus Colocynthis
and Eucalyptus on the Hamoun edge is
necessary. Fixation of sand dune using native plants, land management practices, better farming approaches and soil conservation programmes are another approach to control the dust storms
4. Acknowledgements
We would like to thank Dr Andrew S. Goudie and Dr. Ali Reza Moghadamnia for their constructive discussions.
References
Bahrami, A. and M. Jariyani, 2003. Haloxylon and its function in wind erosion control in Iran center. Haloxylon Conference, Kerman, Iran. pp. 64-65. Ekhtesasi, M.R. 2003. Determination of the minimum amount of concentration of Haloxylon to create
breaking wind and wind erosion control in Iran center. Haloxylon conference, Kerman, Iran. pp. 2-3. Goudie A.S. 2008. Dust storms: Resent developments. Journal of Environmental Management 90 (2009) 89– 94
Huszar, P.C. and S.L. Piper, 1989. Estimating the off- site costs wind erosion in New Mexico. J. soil wat. conserv. 41(6): 414-416.
Iranmanesh, F., M. Arabkhedri and M. Akram, 2005. Investigation of dust origins and characteristics of their spreading in Sistan’s storms, Iran region,. J. Research Construct. in Natural. Resource.. 67: 25-33. Jauregui, E. 1989. The dust storms of Mexico City. Inter. J. Climatol. 9 (2): 169-180.
Orlovsky, N. and L. Orlovsky, 2002. White sand storms in Central Asia. In: Yang Youlin, Squires, V., Lu Qi (Eds.), Global Alarm: Dust and Sand Storms from the World’s Dry lands. UNCCD, Bangkok. p.p. 169–201. Orlovsky, N.S. and A. Durdyev, 2005. Dust storms in Turkmenistan. JAE. 60: 83-97
Safarnejad, A 2005. Comparison of saxaoul species (Haloxylon spp) for its improvement and expansion in desert areas,. J. Res. Construc. in Natur. Resourc. 67: 51-57.
Sun, J. Zhang, M. and T. Liu, 2001. Spatial and temporal characteristics of dust storms in China and its surrounding regions, 1960–1999: relations to source area and climate. J.Geophysic. Res.—Atmospheres. 106 (D10). PP. 10325–10333.
UNITED NATIONS, UNNCD, Global Alarms. 2001. Dust and sand storms from the world's dry land. Wang, S. Yang, D. Y, Zhou. et al. 1995. Analysis on the
Formative Causes of Sand-dust Storms in the
Pahlavanravi et al. / DESERT 17 (2012) 15-25
٢
Northwest China during 3-12 April 1994. J. Des. Res. 15 (4): 332-338.
Williams, P. and M.Young, 1999. How much dose wind erosion cost the people of South Australia. Policy and Economic research unit CSIRO land and water. Zehtabian, G.R. Azarnivand, H. Jafari, M. Nazeri, K. and H. Esmaeelzaede, 2006. The effect of Haloxylon Aphyllum and Calligonum Commosum stabilization
and rehabilitation of sand dune (case study: Reza- Abad, Semnan province, Iran). J. Des. 11(1): 167- 175.
Zhao, L. S. Zhao, 2006. Diagnosis and simulation of a rapidly developing cyclone related to a severe dust storm in East Asia. Global and Planetary Change. 52: 105–120.