PHYSIOLOGY
In-Season Evaluation of Subsurface Drip and Nitrogen-Application Method
for Supplying Nitrogen and Water to Cotton
Philip J. Bauer,* Patrick G. Hunt, and Carl R. Camp
INTERPRETIVE SUMMARY
Drip irrigation systems can precisely apply water to crops at low pressure and, thus, save water and energy, compared to other irrigation systems. The main problem with drip irrigation is the sometimes prohibitively high annual installation costs of traditional drip systems. Two potential ways to reduce these investment costs are keeping the system intact for many years by burying it so the components do not need annual replacement and reducing the initial investment in tubing by placing tubing between two rows so that one lateral supplies water to both rows.
With drip irrigation systems, multiple applications of small amounts of N can also be made. Thus, this technology can be used to supply N fertilizer to crops on an as-needed basis. This may improve N efficiency and reduce the problem of residual fertilizer N getting into ground and surface waters.
We conducted a 4-yr study to investigate the effect on cotton of subsurface drip irrigation lateral placement and N-application method. Drip laterals were buried 1 ft below the surface, either under every row or in alternate mid-rows. Three N treatments were evaluated. They were (i) 100 lb N/acre applied at one time near first square; (ii) 100 lb N/acre applied in 5 weekly increments (20 lb N/wk) beginning near first square; and (iii) 10 to 20 lb N/acre applications when GOSSYM-COMAX predicted that N stress would occur before the end of the season. The Clemson University Extension recommended amount of N for irrigated cotton is
100 to 120 lb N/acre in South Carolina. All N, except for 10 lb N/acre broadcast applied before planting, was applied through the drip system. We monitored the water and N status (leaf blade N and petiole nitrate nitrogen) of the cotton through each season to determine if alternate mid-row placement was as effective as in-row placement and to measure the effectiveness of applying N on an as-needed basis.
Neither lateral placement nor N application method had an effect on yield in any year of the study. Water status of the cotton did not differ between in-row and alternate mid-row lateral placement at any measurement time during the 4 years of the study. The N status of cotton grown with alternate mid-row placement was, at times, slightly lower than cotton grown with in-row placement. This was generally seen early in the season when the plants were small. However, at no time was the cotton in any treatment deficient in N.
The cotton that was provided N based on GOSSYM-COMAX predictions received a total of 80 lb N/acre each year while the other two N treatments received 110 lb N/acre. Occasionally, the cotton receiving N based on GOSSYM-COMAX had lower leaf and petiole N status than the cotton grown with the other two N application methods, but N levels were sufficient through all 4 years.
The results of this study indicate that for subsurface irrigation systems, alternate mid-row placement of laterals is effective in supplying water and N to cotton. We also found significant N savings below the state-recommended amount when we applied the fertilizer on an as-needed basis.
ABSTRACT
Drip irrigation and computer simulation growth models are potential tools for improving water and N-application strategies to cotton (Gossypium hirsutum
L.) in the southeastern USA. Our objectives were to
USDA-ARS Coastal Plains Soil, Water, and Plant Res. Ctr. 2611 West Lucas Street, Florence, SC, 29501-1241. Received 3 1 J u l y 1 9 9 7 . * C o r r e s p o n d i n g a u t h o r ([email protected]).
determine the effect of subsurface-drip lateral spacing on plant water status and determine the effect of crop rotation, lateral spacing, and N-application method on plant N status. Soil type was Eunola loamy sand (fine-loamy, siliceous, thermic Aquic Hapludult), and the experiment was conducted from 1991 through 1994. Treatments were rotation [continuous cotton vs. cotton rotated with peanut (Arachis hypogaea L.)], water management [laterals buried 0.3 m below each row (1-m spacing), laterals buried 0.3 m deep in alternate mid-rows (2-m spacing), or none (rainfed)], and sidedress-N scheduling application method [112
kg N ha-1 at one time (standard), five weekly
applications of 22.4 kg N ha-1 (incremental), or 11.2 or
22.4 kg N ha-1 applied when the GOSSYM-COMAX
simulation model output predicted N stress]. The N application treatments were applied at or shortly after first square each year. The total amount of N applied
for the GOSSYM-COMAX treatment was 67 kg ha-1
each year. On cloudless days, leaf water potential was measured in all three irrigation treatments of the continuous cotton receiving the standard N application. Leaf petiole NO3–N and leaf blade N were determined weekly in all treatment combinations. Leaf water potentials did not differ between the 1-m and the 2-m lateral spacing in any year. Rainfed cotton had water potentials as much as 0.49 MPa lower than irrigated cotton. At early sampling dates in 2 of the 4 years of the study, leaf petiole NO3–N was lower for
cotton grown with the 2-m lateral spacing than for the cotton grown with the laterals spaced 1 m apart. Cotton in the 2-m lateral spacing treatment had lower leaf blade N content at early sampling dates in 3 years of the study. In 1994, the GOSSYM-COMAX method generally had lower leaf N concentrations than the other two N application methods. The results suggest that a lateral spacing wider than 1-m placement is adequate for supplying both water and N to cotton on these soils and that N management can be improved by using simulation models for predicting N-fertilizer needs.
I
nterest in drip irrigation for cotton is increasing because of its capacity to apply small amounts of water at low pressure. Drip systems are more efficient in the use of water and consume less energy than other irrigation systems. At peak flowering (the time of peak water consumption by a cotton crop), cotton in the southeastern USA can use up to 6.6 mm of water per day (Thomas, 1987). This amount can readily be replaced by daily trickle applications.One deterrent to drip use is the high cost of installation. Several studies have been conducted to reduce materials cost so that the systems are more economically feasible. Camp et al. (1993) evaluated
surface drip placement for three cotton cultivars in the southeastern USA. They concluded that alternate mid-row placement was as effective as in-row placement when drip laterals are placed on the soil surface. Bucks et al. (1988) and French et al. (1985) reported that wider spacing of drip laterals than in-row placement was adequate for cotton production in Arizona. Burying of the drip systems so they can be reused for several years reduces labor and materials cost by eliminating annual removal and installation of the systems.
Besides water, drip irrigation can be used to p r e c i s e l y a p p l y s o m e a g r i c h e m i c a l s . Over-application of fertilizer N is widely criticized as an environmental pollutant; yet optimal production requires that adequate amounts of this nutrient must be available to the crop when N demand is high. The optimal N rate for irrigated cotton depends on several interacting factors. Soil type, precipitation (especially excess), temperature, sunlight, length of season, and insect and disease pressures all influence yield potential and determine the optimal N rate for a given field and season. In addition, the amount of residual soil N, especially if cotton is rotated with a legume, affects optimal fertilizer N rate. Current practices are to apply most or all of the N fertilizer before the crop demand for N becomes high [about 8 wks after planting (Mullins and Burmester, 1990)] to ensure that adequate soil N is available. However, unforeseen yield-reducing events after the application can limit the ability of the crop to assimilate N. Using a simulation model to predict N stress in combination with trickle technology to apply N as crop demand dictates could increase the efficiency of the N fertilizer and reduce potential environmental contamination.
Plant tissue analysis provides an indication of the N status of a growing crop. Two diagnostic tools often used in cotton are measuring the leaf blade N content and the petiole NO3–N content of the
youngest fully expanded leaf on the main stem of the plant. For leaf blade N, concentrations below 35 mg kg-1 during the squaring and early fruiting period are
considered deficient (Roof et al., 1994), and a supplemental N application is generally recommended. Since petiole NO3–N levels naturally
decline as the boll load increases and N is diverted from vegetative growth to reproductive structures, recommended deficiency and excess levels of petiole NO3–N decline as the crop growth stage advances
et al. (1989) reported that cotton was deficient in N when petiole NO3–N levels were <9.0 g kg
-1 at first
bloom.
Measurements of cotton responses to drip irrigation in the southeastern USA are rare; and additional data are needed to maximize the efficiency of subsurface drip irrigation systems as delivery systems for water and N in cotton production. The objectives of this research were to (i) determine subsurface drip lateral spacing on cotton plant water potential and (ii) evaluate crop rotation, buried drip lateral spacing, and the use of a growth simulation model to prescribe fertilizer N application on plant N status.
MATERIALS AND METHODS
The study was conducted from 1991 through 1994 on a Eunola loamy sand soil at Clemson University's Pee Dee Research and Education Center near Florence, SC. The experimental design was a randomized complete block in split-plot arrangement. Main plots were crop rotation (continuous cotton vs. cotton following peanut). The subplots were combinations of irrigation and nitrogen treatments. The irrigation treatments were subsurface drip laterals under every row (1-m spacing) or subsurface drip laterals in the center of alternate mid-rows (2-m spacing). A description of the buried system was presented previously (Camp et al., 1997). Three N treatments were evaluated for each subsurface drip lateral spacing. The standard N treatment consisted of supplying all of the sidedress N (112 kg ha-1) for the season within 7 d. The
incremental (INC) treatment consisted of making five weekly applications of 22.4 kg N ha-1, beginning
when the standard application was made. For the third N treatment, we used GOSSYM-COMAX (Baker et al., 1983; Lemmon, 1986) to make simulations and then applied either 11.2 or 22.4 kg N ha-1 when the model predicted that N stress would
occur. The first simulations coincided with the timing for the standard N application each year. The model was run three times per week through the remainder of each season. Within each main plot, two rainfed check treatments were included. Nitrogen treatments in those plots were standard and GOSSYM-COMAX. Dates of all N applications to the cotton in the 4 years of this experiment are shown in Table 1. Subplot size was eight 0.96-m-wide by 13.7-m-long rows. The experiment
had four replicates. A weather station located near the field recorded daily maximum and minimum temperatures and daily rainfall amounts. Daily heat units were calculated as (maximum temperature + minimum temperature/2) - 15.6EC.
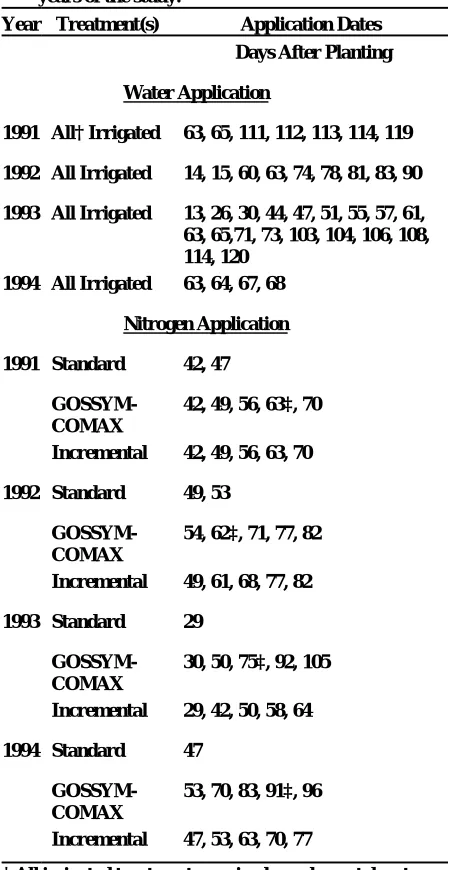
In the cotton following peanut main plots, peanut was planted in 1991 and 1993 and cotton was planted in 1992 and 1994. All N applications were made through drip irrigation laterals, and laterals Table 1. Water and N-application dates during the four
years of the study.
Year Treatment(s) Application Dates
Days After Planting
Water Application
1991 All† Irrigated 63, 65, 111, 112, 113, 114, 119
1992 All Irrigated 14, 15, 60, 63, 74, 78, 81, 83, 90
1993 All Irrigated 13, 26, 30, 44, 47, 51, 55, 57, 61, 63, 65,71, 73, 103, 104, 106, 108, 114, 120
1994 All Irrigated 63, 64, 67, 68
Nitrogen Application
1991 Standard 42, 47
GOSSYM-COMAX
42, 49, 56, 63‡, 70
Incremental 42, 49, 56, 63, 70
1992 Standard 49, 53
GOSSYM-COMAX
54, 62‡, 71, 77, 82
Incremental 49, 61, 68, 77, 82
1993 Standard 29
GOSSYM-COMAX
30, 50, 75‡, 92, 105
Incremental 29, 42, 50, 58, 64
1994 Standard 47
GOSSYM-COMAX
53, 70, 83, 91‡, 96
Incremental 47, 53, 63, 70, 77
† All irrigated treatments received supplemental water on these dates. Amounts were generally 6 mm, but some were 12 mm.
‡ All GOSSYM-COMAX N applications were 11.2 kg N ha-1 except those marked with ‡, when 22.4 kg N ha-1
were placed on the surface next to the row in the rainfed checks for this purpose. All N was applied with 6 mm of water.
Each spring, lime and plant nutrients (containing 12.5 kg N ha-1) were broadcast applied prior to
planting according to soil test results and recommendations by the Clemson University Extension Service. The entire experimental area was disked and harrowed. The rainfed plots were in-row subsoiled to a depth of 0.35 m just prior to planting to simulate normal cotton production practices on Coastal Plain soils. Cotton ('Pee Dee 3') was seeded on 22 May 1991, 14 May 1992, 12 May 1993, and 19 May 1994. About 14 d after emergence, plots were hand-thinned to a uniform population of 85 000 plants ha-1. At that time, tensiometers were placed in
both the 1-m lateral spacing and the 2-m lateral spacing treatments where N was managed with GOSSYM-COMAX. Tensiometers were placed in the cotton row to measure soil matric potential at a depth of 0.3 m. Irrigation was applied when average soil water potential was less than -0.035 MPa. Application amounts were generally 6 mm, but 12 mm was applied on several dates. Dates of water application are given in Table 1. Pests were controlled using standard practices.
Lateral spacing effect on plant water status was assessed by measuring leaf water potential in the continuous cotton that received the standard N treatment. Data were collected in all three water management treatments (1-m lateral spacing, 2-m
lateral spacing, and rainfed). On cloud-free days, a pressure bomb was used to determine midday leaf water potentials of uppermost fully-expanded leaves. Measurements were made between 1230 and 1330 EDT on two leaves in each plot.
Eight to 10 uppermost fully expanded cotton leaves were collected from an interior row in all treatment combinations at weekly intervals from mid to late June through August each year. The petioles were separated from the leaf blades, and petioles and blades were dried and ground separately. Nitrate–N in the petioles was determined with an ion-specific electrode after extraction with Al2(SO4)3 solution
(Baker and Thompson, 1992). Leaf blade tissue was digested with H2SO4, and total N was determined in
the sample digests with a Technicon Autoanalyzer II Continuous Flow System1 (Technicon Industrial
Systems, Tarrytown, NY).
All data were subjected to analysis of variance (ANOVA) at each data collection date. For the leaf blade N and petiole NO3–N data in 1992 and 1994,
values are averaged over both continuous cotton and cotton following peanut treatments because rotation did not have a significant (P = 0.05) effect on either parameter. Single degree-of-freedom contrasts were computed to determine if irrigated differed from rainfed cotton and if the cotton grown with trickle buried in the 1-m spacing differed from the cotton
1Mention of a tradename is for information only and does not
constitute an endorsement from the USDA.
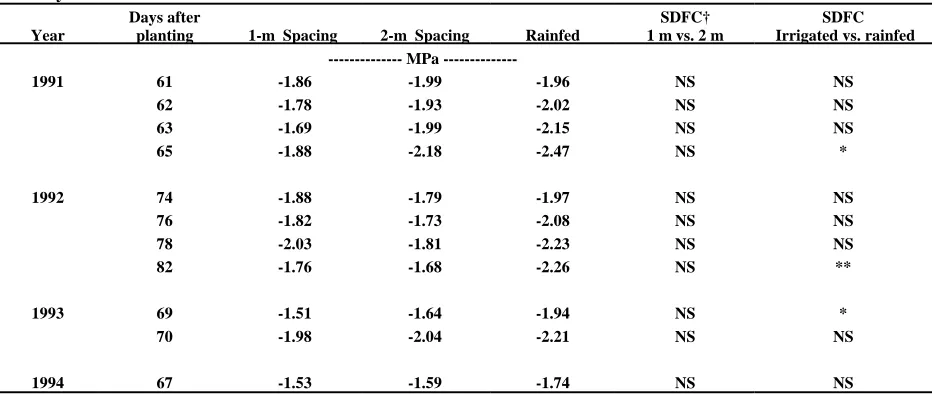
Table 2. Effect of irrigation lateral spacing on uppermost fully-expanded leaf water potential at selected dates in 1991, 1992, 1993, and 1994 at Florence, SC. Data are from the plots that were fertilized with 112 kg N ha-1 at prebloom
only.
Year
Days after
planting 1-m Spacing 2-m Spacing Rainfed
SDFC† 1 m vs. 2 m
SDFC Irrigated vs. rainfed MPa
---1991 61 -1.86 -1.99 -1.96 NS NS
62 -1.78 -1.93 -2.02 NS NS
63 -1.69 -1.99 -2.15 NS NS
65 -1.88 -2.18 -2.47 NS *
1992 74 -1.88 -1.79 -1.97 NS NS
76 -1.82 -1.73 -2.08 NS NS
78 -2.03 -1.81 -2.23 NS NS
82 -1.76 -1.68 -2.26 NS **
1993 69 -1.51 -1.64 -1.94 NS *
70 -1.98 -2.04 -2.21 NS NS
1994 67 -1.53 -1.59 -1.74 NS NS
grown with trickle in 2-m spacing in water potential, leaf N, and petiole NO3–N. The leaf N and petiole
NO3–N differences between the GOSSYM-COMAX
treatment and the other two N treatments were determined with single degree-of-freedom contrasts.
RESULTS AND DISCUSSION
Camp et al. (1997) provide an in-depth discussion of the yield results from this study. In brief, neither lateral placement nor N application had an effect on yield in any year of the study. Supplemental irrigation did not increase cotton lint
yield in either 1991 (mean yield of 1660 kg lint ha-1)
or 1994 (mean yield of 1460 kg lint ha-1). In 1992,
supplemental irrigation resulted in 19% higher yield, compared to rainfed (605 vs. 520 kg lint ha-1).
Irrigated cotton lint yield was 62% higher than rainfed in 1993 (1210 vs. 745 kg ha-1 for the
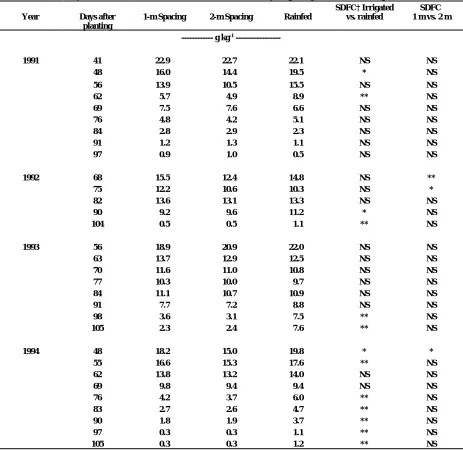
irrigated and rainfed treatments, respectively). Yield differences between years for the irrigated cotton were highly correlated with early season chilling stress. During the first 20 d after planting, nighttime lows of <15.6E C occurred only five times in 1991 when yields were greatest; lows were <15.6E C eight Table 3. Petiole NO3-N concentration of cotton leaves as influenced by drip irrigation and lateral placement treatment.
Year Days after planting
1-m Spacing 2-m Spacing Rainfed
SDFC† Irrigated vs. rainfed
SDFC 1 m vs. 2 m
--- g kg-1
---1991 41 22.9 22.7 22.1 NS NS
48 16.0 14.4 19.5 * NS
56 13.9 10.5 15.5 NS NS
62 5.7 4.9 8.9 ** NS
69 7.5 7.6 6.6 NS NS
76 4.8 4.2 5.1 NS NS
84 2.8 2.9 2.3 NS NS
91 1.2 1.3 1.1 NS NS
97 0.9 1.0 0.5 NS NS
1992 68 15.5 12.4 14.8 NS **
75 12.2 10.6 10.3 NS *
82 13.6 13.1 13.3 NS NS
90 9.2 9.6 11.2 * NS
104 0.5 0.5 1.1 ** NS
1993 56 18.9 20.9 22.0 NS NS
63 13.7 12.9 12.5 NS NS
70 11.6 11.0 10.8 NS NS
77 10.3 10.0 9.7 NS NS
84 11.1 10.7 10.9 NS NS
91 7.7 7.2 8.8 NS NS
98 3.6 3.1 7.5 ** NS
105 2.3 2.4 7.6 ** NS
1994 48 18.2 15.0 19.8 * *
55 16.6 15.3 17.6 ** NS
62 13.8 13.2 14.0 NS NS
69 9.8 9.4 9.4 NS NS
76 4.2 3.7 6.0 ** NS
83 2.7 2.6 4.7 ** NS
90 1.8 1.9 3.7 ** NS
97 0.3 0.3 1.1 ** NS
105 0.3 0.3 1.2 ** NS
times in 1994, 11 times in 1993, and 18 times in 1992 (Camp et al., 1997).
Leaf water potential did not differ between the 1- and 2-m lateral spacings at any time (Table 2). In 1991, water-deficit stress developed in the rainfed treatments in late July, and leaf water potential fell 0.51 MPa from 22 July (61 d after planting) to 26 July (65 d after planting). Water applications made at 63 and 65 d after planting held leaf water potential of plants in both the 1- and 2-m lateral spacing treatments relatively constant. In 1992, water applications at 74, 78, and 81 d after planting kept leaf water potential of the irrigated cotton
relatively constant while the leaf water potential in the rainfed cotton fell from -1.97 MPa on 27 July (74 d after planting) to -2.26 MPa on 4 August (82 d after planting, 2). In 1993 irrigation was applied at 65 d after planting, and the irrigated cotton still had higher water potential at 69 d after planting but not at 70 d after planting (Table 2). Few water applications were made in 1994. As in the other 3 years, the irrigation lateral placement treatments did not differ in leaf water potential as water-deficit stress was developing at 67 d after planting.
Rainfed cotton had higher petiole NO3–N and/or
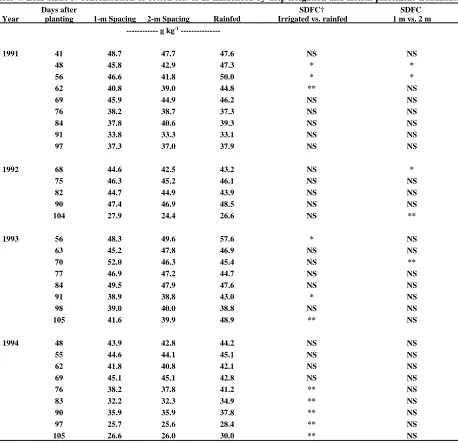
leaf blade N than irrigated cotton at various Table 4. Leaf blade N concentration of cotton leaves as influenced by drip irrigation and lateral placement treatment.
Year
Days after
planting 1-m Spacing 2-m Spacing Rainfed
SDFC† Irrigated vs. rainfed
SDFC 1 m vs. 2 m --- g kg-1
---1991 41 48.7 47.7 47.6 NS NS
48 45.8 42.9 47.3 * *
56 46.6 41.8 50.0 * *
62 40.8 39.0 44.8 ** NS
69 45.9 44.9 46.2 NS NS
76 38.2 38.7 37.3 NS NS
84 37.8 40.6 39.3 NS NS
91 33.8 33.3 33.1 NS NS
97 37.3 37.0 37.9 NS NS
1992 68 44.6 42.5 43.2 NS *
75 46.3 45.2 46.1 NS NS
82 44.7 44.9 43.9 NS NS
90 47.4 46.9 48.5 NS NS
104 27.9 24.4 26.6 NS **
1993 56 48.3 49.6 57.6 * NS
63 45.2 47.8 46.9 NS NS
70 52.0 46.3 45.4 NS **
77 46.9 47.2 44.7 NS NS
84 49.5 47.9 47.6 NS NS
91 38.9 38.8 43.0 * NS
98 39.0 40.0 38.8 NS NS
105 41.6 39.9 48.9 ** NS
1994 48 43.9 42.8 44.2 NS NS
55 44.6 44.1 45.1 NS NS
62 41.8 40.8 42.1 NS NS
69 45.1 45.1 42.8 NS NS
76 38.2 37.8 41.2 ** NS
83 32.2 32.3 34.9 ** NS
90 35.9 35.9 37.8 ** NS
97 25.7 25.6 28.4 ** NS
105 26.6 26.0 30.0 ** NS
sampling dates [ i.e., early in 1991, late in 1992, early and late in 1993, and generally throughout the season in 1994 (Tables 3 and 4)]. The higher petiole NO3–N levels for the rainfed cotton at the early
sampling dates in these years can be attributed, perhaps, to the N in those plots being surface applied and thus available to the roots near the soil surface. Late-season differences between irrigated and rainfed cotton were generally small.
Differences in the N of the uppermost fully expanded leaves at 91, 98, and 105 d after planting in 1993 (Tables 3 and 4) were likely because of the higher boll load in the irrigated cotton that year.
Bolls are stronger sinks for N than are vegetative tissues. The higher leaf N and petiole NO3–N levels
for the irrigated cotton in 1993 suggest that the irrigated cotton was approaching cutout (cessation of vegetative growth) earlier than the rainfed. Since cotton yields were the same for the irrigated and rainfed treatments in 1994, the differences in tissue N between the two treatments may be due to higher amounts of residual N for the rainfed from the previous crop year. Because of the higher yield in 1993, the amount of N removed from the field in the harvested seed was about 30 kg N ha-1 more for the
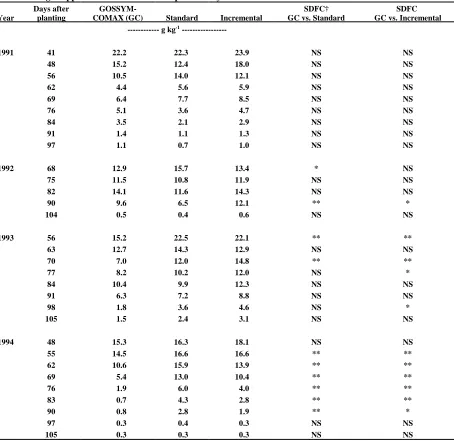
irrigated than for the rainfed (Hunt et al., 1997). Table 5. Nitrogen application method effect on petiole NO3-N concentration of cotton leaves.
Year
Days after planting
GOSSYM-COMAX (GC) Standard Incremental
SDFC† GC vs. Standard
SDFC GC vs. Incremental --- g kg-1
---1991 41 22.2 22.3 23.9 NS NS
48 15.2 12.4 18.0 NS NS
56 10.5 14.0 12.1 NS NS
62 4.4 5.6 5.9 NS NS
69 6.4 7.7 8.5 NS NS
76 5.1 3.6 4.7 NS NS
84 3.5 2.1 2.9 NS NS
91 1.4 1.1 1.3 NS NS
97 1.1 0.7 1.0 NS NS
1992 68 12.9 15.7 13.4 * NS
75 11.5 10.8 11.9 NS NS
82 14.1 11.6 14.3 NS NS
90 9.6 6.5 12.1 ** *
104 0.5 0.4 0.6 NS NS
1993 56 15.2 22.5 22.1 ** **
63 12.7 14.3 12.9 NS NS
70 7.0 12.0 14.8 ** **
77 8.2 10.2 12.0 NS *
84 10.4 9.9 12.3 NS NS
91 6.3 7.2 8.8 NS NS
98 1.8 3.6 4.6 NS *
105 1.5 2.4 3.1 NS NS
1994 48 15.3 16.3 18.1 NS NS
55 14.5 16.6 16.6 ** **
62 10.6 15.9 13.9 ** **
69 5.4 13.0 10.4 ** **
76 1.9 6.0 4.0 ** **
83 0.7 4.3 2.8 ** **
90 0.8 2.8 1.9 ** *
97 0.3 0.4 0.3 NS NS
105 0.3 0.3 0.3 NS NS
When petiole NO3–N and leaf blade N differed
between the lateral spacings, leaves from cotton in the 1-m spacing treatment always had higher concentrations than those from cotton grown with the laterals spaced 2-m apart (Tables 3 and 4). Differences between the two lateral spacings were generally found early in the season when the plants were young with smaller root systems. Petiole NO3–N was higher for the 1-m lateral spacing than
for the 2-m lateral spacing at 68 and 75 d after planting in 1992 and at 48 d after planting in 1994 (Table 3). Similarly, leaf blade N levels were higher in the cotton grown with the 1-m lateral spacing than
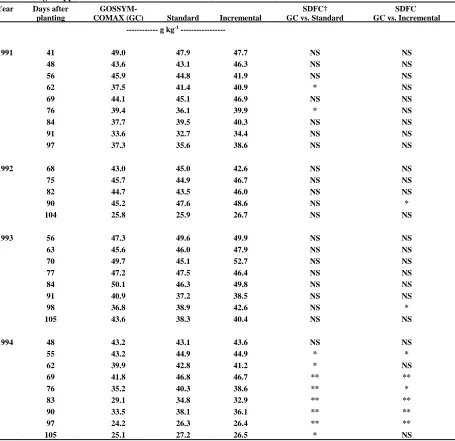
the 2-m spacing only at 48 and 56 d after planting in 1991, 68 d after planting in 1992, and 70 d after planting in 1993 (Table 4). The only time that the two lateral spacings differed long after the last N application (Table 1) was in 1992 when leaf blade N was higher for the 1-m spacing than the 2-m spacing at 104 d after planting. These samples were collected after 9 d of intensive rain when 330 mm of precipitation occurred. This large amount of water may have caused root damage through oxygen deprivation. Since the N was placed directly under the row in the 1-m spacing, it may have been nearer more roots after drainage of the excess soil water Table 6. Nitrogen application method effect on leaf blade N concentration of cotton leaves.
Year Days after planting
GOSSYM-COMAX (GC) Standard Incremental
SDFC† GC vs. Standard
SDFC GC vs. Incremental --- g kg-1
---1991 41 49.0 47.9 47.7 NS NS
48 43.6 43.1 46.3 NS NS
56 45.9 44.8 41.9 NS NS
62 37.5 41.4 40.9 * NS
69 44.1 45.1 46.9 NS NS
76 39.4 36.1 39.9 * NS
84 37.7 39.5 40.3 NS NS
91 33.6 32.7 34.4 NS NS
97 37.3 35.6 38.6 NS NS
1992 68 43.0 45.0 42.6 NS NS
75 45.7 44.9 46.7 NS NS
82 44.7 43.5 46.0 NS NS
90 45.2 47.6 48.6 NS *
104 25.8 25.9 26.7 NS NS
1993 56 47.3 49.6 49.9 NS NS
63 45.6 46.0 47.9 NS NS
70 49.7 45.1 52.7 NS NS
77 47.2 47.5 46.4 NS NS
84 50.1 46.3 49.8 NS NS
91 40.9 37.2 38.5 NS NS
98 36.8 38.9 42.6 NS *
105 43.6 38.3 40.4 NS NS
1994 48 43.2 43.1 43.6 NS NS
55 43.2 44.9 44.9 * *
62 39.9 42.8 41.2 * NS
69 41.8 46.8 46.7 ** **
76 35.2 40.3 38.6 ** *
83 29.1 34.8 32.9 ** **
90 33.5 38.1 36.1 ** **
97 24.2 26.3 26.4 ** **
105 25.1 27.2 26.5 * NS
than was the N placed in the alternate row middles (laterals spaced 2 m apart).
Differences between the N-application methods for leaf N and petiole NO3–N were few in 1991,
1992, and 1993 (Tables 5 and 6). When they did occur, leaves in the GOSSYM-COMAX treatment had generally lower concentrations of N than those in either of the other two N treatments. In 1994, both petiole NO3–N and leaf blade N was lower in leaves
collected from the GOSSYM-COMAX treatment than leaves collected from either of the other two treatments at almost every sampling date. This was due to the low amount of N that the model prescribed early in the season. In that year, one-half of the total sidedress N was applied at 91 and 96 d after planting (Table 1). Even though leaf N c o n c e n t r a t i o n s w e r e l o w e r f o r t h e GOSSYM-COMAX treatment than the other two treatments, levels were in the sufficiency range (Lutrick et al., 1986; Roof et al., 1994) and lint yield was not reduced by the lower N-application rate (Camp et al., 1997).
In summary, there was no effect of crop rotation with peanut on the cotton physiological parameters examined. Supplemental irrigation did improve plant water status at times and resulted in higher yields in 1992 and 1993. The 2-m lateral spacing was as effective as the 1-m spacing in supplying water to the plants. However, when plants were young, N status of plants grown with the 1-m spacing was higher than those grown with drip laterals spaced 2-m apart (Tables 3 and 4). When differences in petiole NO3–N and leaf blade N between the three
N-application methods (Tables 5 and 6) occurred, they were small. The results suggest that a lateral spacing wider than 1-m placement is adequate for supplying both water and N to cotton on this soil.
ACKNOWLEDGMENTS
Contribution of the USDA-ARS in cooperation with the South Carolina Agric. Exp. Stn. We thank Bobby Fisher, Terry Matheny, Jamie Usrey, and Sheila Godwin for technical assistance and Ellen Whitesides for helping prepare the manuscript.
REFERENCES
Baker, D.N., J.R. Lambert, and J.M. McKinion. 1983. GOSSYM: A simulator of cotton crop growth and yield. Clemson University, Clemson, SC. South Carolina Agric. Exp. Stn. Tech. Bull. 1089.
Baker, W.H., and T.L. Thompson. 1992. Determination of nitrate nitrogen in plant samples by selective electrode. p. 25–28. In C.O. Plank (ed.) Plant analysis procedures for the Southern Region of the United States. Georgia Agric. Exp. Stn. Bull. 368.
Bucks, D.A., S.G. Allen, R.L. Roth, and B.R. Gardner. 1988. Short staple cotton under micro and level-basin irrigation methods. Irrig. Sci. 9:161–176.
Camp, C.R., P.J. Bauer, and P.G. Hunt. 1997. Subsurface drip irrigation lateral spacing and management for cotton in the southeastern Coastal Plain. Trans. ASAE 40(4):993–999.
Camp, C.R., W.M. Thomas, and C.C. Green. 1993. Microirrigation scheduling and tube placement for cotton in the southeastern Coastal Plain. Trans. ASAE 36(4):1073-1078.
French, O.F., D.A. Bucks, R.L. Roth, and B.R. Gardner. 1985. Micro and level-basin irrigation management for cotton production. p. 555–561. In Anon. (ed.) Drip/trickle irrigation in action. Proc. 3rd Int. Drip/Trickle Irrigation Congress, Fresno, CA. 18–21 Nov. 1985. ASAE, St. Joseph, MI.
Hunt, P.G., P.J. Bauer, C.R. Camp, and T.A. Matheny. 1998. Nitrogen accumulation in cotton grown continuously or in rotation with peanut using subsurface microirrigation and GOSSYM/COMAX management. Crop Sci. (in press.)
Lemmon, H. 1986. COMAX: An expert system for cotton crop management. Science 233:29–33.
Lutrick, M.C., H.A. Peacock, and J.A. Cornell. 1986. Nitrate monitoring for cotton lint production on a Typic Paleudult. Agron. J. 78:1041–1046.
McConnell, J.S., B.S. Frizzell, R.L. Maples, M.H. Wilkerson, and G.A. Mitchell. 1989. Relationships of irrigation methods and nitrogen fertilizer rates in cotton production. Arkansas Agric. Exp. Stn. Rep. Ser. 310.
Mullins, G.L., and C.H. Burmester. 1990. Dry matter, nitrogen, phosphorous, and potassium accumulation by four cotton varieties. Agron. J. 82:729–736.
Roof, M.E., D.S. Howle, J.J. Camberato, E.C. Murdock, J.D. Mueller, G.D. Christenbury, M.I. Lloyd, and J.W. Jordan. 1994. South Carolina cotton growers guide. Clemson Univ. Coop. Ext. Serv. Bull. EC 589.