Combining multiple features for error
detection and its application in brain–computer
interface
Jijun Tong
1*, Qinguang Lin
1†, Ran Xiao
2†and Lei Ding
2,3†Background
The technology of brain–computer interface (BCI) has recently gained increasing atten-tions and has great potentials in improving the quality of life for people suffering from severe motor disabilities, such as cerebral palsy and paralysis [1]. The goal of BCI is to establish a communication channel between human brains and ambient environment [2], by directly decoding brain signals in order to control external devices. Electroen-cephalography (EEG) is one of the most popular measurement techniques used in BCI, which acquires electrical signals of the human brain with electrodes attached to the
Abstract
Background: Brain–computer interface (BCI) is an assistive technology that conveys users’ intentions by decoding various brain activities and translating them into control commands, without the need of verbal instructions and/or physical interactions. How-ever, errors existing in BCI systems affect their performance greatly, which in turn con-fines the development and application of BCI technology. It has been demonstrated viable to extract error potential from electroencephalography recordings.
Methods: This study proposed a new approach of fusing multiple-channel features from temporal, spectral, and spatial domains through two times of dimensionality reduction based on neural network. 26 participants (13 males, mean age = 28.8 ± 5.4, range 20–37) took part in the study, who engaged in a P300 speller task spelling cued words from a 36-character matrix. In order to evaluate the generalization ability across subjects, the data from 16 participants were used for training and the rest for testing. Results: The total classification accuracy with combination of features is 76.7 %. The receiver operating characteristic (ROC) curve and area under ROC curve (AUC) further indicate the superior performance of the combination of features over any single fea-tures in error detection. The average AUC reaches 0.7818 with combined feafea-tures, while 0.7270, 0.6376, 0.7330 with single temporal, spectral, and spatial features respectively. Conclusions: The proposed method combining multiple-channel features from temporal, spectral, and spatial domain has better classification performance than any individual feature alone. It has good generalization ability across subject and provides a way of improving error detection, which could serve as promising feedbacks to pro-mote the performance of BCI systems.
Keywords: BCI, Error detection, Multi-channel, Combination of features
Open Access
© 2016 Tong et al. This article is distributed under the terms of the Creative Commons Attribution 4.0 International License (http:// creativecommons.org/licenses/by/4.0/), which permits unrestricted use, distribution, and reproduction in any medium, provided you give appropriate credit to the original author(s) and the source, provide a link to the Creative Commons license, and indicate if changes were made. The Creative Commons Public Domain Dedication waiver (http://creativecommons.org/publicdomain/ zero/1.0/) applies to the data made available in this article, unless otherwise stated.
RESEARCH
*Correspondence: [email protected] † Qinguang Lin, Ran Xiao and Lei Ding contributed equally to this work
scalp. Comparing to other measurement techniques, EEG has the advantages of nonin-vasive, low cost, and easy setup. Therefore, it has been widely adopted in BCI technolo-gies [3]. Brain patterns in EEG utilized in BCI applications include P300 [4, 5], motor imagery [6, 7], steady-state visually evoked potentials (SSVEP) [8, 9], error-related nega-tivity (ERN) [10] and so on [11, 12].
While successful demonstrations have been achieved in laboratory settings, the appli-cation of BCI technologies in real-life scenarios still faces critical challenges. Due to its noninvasive nature, EEG recordings are relatively far from signal sources and are further smeared by the scalp, cerebrospinal fluid and other soft tissues sitting in between. These factors result in useful EEG signals that are usually weak and susceptible to static and electromagnetic interference, as well as other spontaneous activities, such as electromy-ography from movements of head and eyes [13]. These limitations of EEG make inevita-ble errors in the process of detecting users’ intentions in BCI systems [14]. It is thus of great importance in improving the robustness and reliabilities of BCI systems in order to achieve real-life applications.
Human and other species [15] learn and adapt their behaviors through the perception of errors. Past studies found that a time-locked negative deflection in EEG, mostly vis-ible in frontal and central cortical sites, accompanies the occurrence of errors, namely, error-related negativity (ERN) [16]. Similar negativities in EEG signals have been reported in BCI studies when subjects observe incorrect outputs from BCI systems [17, 18]. The negative potentials detected at the onset of unexpected feedbacks (feedback ERN, or fERN) [19, 20] can be utilized to adjust command outputs of BCI systems. Thus, improvements on detection of error potentials (ErrPs) could facilitate the development of BCI systems with improved accuracy. Spuler et al. [21, 22] implemented an error–cor-rection scheme in a P300 speller to correct error outputs in order to improve writing speed, which instantiates the application of ErrP detection in EEG data for promoting performance of BCI systems. However, both scanty knowledge about the neural mecha-nism of ErrPs and their temporal variations in status, amplitude and latency impose dif-ficulties on the investigation [23].
an adaptive CSP [28], Lotte and Guan investigated means in regularizing CSP [29], and Li et al. proposed L1-norm based CSP [30], all in an effort to overcome the overfitting problem. Shou and Ding [31, 32] proposed blind source analysis and studied EEG signals including ErrP associated with errors.
Because of the nonstationarity of EEG, no optimal features can be extracted from tem-poral or spectral domain alone. Meantime, due to the fact that various activities take place across different brain regions, overfitting might occur if using features from all channels for classification [33]. On the other hand, it is a critical challenge to select fea-ture channels containing large inter-condition differences, without affecting the perfor-mance of BCI systems [34]. To tackle these problems, a procedure is proposed in the present study, which includes two times of dimensionality reduction on three types of features from temporal, spectral, and spatial domains with the use of neural network, and then the features are combined for classification. The present results from experi-mental data suggest superior classification performance of combined features over any individual features alone.
Methods
Experimental protocol
EEG data from the BCI challenge in IEEE EMBS NER 2015 conference were chosen for evaluation [35]. Perrins et al. designed the experimental protocol and collected the EEG data [36]. Twenty-six healthy subjects took part in this study (13 males and 13 females, mean age = 28.8 ± 5.4, range 20–37). All subjects went through five copy-spelling
ses-sions. Each session consisted of 12 five-letter words, except the fifth which consisted of 20 five-letter words.
All subjects reported normal or corrected-to-normal vision and had no previous expe-rience with the P300 speller paradigm or any other BCI applications. EEG data were recorded with 56 passive Ag/AgCl EEG sensors whose placement followed the extended international 10–20 system. Their signals were all referenced to a reference sensor at the nose. The ground electrode was placed on the shoulder and impedances were kept below 10 kΩ. Signals were sampled at 600 Hz.
In order to evaluate the generalization ability across subjects, the data from 16 partici-pants was used for training and the rest 10 for testing.
Preprocessing
The downloaded EEG data have been downsampled to 200 Hz.
Feature extraction
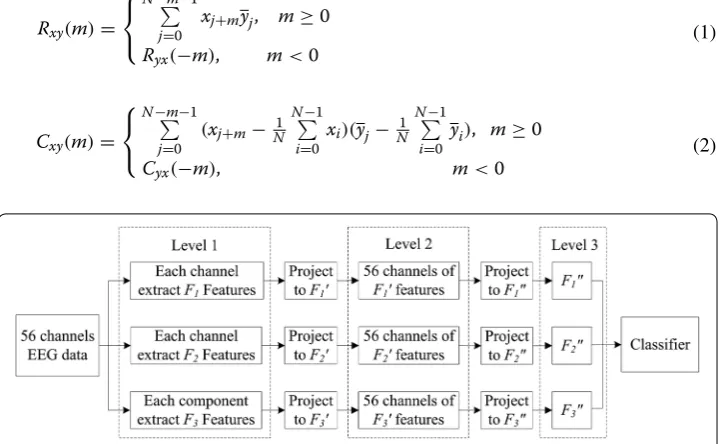
The features from temporal, spectral, and spatial domains were extracted from EEG sig-nals, and then the back-propagation neural network (BP neural network) was adopted to perform two times of dimensionality reduction, in the end the acquired three levels of features from temporal, spectral, and spatial domains were used in another BP neural network for classification. The procedure is detailed in Fig. 1.
Step 1: Extract temporal feature F1 from each EEG channel as the level-1 features. Step 2: Using the level-1 features F1 from the training group to train a BP neural
net-work, which was applied to classify F1 features. The derived one-dimensional post-hoc probabilities were the level-2 features F1′.
Step 3: Using the level-2 features F1′ from all channels to train another BP neural net-work, which was applied to classify the 56-dimensional level-2 features F1′, resulting in one-dimensional level-3 temporal features F1′′.
Step 4: Extract level 1 features F2 in the spectral domain and repeat step 2 and 3 to achieve one-dimensional spectral features F2′′.
Step 5: Extract level 1 features F3 from in the spatial domain and repeat step 2 and 3 to achieve one-dimensional spatial features F3′′.
Step 6: Combine three features [F1′′ F2′′ F3′′] from the training group to train a feed-forward neural network, which was applied to classify samples from the testing group.
To extract the level-1 features at different domains, a series of algorithms were imple-mented and described as below.
①Extraction of the level-1 features in the temporal domain (F1): the training data were separated into two classes based on their labels, i.e., positive and negative feedbacks.
¯
y∈ [Position, Negative] denotes the mean of each class. Then the correlation Rxy and
covariance Cxy between each sample x and y¯ were computed as the feature set F1, using
(1) Rxy(m)=
N−m−1 �
j=0
xj+myj, m≥0
Ryx(−m), m<0
(2) Cxy(m)=
N−m−1
�
j=0
(xj+m− N1 N−1
�
i=0
xi)(yj−N1 N−1
�
i=0
yi), m≥0
Cyx(−m), m<0
where x denotes each sample, N is the length of each sample and m is the corresponding latency.
②Extraction of the level-1 features in spectral domain (F2): the extraction was achieved following the approach from Huang et al. [39]. The empirical mode decomposi-tion (EMD) was firstly performed to decompose samples from each channels into intrin-sic mode functions (IMF) using
where ci is IMF, n is the number of IMF decomposed, rn is residue after EMD decompo-sition. Then Hilbert transformation was performed on each IMF component:
The analytic signal zi(t) was achieved by:
where ai(t) and θi(t) were instantaneous amplitude and phase respectively, which were calculated by:
Then instantaneous frequency of the ith IMF component was acquired by taking the derivative of θi(t) as
Thus, signal x(t) can be describe as below in reflecting its changing amplitudes along time and frequency:
The Hilbert spectrum for each IMF component was denoted as:
Finally, relative energy coefficient (E), mean frequency (), mean slope (MS), and coef-ficient of variance (CV) were calculated as below to form the level-1 features in the spec-tral domain F2=[Ei Φi MSi CVi], (i∈1, 2,. . ., n).
(3) x(t)=
n
i=1 ci+rn
(4) yi(t)=
1 π
∞
−∞ ci(τ) t−τd(
τ)
(5) zi(t)=ci(t)+jyi(t)=ai(t)eiθi(t)
(6) ai(t)=
y2i(t)+c2i(t)
(7) θi(t)=arctan
yi(t) ci(t)
(8) ωi(t)=
dθi(t) dt
(9)
x(t)= n
i=1
ai(t)ej
ωi(t)dt =H(ω,t)
(10) Hi(ω,t)=ai(t)ej
where μi and σi are the mean and standard deviation of the ith IMF component.
③Extraction of the level-1 features in the spatial domain (F3): the extraction was implemented through four steps based on the approach from Ramoser et al. [27]
a. Calculate the mean covariance matrices R¯p and R¯n for the two classes (positive and
negative feedbacks), and eigenvalue decomposition as R¯
p+ ¯Rn=UCCU
′
C b. Calculate the whitening transfer matrix P=
−1
C UC′
c. Whitening transformation on the mean covariance matrix Si=PR¯iPT,i∈ [n,p] d. Sn and Sp share common eigenvectors B, i.e., Si = BλiBT, i ∊ [n, p]
e. Each row in the projection matrix W = BTP is the common spatial pattern of the two classes
f. The feature set F3 consisted of Yi = WiTX, (i ∊ 1, 2, …, 56).
While the common spatial pattern filter (each row of W56×56) provides a mathematical mean of combining features in the spatial domain, manual adjustment is still required to further improve the performance [33, 40]. Otherwise, overfitting could occur in clas-sification due to the hyper-dimensional space [33]. However, in our method, we need not choose the filter manually, because we have realized the dimensionality reduction of spatial features using neural network from level 2 to 3 and could use all spatial filters, bypassing the redundant manual work.
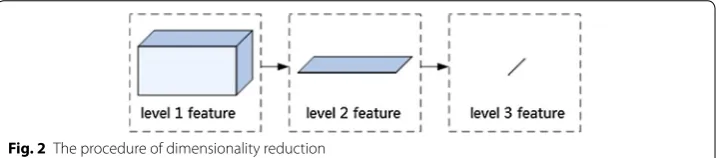
Dimensionality reduction
Each type of features was with different dimensionalities. There were 164, 12 and 161 dimensions in temporal, spectral and spatial features, respectively. Thus, the total length of the level-1 feature vector was 56 × (164 + 12 + 161). For convenience, we wrote it as 56 × 3 × M, where 56 was the channel number, the number 3 represented the
num-ber of kinds of features, and M ∊ [164, 12, 161] represented the length of correspond-ing features. The whole dimensionality reduction process is illustrated in Fig. 2. The 1st dimensionality reduction led to the collapse of level-1 features from a 3D space to level-2 features on a 2D plane, by replacing samples in level-1 features with posteriori probabili-ties. The dimension of the level-2 feature from all channels was then further collapsed, which could be visualized as the linearization of a plane (Fig. 2).
(11) Ei=
∞
−∞Hi2(ω,t)dω 3
i=1 ∞
−∞Hi2(ω,t)dω
(12) �i=
1
N
ωi(t)
(13) MS= 1
N
dci(t)
dt
(14) CVi= σi
The feedforward BP neural network was used to reduce dimensionality of features. By inputting multi-dimensional level-1 features F, one-dimensional level-2 features F′ were acquired after dimension deduction, by
where i ∊ [1, 2, 3] denotes different features. WT and b are weights of the neural network and bias, respectively, acquired from training datasets. Tansig indicates the hyperbolic tangent sigmoid transfer function that calculated a layer’s output from its net input.
When repeating the same steps with level-2 features, the outputs were level-3 features as F″.
Classification
For classification, the feedforward neural network was implemented after obtaining level-3 features p = [F1″F2″F3″]. The neural network can be described as
where Output is the classification results. WT and b are weights of the neural network and bias, respectively, obtained from level-3 features p using training data. Logisg is a transfer function as
Results
The features from different domains
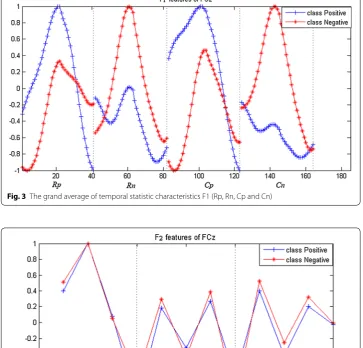
F1, F2, F3 are features extracted from temporal, spectral, and spatial domains, respec-tively. The magnitude differences represent the ability to distinguish two types of signals.
The feature set F1 consists of Rp, Rn, Cp and Cn, and is shown in Fig. 3.
F2 is the intrinsic mode functions (IMF) decomposed by EMD decomposition. Sam-ples from each channel are decomposed into four IMF components. Due to the reason that the fourth IMF is a monotonic curve, the first three components are chosen as F2 features, as shown in Fig. 4.
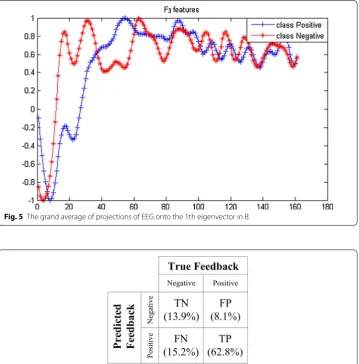
F3 features are the projections of EEG from each channel on the projection matrix W from CSP. The projections of EEG onto the first or last eigenvector or some eigenvector
(15) Fi′=tansig(WTFi+b)
(16) tansig(n)= 2
1+e−2n −1
(17) Output=logsig(WTp+b)
(18)
logsig(n) = 1
1+e−n
in B were commonly used. Although that would decrease the difficulty, signal leakage could occur [41]. Figure 5 presents the projections of EEG onto the 1th eigenvector in B.
Performance in error detection
The training and predict programs run on the personal computer (CPU: Intel(R) Core(TM) i5-4590 @ 3.30 GHz, RAM: 8 GB, System: Windows 10 64-bit, Platform: Mat-lab R2014a). The data from 16 participants (total 5400 samples) were used as the training set, which took 137 min for training. And it took 3.56 s to predict one sample in testing set.
The confusion matrix is implemented to evaluate the performance of classification. Figure 6 shows the results of multiple features (F1′′ + F2′′ + F3′′) from testing group
Fig. 3 The grand average of temporal statistic characteristics F1 (Rp, Rn, Cp and Cn)
including true negative (13.9 %), false positive (8.1 %), false negative (15.2 %) and true positive (62.8 %). The total accuracy is the sum of true positive and true negative, i.e., 76.7 %.
Influence of features and individual variance
In order to further evaluate the effectiveness of feature extraction and the performance of classification, receiver operating characteristic (ROC) curves using different features and their combinations are shown as Fig. 7. F1, F2 and F3 represent the temporal, spec-tral, and spatial features, respectively. The combination of three features leads to the best performance. Table 1 shows the results of the variance among individual subjects for accuracies of error detection using the metric of area under ROC curves, from different types of features. It demonstrates the combination of features could improve the perfor-mance of classification, the results of a one-way Analysis of Variance (ANOVA) show significant difference (F = 7.24, p < 0.005) between single features and combination of
three features.
Fig. 5 The grand average of projections of EEG onto the 1th eigenvector in B
The data also reflect variance among individuals. Based on the classification perfor-mance from the combination of three features, the participants generally fall into two groups. One group contains 6 subjects with the average AUC of 0.8339, and another group contains 4 subjects with the average AUC of 0.6585. The performance using three single features in the first group also surpasses the second one, as shown in the first three columns of Table 1. One possible reason is that the participants in the first group were more concentrated in the task and the signal-to-noise ratios (SNR) of EEG data were higher than the second group during the extraction of useful features. Some previous
Fig. 7 ROC curves from using different features (testing group result)
Table 1 Individual AUC metric values from using different features
Subjects F1′′ F2′′ F3′′ F1′′ + F2′′ F1′′ + F3′′’ F2′′ + F3‴ F1′′ + F2′′ + F3‴
2 0.7475 0.6163 0.7493 0.7550 0.7908 0.7554 0.7990
3 0.8961 0.5662 0.8024 0.8638 0.8706 0.7992 0.8788
5 0.7497 0.6774 0.7870 0.7691 0.7896 0.8111 0.7968
6 0.7596 0.5642 0.7004 0.7486 0.7797 0.7071 0.7856
7 0.8169 0.6115 0.7843 0.8257 0.8381 0.7992 0.8531
8 0.7503 0.7161 0.9031 0.7878 0.8967 0.9238 0.8902
1 0.6547 0.5599 0.6280 0.6576 0.6507 0.6323 0.6645
4 0.6214 0.5950 0.5943 0.6382 0.6122 0.6146 0.6369
9 0.7430 0.5144 0.5488 0.7135 0.6184 0.5486 0.6617
10 0.6510 0.4981 0.6844 0.6246 0.6961 0.6570 0.6711
studies have shown that electrophysiological responses are known to reflect participant’s involvements in the task [36, 42, 43].
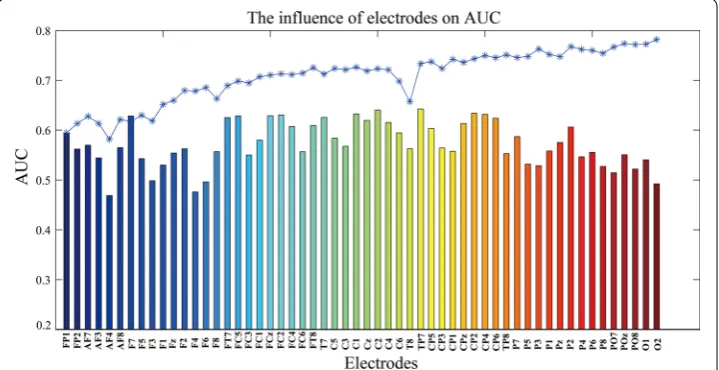
Influence of electrodes
Although multi-channel EEG signals could provide more comprehensive and complete information about different conditions, the added dimensionalities would also lead to overfitting and reduced the classification performance.
Figure 8 presents the influence of electrodes on the classification performance from using the combination of three features. Firstly, it reveals the effect of electrode loca-tion to the classificaloca-tion results. Features from electrodes in central brain regions gen-erally exceed those at peripherals in classification performance. Secondly, it shows that single electrodes have poor performance in detecting errors with the average AUC of 0.5726. The AUC values of features from electrodes (AF4, F4, F6, O2) are near 0.5, which demonstrate the poor ability of classification. With added features from more electrodes, the classification generally show increasing pattern except for a few electrodes (i.e., AF4, F8 and T8), illustrated by stars in Fig. 8. The added features lead to the adjustment of weights in neural network toward desired directions, which in turn contribute to the improvements in classification performance.
Discussion
Feature extraction and representation are critical factors in error detection. Single fea-tures from temporal, spectral, and spatial domain have been widely investigated in many studies [25, 27]. In the present study, we proposed a method of error detection using neural network to combine various features from multiple-electrode EEG, which not only combines features of different domains, but also addresses the overfitting issue caused by the curse of dimensionality. In the contest, our performance score was 0.7818 and ranked fourth among all the 260 teams attending the challenge, as shown in Table 2. The abilities in error detection of the three features F1, F2, F3 can be observed in Figs. 3, 4,
and 5, respectively, revealed by the magnitude differences in various features. The obser-vation is in line with the classification performance in Fig. 7 and Table 1. For example, the magnitude differences are small for F2, comparing to other two features, and its clas-sification performance are also worse than others as shown in the 3rd column in Table 1. Nevertheless, there is still constructive information in F2 for error detection, suggested by the improved detection performance with F2 added to the combination of features in Table 1. Such combinations make use of information from temporal, spectral, and spa-tial domains, and provide more comprehensive information about errors than individual features. However, simple combination of features would result in long feature vectors. When further considering added information from different electrodes, the complex model is very susceptible to the overfitting problem in classification, which might lead to degeneration in performance. Therefore, feature extraction and dimensionality reduc-tion play important roles in error detecreduc-tion in the present study. The feedforward BP neural network is implemented to reduce the dimensionality of features. The outputs of neural network are essentially the posterior probability of the primary inputs, and the values are between [0, 1] (values close to 1 favor the labeling towards positive class, and 0 to the negative class). After two times of dimensionality reduction, the level-3 features become just one dimension.
In previous studies, some researchers realized dimensionality reduction through chan-nel selection. They selected electrodes via observing topographic EEG power maps over the scalp [36, 37]. In addition, there are some other studies that implement PCA [44], ICA [45, 46] or other channel selection algorithms [39], for the selection of spatial features.
In term of detection performance, the following factors pose impacts in the proposed method. The first factor is the preprocessing of raw EEG data, such as removal of eye artifacts, time window length and cutoff frequency of bandpass filter. It is found that eye-movement artifact removal during EEG preprocessing could enhance the accuracy about 2 %. Another factor is the feature extraction process, such as the selection of time delay parameter m in the process of temporal feature extraction. The larger the m value is, the more information about error detection in F1 features. When extracting features in the spatial domain, it is found that other spatial filter method such as xDAWN [47] could also be used to improve performance.
The error detection is essentially a binary classification problem. Such type of classi-fication usually suffers greatly from unbalanced sample numbers from different classes. This imbalanced sample numbers result in biased classification towards the majority
Table 2 The score and ranking of our method
Rank AUC
1 0.8722
2 0.8566
3 0.8180
Our method 0.7818
5 0.7692
class and lower detection rate in the minority class [48, 49]. To tackle such a problem, different techniques were explored to compensate inter-class sample differences, such as over-sampling and under-sampling [50]. In addition, some researchers improved the prediction rate of the minority class by adopting classifier algorithms [51]. In future works, it could be an important aspect to investigate in order to improve the accuracy of error detection.
Conclusions
In the present study, to capture the discriminative information about error potentials in features from different domains and avoid overfitting caused by features of multiple dimensionalities, we proposed a new approach of combining multiple-channel features from temporal, spectral, and spatial domains through two times of dimensionality reduc-tion based on neural network. It took advantage of informareduc-tion from multiple electrodes and combination of features from different domains rather than single features. The clas-sification results using ROC curves and AUC metrics suggest superior performance with combined features over single features, and show the good generalization ability across subjects of the proposed algorithm. The improved accuracy in error detection in pre-sent study demonstrate great potentials in promoting the performance for BCI systems integrated with scheme of error correction. This could facilitate developing robust BCI systems towards real-life environment.
Authors’ contributions
All authors participated in the research. TJJ and DL designed the algorithm framework, TJJ and LQG realized the algo-rithms and data analysis, TJJ, XR and DL finished the manuscript. All authors read and approved the final manuscript.
Author details
1 School of Information Science and Technology, Zhejiang Sci-Tech University, Hangzhou 310018, China. 2 School of Elec-trical and Computer Engineering, University of Oklahoma, Norman, OK 73019, USA. 3 Center for Biomedical Engineering, University of Oklahoma, Norman, OK 73019, USA.
Acknowledgements
The authors would like to appreciate Perrin Margaux et al. for sharing the data. The research was supported by the National Natural Science Foundation of China (31200746), Natural Science Foundation of Zhejiang Province (LY15H180013), and “521” Talent Project of ZSTU.
Competing interests
The authors declare that they have no competing interests.
Received: 30 September 2015 Accepted: 26 January 2016
References
1. Tong J, Zhu D. Multi-phase cycle coding for SSVEP based brain–computer interfaces. Biomed Eng Online. 2015;14:5. 2. Blankertz B, Schäfer C, Dornhege G, Curio G. Single trial detection of EEG error potentials: a tool for increasing BCI
transmission rates. In: Artificial Neural ?Networks—ICANN 2002. Heidelberg: Springer; 2002: p. 1137–1143. 3. Wolpaw JR, Loeb GE, Allison BZ, Donchin E, Do NO, Heetderks WJ, Nijboer F, Shain WG, Turner JN. BCI Meeting 2005–
workshop on signals and recording methods. IEEE Trans Neural Syst Rehabil Eng. 2006;14:138–41.
4. Farwell LA, Donchin E. Talking off the top of your head: toward a mental prosthesis utilizing event-related brain potentials. Electroencephalogr Clin Neurophysiol. 1988;70:510–23.
5. Kapeller C, Ortner R, Krausz G, Bruckner M, Allison BZ, Guger C, Edlinger G. Toward Multi-brain Communication: Col-laborative Spelling with a P300 BCI. In: Foundations of Augmented Cognition. Advancing Human Performance and Decision-Making through Adaptive Systems. Heidelberg: Springer; 2014: p.47–54.
6. Kaiser V, Bauernfeind G, Kreilinger A, Kaufmann T, Kubler A, Neuper C, Muller-Putz GR. Cortical effects of user train-ing in a motor imagery based brain–computer interface measured by fNIRS and EEG. Neuroimage. 2014;85(Pt 1):432–44.
8. Bin G, Gao X, Yan Z, Hong B, Gao S. An online multi-channel SSVEP-based brain–computer interface using a canoni-cal correlation analysis method. J Neural Eng. 2009;6:46002.
9. Friman O, Volosyak I, Graser A. Multiple channel detection of steady-state visual evoked potentials for brain–com-puter interfaces. IEEE Trans Biomed Eng. 2007;54:742–50.
10. Spà Ler M, Niethammer C. Error-related potentials during continuous feedback: using EEG to detect errors of differ-ent type and severity. Front Hum Neurosci. 2015;9:155.
11. Bharne PP, Kapgate D. Hybrid visual BCI combining SSVEP and P300 with high ITR and accuracy. 2015.
12. Edlinger G, Allison BZ, Guger C. How many people can use a BCI system? In: Clin Sys Neurosci. Heidelberg: Springer; 2015: p. 33–66.
13. Kim BH, Jo S. Real-time motion artifact detection and removal for ambulatory BCI. In: 2015-01-01. IEEE; 2015: p. 1–4. 14. Vanacker G. Del R Millán J, Lew E, Ferrez PW, Moles FG, Philips J, Van Brussel H, Nuttin M: Context-based filtering for
assisted brain-actuated wheelchair driving. Comput Intell Neurosci. 2007;2007:3.
15. Rabbitt PM. Errors and error correction in choice-response tasks. J Exp Psychol. 1966;71:264–72.
16. Gehring WJ, Goss B, Coles MGH, Meyer DE, Donchin E. A neural system for error detection and compensation. Psychol Sci. 1993;4:385–90.
17. Schalk G, Wolpaw JR, McFarland DJ, Pfurtscheller G. EEG-based communication: presence of an error potential. Clin Neurophysiol. 2000;111:2138–44.
18. Ferrez PW. Error-related EEG potentials generated during simulated brain–computer interaction. IEEE Trans Biomed Eng. 2008;55:923–9.
19. Miltner WH, Braun CH, Coles MG. Event-related brain potentials following incorrect feedback in a time-estimation task: evidence for a “generic” neural system for error detection. J Cogn Neurosci. 1997;9:788–98.
20. Ferrez PW, Millán JDR. Simultaneous real-time detection of motor imagery and error-related potentials for improved BCI accuracy. In: 2008-01-01; 2008.
21. Spuler M, Bensch M, Kleih S, Rosenstiel W, Bogdan M, Kubler A. Online use of error-related potentials in healthy users and people with severe motor impairment increases performance of a P300-BCI. Clin Neurophysiol. 2012;123:1328–37.
22. Spuler M, Rosenstiel W, Bogdan M. Online adaptation of a c-VEP Brain–computer Interface(BCI) based on error-related potentials and unsupervised learning. PLoS One. 2012;7:e51077.
23. Falkenstein M: ERP correlates of erroneous performance. In: Max-Planck-Institut für Kognitions-und Neurowissen-schaften Leipzig; 2004: p. 5–14.
24. Dal Seno B, Matteucci M, Mainardi L: A genetic algorithm for automatic feature extraction in P300 detection. In: Neural Networks, 2008. IJCNN 2008. (IEEE World Congress on Computational Intelligence). IEEE International Joint Conference on; 0001-08-20; 2008: p. 3145–3152.
25. Omedes J, Iturrate I, Montesano L, Minguez J. Using frequency-domain features for the generalization of EEG error-related potentials among different tasks. Conf Proc IEEE Eng Med Biol Soc. 2013;2013:5263–6.
26. Zhang H, Chavarriaga R, Goel MK, Gheorghe L, Millan JR. Improved recognition of error related potentials through the use of brain connectivity features. Conf Proc IEEE Eng Med Biol Soc. 2012;2012:6740–3.
27. Ramoser H, Muller-Gerking J, Pfurtscheller G. Optimal spatial filtering of single trial EEG during imagined hand movement. IEEE Trans Rehabil Eng. 2000;8:441–6.
28. Song X, Yoon SC. Improving brain–computer interface classification using adaptive common spatial patterns. Com-put Biol Med. 2015;61:150–60.
29. Lotte F, Guan C. Regularizing common spatial patterns to improve BCI designs: unified theory and new algorithms. IEEE Trans Biomed Eng. 2011;58:355–62.
30. Li P, Xu P, Zhang R, Guo L, Yao D. L1 norm based common spatial patterns decomposition for scalp EEG BCI. Biomed Eng Online. 2013;12:77.
31. Shou G, Ding L: Neural markers for immediate performance accuracy in a Stroop color-word matching task: An event-related potentials analysis. In: 2014-01-01. IEEE; 2014: p. 6222–6225.
32. Shou G, Ding L. Detection of EEG spatial–spectral–temporal signatures of errors: A comparative study of ICA-based and channel-based methods. Brain Topogr. 2015;28:47–61.
33. Lu J, Xie K, McFarland DJ. Adaptive spatio-temporal filtering for movement related potentials in EEG-based brain– computer interfaces. IEEE Trans Neural Syst Rehabil Eng. 2014;22:847–57.
34. Barachant A, Bonnet S: Channel selection procedure using riemannian distance for BCI applications. In: Neural Engineering (NER), 2011 5th International IEEE/EMBS Conference on; 2011-01-01; 2011: p. 348–351.
35. NER: A spell on you if you cannot detect errors!., vol. 2015.
36. Margaux P, Emmanuel M, Sébastien D, Olivier B, Jérémie M. Objective and subjective evaluation of online error cor-rection during p300-based spelling. Adv Hum-Comput Interact. 2012;2012:1–13.
37. Farquhar J, Hill NJ. Interactions between pre-processing and classification methods for event-related-potential clas-sification. Neuroinformatics. 2013;11:175–92.
38. Alhaddad MJ. Common Average Reference (CAR) Improves P300 Speller. Int J Eng Technol. 2012;2:451–65. 39. Huang NE, Shen Z, Long SR, Wu MC, Shih HH, Zheng Q, Yen NC, Tung CC, Liu HH. The empirical mode
decomposi-tion and the Hilbert spectrum for nonlinear and non-stadecomposi-tionary time series analysis. Proceedings of the Royal Society A: Mathematical, Physical and Engineering Sciences. 1998;454:903–95.
40. Iturrate I, Montesano L, Chavarriaga R, Millán JDR, Minguez J. Spatio-temporal filtering for EEG error related poten-tials. In; 2011-01-01.; 2011.
41. Friman O, Volosyak I, Graser A. Multiple channel detection of steady-state visual evoked potentials for brain–com-puter interfaces. IEEE Trans Biomed Eng. 2007;54:742–50.
42. Treder MS, Blankertz B. (C)overt attention and visual speller design in an ERP-based brain–computer interface. Behav Brain Funct. 2010;6:28.
• We accept pre-submission inquiries
• Our selector tool helps you to find the most relevant journal
• We provide round the clock customer support
• Convenient online submission
• Thorough peer review
• Inclusion in PubMed and all major indexing services
• Maximum visibility for your research
Submit your manuscript at www.biomedcentral.com/submit
Submit your next manuscript to BioMed Central
and we will help you at every step:
44. Pouryazdian S, Erfanian A. Detection of steady-state visual evoked potentials for brain–computer interfaces using PCA and high-order statistics. In: World Congress on Medical Physics and Biomedical Engineering. p. 480–483. 45. Wang Y, Zhang Z, Gao X, Gao S. Lead selection for SSVEP-based brain–computer interface. In: 2004-01-01. IEEE; 2004:
p. 4507–4510.
46. Piccione F, Giorgi F, Tonin P, Priftis K, Giove S, Silvoni S, Palmas G, Beverina F. P300-based brain computer interface: reliability and performance in healthy and paralysed participants. Clin Neurophysiol. 2006;117:531–7.
47. Rivet B, Souloumiac A, Attina V, Gibert G. xDAWN algorithm to enhance evoked potentials: application to brain– computer interface. IEEE Trans Biomed Eng. 2009;56:2035–43.
48. Hongkun F. Imbalanced dataset classification with support vector machine. Sun Yat-sen University, Applied Math-ematics; 2009.
49. Akbani R, Kwek S, Japkowicz N. Applying support vector machines to imbalanced datasets. Heidelberg: Springer; 2004: p. 39–50.
50. Xu G, Shen F, Zhao J. The effect of methods addressing the class imbalance problem on P300 detection. In; 2013-01-01. IEEE; 2013: p. 1–5.