Quantification of three‑dimensional
computed tomography angiography
for evaluating coronary luminal stenosis
using digital subtraction angiography
as the standard of reference
Wei Guo
1†, Xin Liu
2,3†, Zhifan Gao
2,3,6†, Sandeep Pirbhulal
2,3,6, Wenhua Huang
4, Wan‑Hua Lin
2,3*, Heye Zhang
2,3,
Ning Tan
1and Yuan‑Ting Zhang
2,3,5Abstract
Objective: We sought to evaluate the accuracy of quantitative three‑dimensional (3D) CT angiography (CTA) for the assessment of coronary luminal stenosis using digital subtraction angiography (DSA) as the standard of reference.
Method: Twenty‑three patients with 54 lesions were referred for CTA followed by DSA. The CTA scans were performed with 256‑slice spiral CT. 3D CTA were reconstructed from two‑dimensional CTA imaging sequences in order to extract the following quantitative indices: minimal lumen diameter, percent diameter stenosis (%DS), minimal lumen area, and percent area stenosis (%AS). Correlation and limits of agreement were calculated using Pearson correlation and Bland–Altman analysis, respectively. The diagnostic performance and the diagnostic concordance of 3D CTA‑ derived anatomic parameters (%DS, %AS) for the detection of severe coronary arterial stenosis (as assessed by DSA) were presented as sensitivity, specificity, diagnostic accuracy, and Kappa statistics. Of which vessels with %DS >50% or with %AS >75% were identified as severe coronary arterial lesions.
Result: The correlations of the anatomic parameters between 3D CTA and DSA were significant (r= 0.51–0.74, P < 0.001). Bland–Altman analysis confirmed that the mean differences were small (from −1.11 to 27.39%), whereas the limits of agreement were relatively wide (from ±28.07 to ±138.64%). Otherwise, the diagnostic accuracy (74.1% with 58.3% sensitivity and 86.7% specificity for DS%; 74.1% with 45.8% sensitivity and 96.7% specificity for %AS) and the diagnostic concordance (k = 0.46 for DS%; 0.45 for %AS) of 3D CTA‑derived anatomic parameters for the detection of severe stenosis were moderate.
Conclusion: 3D advanced imaging reconstruction technique is a helpful tool to promote the use of CTA as an alternative to assess luminal stenosis in clinical practice. Keywords: Three‑dimensional (3D) CT angiography, Digital subtraction angiography, Coronary luminal stenosis
Open Access
© 2015 Guo et al. This article is distributed under the terms of the Creative Commons Attribution 4.0 International License (http:// creativecommons.org/licenses/by/4.0/), which permits unrestricted use, distribution, and reproduction in any medium, provided you give appropriate credit to the original author(s) and the source, provide a link to the Creative Commons license, and indicate if changes were made. The Creative Commons Public Domain Dedication waiver (http://creativecommons.org/publicdomain/ zero/1.0/) applies to the data made available in this article, unless otherwise stated.
RESEARCH
*Correspondence: [email protected]
†Wei Guo, Xin Liu and Zhifan
Gao contributed equally to this work.
2 Institute of Biomedical
Background
Atherosclerotic plaque leads to progressively increasing luminal stenosis, which could result in fatal cardiac events. Coronary angiography is currently the gold standard tech-nique for assessment of coronary lumen stenosis or occlusion [1–4]. However, it is an inva-sive procedure. A catheter should be used to insert into the coronary arteries for injecting dye, which would induce discomfort for the patient. Furthermore, it has limitations of dif-ferentiating plaque components [5]. Therefore, it is of paramount importance to evaluate the lumen stenosis using non-invasive imaging techniques.
During the past decades, CT angiography (CTA) has become a rapidly developing non-invasive imaging technique, which showed promising application in the identifica-tion, visualization and characterization of the coronary artery stenosis [6, 7]. Sun et al. [8, 9] have discussed the application of 63-slice CT in the diagnosis of coronary artery stenosis intensively. Munnur et al. [10] reviewed how to identify the coronary athero-sclerosis, estimate the plaque progression, assess the chest pain in the emergency depart-ment, and evaluate the functional significance of stenosis and the prognostic significance by means of CTA. Sun et al. discussed the dose reduction of CTA and the diagnostic and prognostic values on coronary artery disease. In order to evaluate the ability of CTA to identify atherosclerosis, the performance of coronary CTA has been compared to intra-venous ultrasound (IVUS), IVUS with radiofrequency backscatter (IVUS/VH), single-photon emission CT (SPECT) imaging, or fractional flow reserve (FFR) in many studies [11–15]. Furthermore, more quantitative information was derived from CTA for better diagnosis of coronary artery stenosis. For example, Naganuma et al. [12] compared the quantitative measures [minimal lumen area (MLA), plaque burden, and morphology] derived from CTA to the IVUS, and FFR. One promising technique CTA-derived FFR was developed to evaluate the stenosis inside the coronary artery [16]. From one experi-ment of the sex differences in the visual-functional mismatch using CTA, Park et al. [17] found that female patients might have higher FFR value for any given stenosis compared with male patients. The diagnostic results of CTA could be easily affected, which pro-duces blooming artifacts leading to high false positive rates of coronary stenosis. Sun et al. [18] tried to overcome the problem caused by the heavy calcification in the cor-onary artery through the measurement of left corcor-onary bifurcation angle. More quan-titative measures could be derived from the CTA data, and the clinical value of these measures was examined in 300 patients [19], or was also compared to IVUS [20]. Until now, the prognostic significance of non-invasive coronary CTA for the quantification of luminal stenosis remains controversial. Some previous works reported that anatomic measurements by noninvasive CTA have relatively poor accuracy for the quantification of stenosis severity [21, 22], and for the prediction of hemodynamically significant ste-nosis [21, 23]. For examples, Meijboom et al. [21] demonstrated that the correlation of the percent diameter stenosis (%DS) as determined by CTA and quantitative coronary angiography (QCA) was moderate (R = 0.53; p < 0.001), and the diagnostic accuracy (49%) was weak when CTA was used for the detection of hemodynamically significant stenosis based on FFR <0.75. Joshi et al. [22] showed that there was no relation between CTA and QCA measurements of minimal luminal diameter (MLD, r2 < 0.01, P = 0.57)
or diameter stenosis (DS, r2 = 0.02, P = 0.31). However, other studies demonstrated the
by invasive imaging techniques of IVUS or catheter coronary angiography [4, 24, 25]. For examples, Youssef et al. [4] illustrated that the positive predictive value (PPV) and nega-tive predicnega-tive (NPV) value of CTA for the detection of coronary artery stenosis based on gold standard catheter coronary angiography were 94 and 100%, respectively. Szilard Voros et al. [25] showed that the correlation of the quantitative measurements between CTA and IVUS were significant (r = 0.41–0.84, P < 0.001).
More recently, by the means of advanced imaging reconstruction technique, the evolvement of quantitative CTA measurements derived from three-dimensional (3D) coronary CTA show potential application in accurately diagnosing intermediate-to-severe coronary arterial lesions [4, 24–27], however, 3D CTA-derived luminal meas-urements have not been compared with digital subtraction angiography (DSA), which currently is the gold standard for luminal stenosis assessment. Therefore, the purpose of this study was to investigate the diagnostic value of 3D quantitative CTA in the assess-ment of coronary stenosis using DSA as the standard of reference in patients with inter-pretable coronary arterial stenosis.
Methods
Study population
The ethics committee of Guangdong General Hospital approved this retrospective study and written informed consent was obtained from all the patients or relatives before collect-ing their data. The data acquisition of DSA and CTA were performed in the Department of Cardiology and Department of Medical Imaging, respectively at Guangdong General Hos-pital. Two experienced cardiologists with 10-year experience would check the condition of each patient who was diagnosed with coronary artery disease (CAD), and suitable patients were directed to perform CTA examination. The patients with CAD confirmed by the CTA were then directed to perform DSA examination. Patients with previous coronary bypass grafts and those with coronary stents were excluded. The study population consisted of 23 patients who completed both the CTA and DSA examination from 30th August 2012 to 20th May 2014. The ages of the patients were from 42 to 81 years (62.0 ± 11.9).
Measurements
CT coronary angiography
Digital subtraction angiography
Invasive DSA was performed based on standard institutional protocols by X-ray angio-graphic equipment (Allura Xper FD10 System, Philips Healthcare, Netherland). The pro-jection data acquisition was performed with five views of the left coronary, two views of the right coronary, and two orthogonal views of the target lesion. Once the lesion was identified from DSA data, we performed at least two sets of projection data of DSA in two orthogonal views.
Quantification of stenosis severity
An experienced cardiologist with 10-year experience analyzed the DSA data sets manually. Lumen segments with clearly visible coronary arterial stenosis were marked and meas-ured by hand in the DSA images. MLD and MLA were measmeas-ured in the view with the greatest degree of the stenosis. Proximal reference diameter (PRefD) and distal reference diameter (DRefD) were then measured and averaged to calculate %DS. Correspondingly, proximal reference area (PRefA) and distal reference area (DRefA) were measured and averaged to calculate percent area stenosis (%AS). %DS, %AS were calculated as the fol-lowing formulas:
Another interventional radiologist with 7-year experience supervised the analysis of CTA data. The 3D CTA data were reconstructed over Mimics software (Materialise NV, Belgium) based on standard procedures as follows: First of all, coronary arterial mask construction: coronary arteries were identified from the CTA imaging sequences based on a threshold range which were set according to the different gray values of artery and other issue. Second, 3D modeling: a procedure of 3D calculating was performed with the coronary arterial masks. After that, MLD, PRefD, DRefD, MLA, PRefA and DRefA were measured in the corresponding anatomical position as marked in angiographic data sets. %DS and %AS were calculated according to the above-mentioned formulas.
Statistical analysis
The statistical analysis was performed using SPSS (IBM Company, USA). Continuous vari-ables were expressed as mean ± SD, while categorical variables were expressed as
abso-lute numbers and percentages. The correlation of anatomic measurements (MLD, %DS, MLA, %AS) between CTA and DSA was assessed by Pearson correlation coefficient and linear correlation. A p value of 0.05 or less was considered statistically significant correla-tion. Mean differences and limits of agreement of anatomic measurements (MLD, %DS, MLA, %AS) by CTA and DSA were analyzed using Bland–Altman [29]. Since patients with severe coronary arterial stenosis were suggested to undergo intensive therapy. The diagnostic performance of 3D CTA-derived anatomic parameters (%DS, %AS) for the detection of severe coronary arterial stenosis (as assessed by DSA) was presented as sen-sitivity, specificity, diagnostic accuracy, positive predictive value, and negative predictive value with the corresponding 95% confidence intervals. The severity of coronary arterial lesions were classified with %DS and %AS standard, respectively. Positive was defined as
(1)
%DS =1−MLD/[PRefD + DRefD/2] ×100%
vessels with severe coronary arterial stenosis (%DS ≥ 50% or %AS ≥ 75%). Negative was defined as vessels without severe coronary arterial stenosis (%DS < 50% or %AS < 75%). True positives (TP) were defined as vessels with severe coronary arterial lesions evaluated both by 3D CTA and DSA. True negatives (TN) were defined as vessels without severe coronary arterial lesions evaluated both by 3D CTA and DSA. False negatives (FN) were defined as vessels without severe coronary arterial lesions evaluated by 3D CTA-derived %AS or DS% but with severe coronary arterial lesions evaluated by DSA-derived %AS or DS%. False positives (FP) were defined as vessels with severe coronary arterial lesions eval-uated by 3D CTA-derived %AS or DS% but without severe coronary arterial lesions evalu-ated by DSA-derived %AS or DS%. Sensitivity (Sen, true positive rate) was the calculevalu-ated as TP/(TP + FN). Specificity (Spe, true negative rate) was calculated asTN/(FP + TN). Positive predictive value was calculate as TP/(TP + FP). Negative predictive value was
cal-culate as TN/(FN + TN). The diagnostic concordance by 3D CTA-, and DSA-derived ana-tomic parameters for the detection of vessels with and without severe stenosis calculated as kappa statistics.
Results
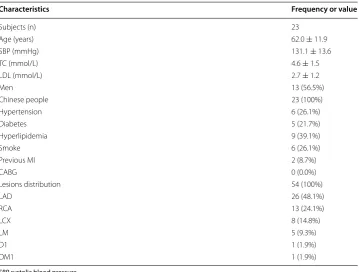
General demographic features of the population are listed in Table 1. Two patients had previous myocardial infarction (MI) and no one had coronary artery bypass graft (CABG). A total 54 lesions were interpretable by both 3D CTA and DSA in the 23 patients. Distri-butions of the coronary lesions in the patients are also listed in Table 1. Of the 54 interpret-able lesions, 26 (48.1%) lesions distributed in the left anterior descending artery (LAD), 13 (24.1%) in the right coronary artery (RCA), 8 (14.8%) in the left circumflex artery (LCX),
Table 1 General demographic parameters and lesions distribution
SBP systolic blood pressure.
Characteristics Frequency or value
Subjects (n) 23
Age (years) 62.0 ± 11.9
SBP (mmHg) 131.1 ± 13.6
TC (mmol/L) 4.6 ± 1.5
LDL (mmol/L) 2.7 ± 1.2
Men 13 (56.5%)
Chinese people 23 (100%)
Hypertension 6 (26.1%)
Diabetes 5 (21.7%)
Hyperlipidemia 9 (39.1%)
Smoke 6 (26.1%)
Previous MI 2 (8.7%)
CABG 0 (0.0%)
Lesions distribution 54 (100%)
LAD 26 (48.1%)
RCA 13 (24.1%)
LCX 8 (14.8%)
LM 5 (9.3%)
D1 1 (1.9%)
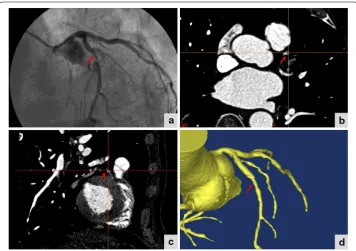
5 (9.3%) in the left main coronary artery (LM), 1 (1.9%) in the first diagonal (D1), and 1 (1.9%) in the first obtuse marginal (OM1). Examples of a same coronary arterial lesion detected by DSA, 2D CTA and 3D CTA are shown in Figure 1. A coronary arterial segment with luminal stenosis (marked with an arrow) by DSA criteria was shown. Corresponding segment on 2D CTA in short axis and in long axis were shown at the position with the greatest degree of the stenosis. Corresponding segment on 3D CTA datasets which were reconstructed from 2D CTA datasets by both short axis and long axis were also shown.
Lesion and reference segment characteristics and the correlation coefficients of ana-tomic measurements between CTA and DSA are listed in Table 2. As shown in the table, the results of Pearson correlation coefficients of anatomic measurements between CTA and DSA showed that 3D CTA-derived %DS had the strongest significant correlation with DSA (r = 0.74, P < 0.001), followed by %AS (r = 0.67, P < 0.001), and then MLD
(r = 0.65, P < 0.001), and the MLA (r = 0.51, P < 0.001).
Figure 1 DSA, 2D CTA, and 3D CTA datasets of the same luminal stenosis. A coronary arterial segment with luminal stenosis (marked with an arrow) by DSA criteria is shown (a). Corresponding segment on 2D CTA in short axis (b) and in long axis (c) is shown at the position with the greatest degree of the stenosis. Corre‑ sponding segment on 3D CTA datasets (d).
Table 2 Lesion and reference segment characteristics
P ≤ 0.05 was considered statistically significant.
Variables DSA 3D CTA Pearson correlation P
MLD lesion (mm) 1.7 ± 0.8 1.6 ± 0.7 0.65 <0.001
Mean reference diameter (mm) 3.2 ± 0.9 2.7 ± 0.7 0.59 <0.001
%DS 47.4 ± 20.9 42.4 ± 17.4 0.74 <0.001
MLA lesion (mm2) 2.9 ± 2.4 3.1 ± 2.2 0.51 <0.001
Mean reference area 8.5 ± 5.1 7.2 ± 3.4 0.620 <0.001
To illustrate the linear relationship more intuitionally, scatterplots with regression lines of MLD, %DS, MLA, and %AS between QCA and 3D CTA are shown Figure 2. The scatterplots confirmed the significant correlation between QCA and 3D CTA for the MLD, %DS, MLA, and %AS.
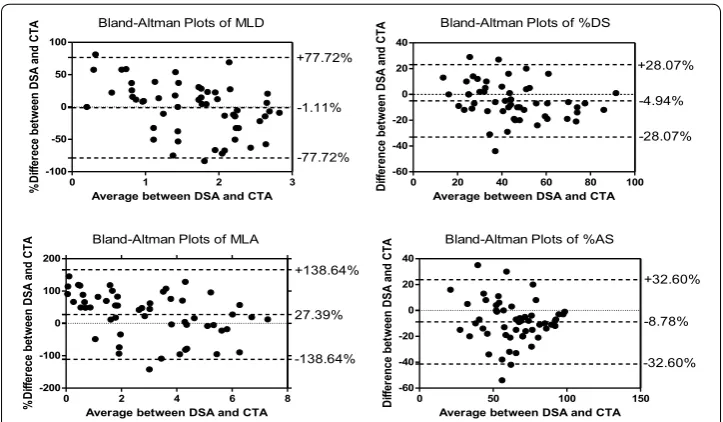
The results of Bland–Altman analysis are shown in Table 3 and in Figure 3. The results illustrated small mean differences (−1.11, −4.94, 27.39, and −8.78% for MLD, %DS, MLA, and %AS, respectively) with relatively wide limits of agreement (±77.72, ±28.07,
±138.64, ±32.60% for MLD, %DS, MLA, and %AS, respectively).
The diagnostic performances of 3D CTA-derived anatomic parameters (%DS, %AS) for the detection of severe coronary arterial stenosis with DSA as the standard of refer-ence are listed in Table 4.
The diagnostic accuracy was 74.1%, the sensitivity was 58.3%, the specificity was 86.7%, the positive predictive value was 77.8%, the negative predictive value was 91.7%, and the receiver operating characteristic curve (ROC) was 0.73 for 3D CTA-derived %DS for the detection of vessels with severe coronary arterial stenosis using DSA as the standard of reference. For 3D CTA-derived %AS, the diagnostic accuracy was 74.1%, the sensitivity
0 1 2 3 4
0 1 2 3
4 Y=0.7+0.5X
R2=0.42
MLD of DSA
ML
D
of
CT
A
0 20 40 60 80 100 0
20 40 60 80
100 Y=13.5+0.6X
R2=0.54
%DS of DSA
%D
S
of
CT
A
0 2 4 6 8 10
0 2 4 6 8
10 Y=1.8+0.5X
R2=0.23
MLA of DSA
ML
A
of
CT
A
0 50 100 150
0 50 100
150 Y=17.1+0.6X
R2=0.45
%AS of DSA
%A
S
of
CT
A
Figure 2 Scatterplots of the anatomic measurements (MLD, %DS, MLA, %AS) between CTA and DSA.
Table 3 Bland–Altman analysis of the anatomic measurements between 3D CTA and DSA Variables Mean difference
(absolute) Limits of agreement (absolute) Mean difference (%) Limits of agreement (%)
MLD −0.13 ±1.29 −1.11 ±77.72
%DS −4.94% ±28.07% −7.90 ±79.05
MLA 0.26 ±4.48 27.39 ±138.64
was 45.8%, the specificity was 96.7%, the positive predictive value was 72.2%, the nega-tive predicnega-tive value was 69.0%, and the ROC was 0.71. The diagnostic concordance by 3D CTA-, and DSA-derived %DS for the detection of vessels with and without severe stenosis was moderate (kappa value of 0.46); and for 3D CTA- and DSA-derived %AS, the result was also moderate (kappa value of 0.45).
Discussion
This study was to investigate the accuracy of 3D quantitative CTA for the assessment of coronary stenosis using DSA as the standard of reference in patients with interpretable coronary arterial stenosis. The key finding of this study was that the statistical correlation between 3D CTA-derived anatomic parameters (MLD, %DS, MLA, %AS) and correspond-ing anatomic parameters derived from DSA were significant (r = 0.51–0.74, P < 0.001), and the Bland–Altman analysis confirmed that the mean differences was small (from
−1.11 to 27.39%).
In our study, the correlations of the anatomic parameters between CTA and DSA were significant. The Pearson correlation coefficients were 0.74, 0.67, 0.65, 0.51 for %DS, %AS, MLD, and MLA, respectively. It is similar to a previous study, which also used 3D CTA technique for the quantification of coronary stenosis. They found significant correlation between CTA- and IVUS-derived anatomic parameters (r = 0.41–0.84, P < 0.001) [24].
Bland-Altman Plots of MLD
0 1 2 3
-100 -50 0 50 100 -1.11% +77.72% -77.72%
Average between DSA and CTA
%D iffe re ce be tw een DS A and CT A
0 20 40 60 80 100
-60 -40 -20 0 20 40 -4.94% +28.07% -28.07% Bland-Altman Plots of %DS
Average between DSA and CTA
Di ffe re nce be tw een DS A and CT A
Bland-Altman Plots of MLA
0 2 4 6 8
-200 -100 0 100 200 27.39% +138.64% -138.64%
Average between DSA and CTA
%D iffe rece be tw een DS A and CT
A Bland-Altman Plots of %AS
0 50 100 150
-60 -40 -20 0 20 40 -8.78% +32.60% -32.60%
Average between DSA and CTA
Di ffer ence be tw een DS A and CT A
Figure 3 Bland–Altman plots of the anatomic measurements (MLD, %DS, MLA, %AS) between CTA and DSA.
Table 4 The diagnostic performances of 3D CTA-derived anatomic parameters (%DS, %AS) for the detection of severe coronary arterial stenosis (as assessed by DSA)
TP TN FP FN Kappa Sen
(%) Spe (%) PPV (%) NPV (%) Diagnostic accuracy (%) ROC area
%DS 14 26 4 10 0.46 58.3 86.7 77.8 91.7 74.1 0.73
These results are better than two previous studies, which use traditional one cross-sec-tional slice for stenosis analysis [21, 22]. In those studies, Meijboom et al. [21] evaluated 89 lesions in 79 patients by CTA and QCA. The subjects were scanned with a 64-slice CT scanner or a dual-source CT scanner. The correlation of the %DS as determined by CTA and QCA was significant, but moderate (R = 0.53; p < 0.001). Joshi et al. [22] evaluated 67 lesions in 55 patients by CTA and DSA. The CTA scans were performed on a 64-slice scanner. The results showed that the correlation between CTA- and QCA-derived minimal luminal diameter (MLD) or diameter stenosis (DS) were not significant. That is, for MLD, r2 < 0.01, P = 0.57; and for DS, r2 = 0.02, P = 0.31. Therefore, 3D CTA
technique shows great potential for improving the accuracy of evaluating coronary ste-nosis. That maybe because that 3D technique can be used for the analysis of the entire vessel segment, while traditional cross-sectional slice can only provide information in two views. Another reason for the improvement of the correlation was the used of the more advanced scanner.
The diagnostic accuracy was moderate in this study (74.1% with 58.3% sensitivity and 86.7% specificity for DS%; 74.1% with 45.8% sensitivity and 96.7% specificity for %AS), which was lower than a previous study [4]. In that study, CTA image sequences were also 3D reconstructed by software, whereas the positive predictive value of CTA in detection of coronary artery significant stenosis was 94% (with 100% sensitivity and 92% specific-ity). That maybe because of the more advanced scanner used in that study (320-slice CT scanner). In our study, CT image series were captured by 256-slice spiral CT scanner. In addition, in our experiment, we noticed that calcifications can obscure the lumen in CTA images, which lead to the overestimation of the stenosis severity when compared with DSA. It is as similar as its influence to 2D CTA [30–32]. Therefore, further study can investigate more details of the accuracy of stenosis assessment using 3D CTA in sub-jects with different degrees of calcification.
A limitation of this study is that the sample size is relativity small, and all the subjects are from a single clinical center. Validation with large sample size and multi center is needed before the clinical application of using 3D CTA as an alternative to assess lumi-nal stenosis. Another limitation of this study is that the diagnostic performance in the detection of severe coronary stenosis was moderate. That may be improved by the use of more advanced CT technique. The CT scanner is 256-slice in our study, however, more advanced CT technique is available nowadays, such as 320-slice.
Conclusions
Abbreviations
2D: two‑dimensional; 3D: three‑dimensional; CTA: computed tomography angiography; DSA: digital subtraction angiogra‑ phy; MLD: minimal lumen diameter; MLA: minimal lumen area; %DS: percent diameter stenosis; %AS: percent area stenosis; CAD: coronary artery disease; PRefD: proximal reference diameter; DRefD: distal reference diameter; PRefA: proximal refer‑ ence area; TP: true positive; TN: true negative; FP: false positive; FN: false negative; SBP: systolic blood pressure; DRefA: distal reference area; LDL: low‑density lipoprotein cholesterol; TC: total cholesterol; CABG: coronary artery bypass graft; LAD: left anterior descending artery; RCA: right coronary artery; LCX: left circumflex artery; LM: left main coronary artery; D1: the first diagonal; OM1: the first obtuse marginal; ROC: receiver operating characteristic curve; Sen: sensitivity; Spe: specificity; PPV: positive predictive value; NPV: negative predictive value; MI: myocardial infarction; QCA: quantitative coronary angiography.
Authors’ contributions
YT Zhang initiated and supported this project. W Guo, X Liu, ZF Gao, and WH Lin participated in the design of the study. X Lin and WH Lin participated in the work of simulation and provided technical supports. WH Lin and HY Zhang drafted the manuscript. W Guo, WH Lin, and N Tan carried out the clinical examination and provided clinical supports, S Pirbhulal checked through all the writing. All authors read and approved the final manuscript.
Author details
1 Department of Cardiology, Guangdong Cardiovascular Institute, Guangdong General Hospital, Guangdong Acad‑
emy of Medical Sciences, Guangzhou, China. 2 Institute of Biomedical and Health Engineering, Shenzhen Institutes
of Advanced Technology, Shenzhen 518055, China. 3 Key Lab for Health Informatics, Chinese Academy of Sciences,
Shenzhen 518055, China. 4 Institute of Clinical Anatomy, Southern Medical University, Guangzhou, China. 5 Department
of Electronic Engineering, The Joint Research Centre for Biomedical Engineering, Chinese University of Hong Kong, Hong Kong, China. 6 Shenzhen College of Advanced Technology, University of Chinese Academy of Sciences, Beijing, China.
Acknowledgements
This work was supported in part by Guang‑Dong Innovation Research Team Fund for Low‑cost Health‑care Technolo‑ gies in China, the Key Lab for Health Informatics of the Chinese Academy of Sciences, the Enhancing Program of Key Laboratories of Shenzhen City (ZDSY20120617113021359), the National High‑tech R&D Program (863 Program) (No. 2012AA02A603), the Shenzhen Innovation Funding (ZDSY20120617113021359, JCYJ20140414170821190, SGLH20131010110119871, GJHZ20140415152115754).
Compliance with ethical guidelines
Competing interests
The authors declare that they have no conflict of interest.
Received: 8 January 2015 Accepted: 7 May 2015
References
1. Dewey M, Rutsch W, Schnapauff D, Teige F, Hamm B. Coronary artery stenosis quantification using multislice com‑ puted tomography. Invest Radiol. 2007;42(2):78–84.
2. Nakazato R, Shalev A, Doh JH, Koo BK, Gransar H, Gomez MJ, et al. Aggregate plaque volume by coronary computed tomography angiography is superior and incremental to luminal narrowing for diagnosis of ischemic lesions of intermediate stenosis severity. J Am Coll Cardiol. 2013;62(5):460–7.
3. Bucek RA, Puchner S, Haumer M, Reiter M, Minar E, Lammer J. CTA quantification of internal carotid artery stenosis: application of luminal area vs. luminal diameter measurements and assessment of inter‑observer variability. J Neu‑ roimaging. 2007;17(3):219–26.
4. Youssef MA, Dawoud MA, Elbarbary AA, Elbedewy MM, Elkhateeb HM. Role of 320‑slice multislice computed tomogra‑ phy coronary angiography in the assessment of coronary artery stenosis. Egypt J Radiol Nucl Med. 2014;45(2):317–24. 5. Neefjes LA, de Feyter PJ. CT coronary angiography: a new unique prognosticator? Heart. 2011;97(17):1363–4. 6. Kopp AF, Kuttner A, Trabold T, Heuschmid M, Schroder S, Claussen CD. Multislice CT in cardiac and coronary angiog‑
raphy. Br J Radiol. 2004;77(1):87–97.
7. Gitsioudis G, Katus HA, Korosoglou G. Assessment of coronary artery disease using coronary computed tomography angiography and biochemical markers. World J Cardiol. 2014;6(7):663–70.
8. Sun Z, Lin C, Davidson R, Dong C, Liao Y. Diagnostic value of 64‑slice CT angiography in coronary artery disease: a systematic review. Eur J Radiol. 2008;67(1):78–84.
9. Sun Z, Almutairi AM. Diagnostic accuracy of 64 multislice CT angiography in the assessment of coronary in‑stent restenosis: a meta‑analysis. Eur J Radiol. 2010;73(2):266–73.
10. Munnur RK, Cameron JD, Ko BS, Meredith IT, Wong DT. Cardiac CT: atherosclerosis to acute coronary syndrome. Cardiovasc Diagn Ther. 2014;4(6):430–48.
11. Fischer C, Hulten E, Belur P, Smith R, Voros S, Villines TC. Coronary CT angiography versus intravascular ultrasound for estimation of coronary stenosis and atherosclerotic plaque burden: a meta‑analysis. J Cardiovasc Comput Tomogr. 2013;7(4):256–66.
12. Naganuma T, Latib A, Costopoulos C, Takagi K, Naim C, Sato K, et al. The role of intravascular ultrasound and quan‑ titative angiography in the functional assessment of intermediate coronary lesions: correlation with fractional flow reserve. Cardiovasc Revascularization Med. 2014;15(1):3–7.
14. Voros S, Joshi P, Qian Z, Rinehart S, Vazquez‑figueroa JG, Anderson H, et al. Apoprotein B, small‑dense LDL and impaired HDL remodeling is associated with larger plaque burden and more noncalcified plaque as assessed by coronary CT angiography and intravascular ultrasound with radiofrequency backscatter: results from the Atlanta I study. J Am Heart Assoc. 2013;2(6):e000344.
15. Sun Z. Evidence for myocardial CT perfusion imaging in the diagnosis of hemodynamically significant coronary artery disease. Cardiovas Diagn Ther. 2015;5(1):58–62.
16. Zarins CK, Taylor CA, Min JK. Computed fractional flow reserve (FFTCT) derived from coronary CT angiography. J Cardiovasc Transl Res. 2013;6(5):708–14.
17. Kang SJ, Ahn JM, Han S, Lee JY, Kim WJ, Park DW, et al. Sex differences in the visual‑functional mismatch between cor‑ onary angiography or intravascular ultrasound versus fractional flow reserve. Jacc Cardiovasc Interv. 2013;6(6):562–8. 18. Xu L, Sun Z. Coronary CT angiography evaluation of calcified coronary plaques by measurement of left coronary
bifurcation angle. Int J Cardiol. 2015;182:229–31.
19. de Graaf MA, Broersen A, Ahmed W, Kitslaar PH, Dijkstra J, Kroft LJ, et al. Feasibility of an automated quantitative computed tomography angiography‑derived risk score for risk stratification of patients with suspected coronary artery disease. Am J Cardiol. 2014;113(12):1947–55.
20. de Graaf MA, Broersen A, Kitslaar PH, Roos CJ, Dijkstra J, Lelieveldt BP, et al. Automatic quantification and charac‑ terization of coronary atherosclerosis with computed tomography coronary angiography: cross‑correlation with intravascular ultrasound virtual histology. Int J Cardiovasc Imaging. 2013;29(5):1177–90.
21. Meijboom WB, van Mieghem CA, van Pelt N, Weustink A, Pugliese F, Mollet NR, et al. Comprehensive assessment of coronary artery stenoses: computed tomography coronary angiography versus conventional coronary angiography and correlation with fractional flow reserve in patients with stable angina. J Am Coll Cardiol. 2008;52(8):636–43. 22. Joshi SB, Okabe T, Roswell RO, Weissman G, Lopez CF, Lindsay J, et al. Accuracy of computed tomographic angiog‑
raphy for stenosis quantification using quantitative coronary angiography or intravascular ultrasound as the gold standard. Am J Cardiol. 2009;104(8):1047–51.
23. Sarno G, Decraemer I, Vanhoenacker PK, de Bruyne B, Hamilos M, Cuisset T, et al. On the inappropriateness of noninvasive multidetector computed tomography coronary angiography to trigger coronary revascularization: a comparison with invasive angiography. Jacc Cardiovasc Interv. 2009;2(6):550–7.
24. Voros S, Rinehart S, Vazquez‑Figueroa JG, Kalynych A, Karmpaliotis D, Qian Z, et al. Prospective, head‑to‑head com‑ parison of quantitative coronary angiography, quantitative computed tomography angiography, and intravascular ultrasound for the prediction of hemodynamic significance in intermediate and severe lesions, using fractional flow reserve as reference standard (from the Atlanta I and II study). Am J Cardiol. 2014;113(1):23–9.
25. Voros S, Rinehart S, Qian Z, Vazquez G, Anderson H, Murrieta L, et al. Prospective validation of standardized, 3‑dimensional, quantitative coronary computed tomographic plaque measurements using radiofrequency backscatter intravascular ultrasound as reference standard in intermediate coronary arterial lesions: results from the Atlanta (assessment of tissue characteristics, lesion morphology, and hemodynamics by angiography with fractional flow reserve, intravascular ultrasound and virtual histology, and noninvasive computed tomography in atheroscle‑ rotic plaques) I study. Jacc Cardiovasc Interv. 2011;4(2):198–208.
26. Rinehart S, Vazquez G, Qian Z, Voros S. Coronary plaque imaging with multi‑slice computed tomographic angiogra‑ phy and intravascular ultrasound: a close look inside and out. J Invasive Cardiol. 2009;21(7):367–72.
27. Rinehart S, Vazquez G, Qian Z, Murrieta L, Christian K, Voros S. Quantitative measurements of coronary arterial ste‑ nosis, plaque geometry, and composition are highly reproducible with a standardized coronary arterial computed tomographic approach in high‑quality CT datasets. J Cardiovasc Comput Tomogr. 2011;5(1):35–43.
28. Li JL, Huang MP, Liang CH, Zhao ZJ, Liu H, Cui YH, et al. Individualized radiation dose control in 256‑slice CT coronary angiography (CTCA) in retrospective ECG‑triggered helical scans: using a measure of body size to adjust tube cur‑ rent selection. Eur J Radiol. 2012;81(11):3146–53.
29. Bland JM, Altman DG. Statistical methods for assessing agreement between two methods of clinical measurement. Lancet. 1986;1(8476):307–10.
30. Arbab‑Zadeh A, Hoe J. Quantification of coronary arterial stenoses by multidetector CT angiography in comparison with conventional angiography methods, caveats and implications. Jacc Cardiovasc Imaging. 2011;4(2):191–202. 31. Vavere AL, Arbab‑Zadeh A, Rochitte CE, Dewey M, Niinuma H, Gottlieb I, et al. Coronary artery stenoses: accuracy
of 64‑detector row ct angiography in segments with mild, moderate, or severe calcification—a subanalysis of the core‑64 trial. Radiology. 2011;261(1):100–8.
32. Schoepf UJ, Zwerner PL, Savino G, Herzog C, Kerl JM, Costello P. Coronary CT angiography. Radiology. 2007;244(1):48–63.
Submit your next manuscript to BioMed Central and take full advantage of:
• Convenient online submission • Thorough peer review
• No space constraints or color figure charges • Immediate publication on acceptance
• Inclusion in PubMed, CAS, Scopus and Google Scholar • Research which is freely available for redistribution