R E S E A R C H
Open Access
Quantification of compensatory processes of
postnatal hypoxia in newborn piglets applying
short-term nonlinear dynamics analysis
Steffen Schulz
1, Sina Reulecke
1, Michael Eiselt
2, Karin Schwab
2, Herbert Witte
2, Bernd Walter
3, Reinhard Bauer
3and
Andreas Voss
1** Correspondence: [email protected]
1
Department of Medical Engineering and Biotechnology, University of Applied Sciences, Jena, Germany
Full list of author information is available at the end of the article
Abstract
Background:Newborn mammals suffering from moderate hypoxia during or after birth are able to compensate a transitory lack of oxygen by adapting their vital functions. Exposure to hypoxia leads to an increase in the sympathetic tone causing cardio-respiratory response, peripheral vasoconstriction and vasodilatation in
privileged organs like the heart and brain. However, there is only limited information available about the time and intensity changes of the underlying complex processes controlled by the autonomic nervous system.
Methods:In this study an animal model involving seven piglets was used to examine an induced state of circulatory redistribution caused by moderate oxygen deficit. In addition to the main focus on the complex dynamics occurring during sustained normocapnic hypoxia, the development of autonomic regulation after induced reoxygenation had been analysed. For this purpose, we first introduced a new algorithm to prove stationary conditions in short-term time series. Then we investigated a multitude of indices from heart rate and blood pressure variability and from bivariate interactions, also analysing respiration signals, to quantify the
complexity of vegetative oscillations influenced by hypoxia.
Results:The results demonstrated that normocapnic hypoxia causes an initial increase in cardiovascular complexity and variability, which decreases during moderate hypoxia lasting one hour (p < 0.004). After reoxygenation, cardiovascular complexity parameters returned to pre-hypoxic values (p < 0.003), however not respiratory-related complexity parameters.
Conclusions:In conclusion, indices from linear and nonlinear dynamics reflect considerable temporal changes of complexity in autonomous cardio-respiratory regulation due to normocapnic hypoxia shortly after birth. These findings might be suitable for non-invasive clinical monitoring of hypoxia-induced changes of autonomic regulation in newborn humans.
Background
The adaptation to extrauterine life, also referred to as transition, involves functional modifications in virtually every organ and bodily system. The most crucial event is the conversion of the fluid-filled lungs into a hollow organ distended with air and capable of gaseous exchange sufficient to warrant extrauterine life. Although the majority of newly born humans establish normal respiratory and circulatory function, 1-2% may run into difficulties due to a disturbance to the normal adaptive processes required for a smooth transition from intrauterine to extrauterine life [1]. Under such circumstances, sustained systemic hypoxia (for review see [2]) is a common consequence and may lead to fatality or severe lifelong disabilities in case of a progressive lack of oxygen. However, moderate systemic hypoxia of a lower degree is compensated by the neonate during a prolonged time period [3]. This is due to a well-established and coordinated neuroendocrine response to systemic hypoxia which functions at birth and is controlled mainly by com-plex autonomic processing. However, there is a lack of knowledge about the time- and intensity-related alterations of autonomic activity in cardio-respiratory control under hypoxic conditions during the newborn’s first period of life. The newborn piglet achieves a degree of maturity at birth similar to that of humans with regard to cardiovascular reg-ulation [4]. Therefore, this species have been considered to be an excellent sub-primate laboratory model for comparison studies with human infants. Previous studies using a swine model have shown that hypoxia causes alterations in the autonomic system. Zwi-ener [5] investigated deterministic-chaotic properties that changed after exposure to hypoxia. Gootman [3] determined that hypoxia leads to increased sympathetic activity and to augmented respiratory modulation, but that vagal innervations are inhibited. Eva-luations of heart rate variability changes were performed by Sica & Zhao [6] with a focus on linear methods as spectral features. In these studies mainly linear measures from time- and frequency domains [3,6-9] were applied.
Nonlinear methods were considered only in a few studies. Zwiener [5] investigated hypoxia, analysing signals from the autonomic nerve system using the correlation dimension, Lyapunov exponent and phase space plots. However, these classical non-linear methods suffer from the dimensionality curse and require a large number of data points in the time series to reliably estimate the nonlinear features. Unfortunately, this prevents the analysis of short-term time series and the interactions between differ-ent signals due to the complex autonomic regulation. On the other hand nonlinear measures based on entropy estimation as Approximate Entropy (ApEn) or Sample Entropy (SampEn) were able to quantify heart rate irregularity with short segments during episodes of mechanical ventilation and acute anoxia in rats[10]. Though, to determine the nonlinear interplay of various physiological control loops, a multivariate approach based on a combination of different linear and nonlinear parameters is required [11,12]. Short-term dynamics due to sustained hypoxia have not been investi-gated in very young spontaneously breathing piglets thus far. Further, there is only lim-ited information about the complex interactions between cardiovascular and respiratory signals that are altered during the dynamic development from normoxia to hypoxia and subsequently during reoxygenation.
nonlinear dynamics analysis. Moreover, the temporal and complex development of the autonomic regulation had to be explicitly considered between the phases inside states according to normoxia, hypoxia and reoxygenation. For this purpose, a new algorithm for testing stationarity in a short-term time series was introduced. Linear and especially non-linear methods were then applied to stationary time series (cardiovascular and respiratory) to investigate the complexity of physiological dynamics inherent in the autonomous sys-tem [13]. Several of these nonlinear dynamics have been proven to be of diagnostic rele-vance or have contributed to risk stratification [12]. We hypothesize that linear and especially nonlinear short-term indices, when applied to cardiovascular and respiratory signals, can reveal alterations and changes in complexity during the autonomic regulation process of piglets due to their adaptation to hypoxia. Hence, a greater comprehension of temporal and intensity characteristics of autonomic tone might be possible with regard to the adaptive capacity of newborns during a reduced and re-established oxygen supply. In addition, findings from this study could be useful in the paediatric field for the purpose of recognizing and monitoring hypoxic effects in human newborns.
Methods
Animals and experimental procedure
Animal data were used from seven piglets enrolled in a previous study to estimate the effect of artificial ventilation on regional blood flow and on cardiovascular regulation in newborns [14]. The study was approved by the Committee of the Thuringian State Government for Animal Research. The animals were managed in accordance with the guidelines of the American Physiological Society. In the previous study these seven new-born piglets (2-3 days old, 1.71 ± 0.15 kg b.w.) served as a reference group, breathing spontaneously under normoxia and normocapnic hypoxia. They were initially anesthetized with 2.5% isoflurane in nitrous oxide and were given oxygen via a mask. They were main-tained throughout the surgical procedure using 1.3% isoflurane in order to record cardio-respiratory signals. During the first 60 minutes, animals stayed under resting conditions (normoxia). After monitoring the resting state, the inspired oxygen fraction was reduced from 0.3 to about 0.1 via an appropriate exchange with nitrogen, causing a normocapnic hypoxia for approximately 60 min. Finally the gas mixture was re-established to record recovery over a time period of 30 min (reoxygenation).
Data acquisition and pre-processing
stationarity, superimposed noise and signal pre-processing (filtering) [12]. Therefore, it became necessary to set up pre-selection criteria. Due to the bi- and multivariate approaches which had been applied in our analyses, it was necessary that adequate pro-cessable signals (namely ECG, blood pressure and respiration) with sufficient signal quality and without artefacts were simultaneously available for further processing. Because of the previous study design [14], the aforementioned requirements for signal quality were not present all the time during the investigation. An additional criterion was stationarity due to the fact that some of the applied methods (namely frequency domain analysis and cross conditional entropy) need stationarity conditions.
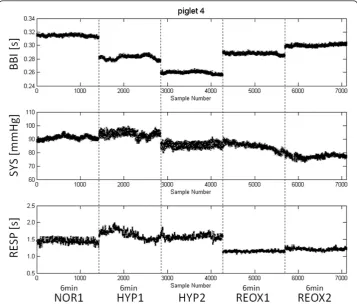
Stationarity requires that statistical properties such as mean and standard deviation of the investigated time series remain the same throughout the investigated time per-iod. Therefore, we applied a test where the extracted time segments fulfilled our pre-selection criteria (involving stationarity) in all piglets. Subsequently, the dynamic beha-viour before, during and after hypoxia was investigated to analyse the changes in auto-nomic regulation. For this purpose, two sections, each six minutes in length, were selected from raw data records for the states of hypoxia and reoxygenation (Figure 1). One six-minute phase from the beginning of normoxia (NOR1) was used for subse-quent comparison with the early hypoxia- (HYP1), late hypoxia- (HYP2), early reoxy-genation- (REOX1) and late reoxyreoxy-genation- (REOX2) phases (Figure 2).
Heart rate time series (tachogram) consisting of successive beat-to-beat intervals (BBI) as well as systolic (SYS) and diastolic (DIA) blood pressure values were extracted from data records. Then these time series were filtered by applying an adaptive variance estimation algorithm to remove and interpolate ventricular premature beats and artefacts (e.g. movement, electrode noise and extraordinary peaks) to obtain a nor-mal-to-normal beat time series (NN) [15]. The phase of respiration was calculated to generate the interval times between consecutive breathing cycles (RESP). For the pur-pose of interaction analyses all four signals were resampled with a frequency of 4 Hz to obtain synchronised time series.
The extraction of stationary phases Algorithm:
1. Dividing the entire BBI time series of NOR, HYP and REOX into two equal parts.
2. Calculation of the:
a. mean valuemeanBBI6 min[ms], b. standard deviationsdBBI6 min[ms] and
c. variation ratio vrBBI6min= sdBBI6min
meanBBI6min3[1/ms 2]
for Soverlapping subsequences (shift = 1 minute) of 6 minutes window length. 3. Extracting the phase with the smallestvrBBI6 min.
Test of stationarity
The stationarity of each calculated phase was subsequently controlled using the follow-ing algorithm:
1. Calculations of global mean (global_mean) and global standard deviation (glo-bal_std) from the entire time series.
2. Calculation of two local mean (local_mean) and local standard deviation (local_std) values for the first and second halves of the extracted stationary phase. 3. Computation of the absolute differencesd_meanandd_stdbetween the global and local value each for bothmeanandstd.
d mean(i) =abs(global mean−local mean(i)) (1)
d std(i) =abs(global std−local std(i)); i= 1, 2 (2)
4. Determination of the deviation percentage between the two differences formean andstd values respectively to quantify the degree of stationarity of the extracted phase.
dev mean[%] =abs(1−(d mean(1)/d mean(2))) (3)
dev std[%] =abs(1−(d std(1)/d std(2))) (4)
The results of stationarity analysis showed that averaged local_meandiffered less than 1% while local_std changed to maximally 5%. Due to these marginal deviations, the extracted phases could be evaluated as stationary and were thus used for analysis.
Analysing autonomic regulation
Heart rate variability (HRV) and blood pressure variability (BPV) were quantified by well established indices of time- and frequency domains [16] and nonlinear dynamics [12], calculated from univariate cardiovascular and respiratory signals (BBI, SYS, DIA and RESP). For bivariate analyses, well-established and validated nonlinear methods, that investigate pair-wise interactions between cardiovascular and respiratory signals, were also applied. In addition, all possible combinations of cardiovascular- and cardio-respiratory interactions were analysed (i.e.BBI-SYS, BBI-DIA, BBI-RESP,DIA, SYS-RESP and DIA-SYS-RESP).
Time and frequency domains
Using the time domain, the following standard indices were calculated:
•meanNN- the mean value of the NN-intervals [ms]; •sdNN- standard deviation of the NN-intervals [ms].
To estimate the power spectra of the time series, Fast Fourier Transform with a Blackman Harris window function (to avoid leakage effects) was applied to every com-plete phase. Frequency domain indices were adapted to temporal and spectral features of neonatal cardiovascular signals [17]: very low frequency power (0.005 - 0.04 Hz), low frequency power (0.04 - 0.25 Hz) and high frequency power (0.25 - 0.85 Hz).
Symbolic Dynamics
long-term time series [13,18]. Symbolic dynamics are based upon a coarse-graining of a system’s dynamics. The well-established algorithm ofSD is performed as follows: to classify dynamic changes within the time series they were first transformed into a sym-bol sequence of four symsym-bols using the alphabet A={0,1,2,3}. Three successive symbols (k= 3; k - word length) were used to characterise symbol strings whereby 64 different word types (bins) were obtained (000, 001, ..., 333) according to the transformation [19]. The resulting histogram contains the probability distribution of each single word type within a word sequence. The following indices from this probability distribution were estimated forBBI, SYS and DIA:
•wpsum02- a relative portion (sum/total) of words consisting of only the symbols ‘0’and‘2’to measure decreased HRV[%]
•wd_renyi1- Renyi entropy of the word type distribution witha= 0.25 as a mea-sure of complexity [bit].
The factor a = 0.25 [13] determines the probability distributionpi of words in the
histogram. If 0<a, words with small probabilities will mainly determine the value of Hrenyi(a).
Joint symbolic dynamics
To characterize the nonlinear interactions of cardiovascular- and cardio-respiratory inter-dependencies the method of Joint Symbolic Dynamics (JSD) was used. This method is based on the analysis of coarse-grained dynamic processes by means of symbols [13,20,21]. Here cardiovascular- (BBI-SYS) and cardio-respiratory (BBI-RESP) time series were transformed into symbol sequencessof different words according to the transforma-tion rules. Only a short alphabet A={0,1} was used for the symbol sequences whereby increasing values were coded as‘1’and decreasing- and unchanged values were coded as ‘0’, respectively. Therefore, short patterns (words of length 3) were formed. From each word type (k = 64) the normalized probability occurrences were estimated (JSD-JSD64) using an8 × 8word distribution density matrix (rows -BBI, columns -SYS, RESP, respec-tively). The advantages ofJSDare that it considers all types of interval changes and that a rough assessment of the overall cardiovascular- and cardio-respiratory regulation of short-term interactions is obtained. The following indices were estimated:
•BBI_SYS_JSD- normalised probability occurrence of specific word types of heart rate- and systolic blood pressure time series [‰];
•BBI_RESP_JSD- normalised probability occurrence of specific word types of heart rate- and inspiratory cycle time series [‰].
The interaction of heart rate time series and diastolic blood pressure time series as well as systolic and diastolic blood pressure time series were not performed due toJSD is not validated for these interactions so far.
Poincaré plot analysis
heart beat dynamics with trends [22,23]. The Poincaré plots are two-dimensional graphi-cal representations of each value of eitherBBI, SYS, DIAorRESPtime series plotted against the subsequent value. The Poincaré plot typically illustrates an elongated cloud of points oriented along the line of identity. For the purpose of graphical illustration, an ellipse based on the shape of the point cloud can be drawn in the plot, whereas the cen-tre of the ellipse represents the mean value. The Poincare’plot is based on the notion of different temporal effects due to changes in the vagal and sympathetic modulation of vegetative parameters, without requirement of stationarity in the time series [24]. In gen-eral, three indices are calculated based on the Poincaré plots [22,25,26]. In this study we calculated the two standard deviations, namelySD1(the ellipse’s minor axis) measuring short-term variability, andSD2(the ellipse’s major axis), quantifying long-term variabil-ity from theBBI, SYS, DIAandRESPtime series.
Segmented Poincaré plot analysis
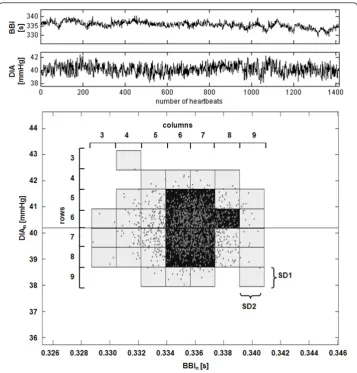
The Segmented Poincaré Plot Analysis (SPPA) is a quite new enhancement of thePPA. Compared to standard PPA, SPPAavoids linear correlation and analyses nonlinear fea-tures of dynamic systems [27,28]. In addition to the standardPPA the graphical repre-sentation is divided into sections of 12 symmetrical columns and rows concentrated around the mean value of the scatter plot. The proximity of the particular sections depends on the indices SD1 andSD2 calculated by the PPA. The determined indices represent the percentage of points in each column and row at the rate of all points (Figure 3).
In our study SPPA was applied to analyse univariate signals as well as the interac-tions between two signals. To provide an example, we calculated the following index:
•BBI_DIA_col5- percentage of points in the fifth column of the Poincaré plot of BBInvs. synchronous diastolic blood pressure values (DIAn).
Cross conditional entropy
Cross Conditional Entropy (CCE) provides quantification of the degree of coupling between two signals [29]. Synchronisation occurs when interactive dynamics between two signals are repetitive. Initially the signals are embedded into multiple dimensions. For each dimension the conditional entropy (CE) modified from the Shannon entropy is calculated.CEis a process of sorting and counting mixed patterns and describes the amount of information included in the sample ywhen the patternuis given. Based on CE, one can define the synchronisation index which quantifies the amount of informa-tion exchanged between the two signals uandy [29]. The larger the synchronisation index, the more coupled are the two signals. In our studyCCEwas applied to all possi-ble combinations of cardiovascular- and cardio-respiratory interactions. For example, we calculated the indexSYS_DIA_SI in order to quantify the coupling between systolic and diastolic blood pressure.
Statistics
the piglet’s data. Moderate univariate significances were considered for values of p < 0.05 (*) and high significances for values of p < 0.01 (**). To verify t-test usage, the Kolmogorov-Smirnov-Test (KS-test) was performed in advance (normal distribution). In addition, adjustments to statistics were applied via multiple testing using the Bonfer-roni-Holm method [30] to confirm the t-test results (#). Descriptive statistics were used to describe the basic features of the data in terms of mean value (mean) and stan-dard deviation (std).
Results
Table 1 Univariate selected parameters for discrimination between normoxia (NOR1), early hypoxia (HYP1), late hypoxia (HYP2), early reoxygenation (REOX1) and late reoxygenation (REOX2)
NOR1 vs. HYP1
NOR1 vs. HYP2
NOR1 vs. REOX1
NOR1 vs. REOX2
NOR1 HYP1 HYP2 REOX1 REOX2
method parameter p p P p Mean ± std mean ± std mean ± std mean ± std mean ± std
HRV BBI_meanNN (ms) *# **# **# *# 358.02 ± 41.57 296.03 ± 37.77 279.05 ± 40.19 297.19 ± 28.09 295.89 ± 31.83
BBI_sdNN (ms) * n.s. n.s. n.s. 2.28 ± 1.20 4.49 ± 2.78 2.11 ± 0.69 2.77 ± 1.25 3.25 ± 3.72
BBI_LFn (a.u.) n.s. n.s. n.s. n.s. 0.41 ± 0.21 0.52 ± 0.19 0.37 ± 0.30 0.38 ± 0.14 0.39 ± 0.20
BBI_HFn (a.u.) n.s. n.s. n.s. n.s. 0.59 ± 0.21 0.48 ± 0.19 0.63 ± 0.30 0.62 ± 0.14 0.61 ± 0.20
BBI_LF/HF (a.u.) n.s. n.s. n.s. n.s. 0.93 ± 0.78 1.47 ± 1.17 1.10 ± 1.31 0.68 ± 0.35 0.78 ± 0.55 BPV SYS_meanNN (mmHg) n.s. n.s. n.s. n.s. 93.95 ± 10.69 99.02 ± 23.89 100.81 ± 27.10 95.75 ± 16.78 90.89 ± 17.03
SYS_sdNN (mmHg) * n.s. n.s. n.s. 1.75 ± 0.86 3.28 ± 1.84 2.73 ± 1.09 2.10 ± 0.75 2.34 ± 1.93
SD BBI_wpsum02 (a.u.,‰) n.s. **# n.s. n.s. 99.70 ± 0.03 97.10 ± 4.69 99.77 ± 0.03 99.49 ± 0.50 95.93 ± 9.37
SYS_wd_renyi1 (bit) **# **# n.s. n.s. 2.34 ± 0.24 2.92 ± 0.32 2.84 ± 0.26 2.53 ± 0.40 2.63 ± 0.41
DIA_wd_renyi1 (bit) **# *# *# * 2.82 ± 0.51 3.48 ± 0.23 3.43 ± 0.46 3.42 ± 0.22 3.39 ± 0.39 PPA BBI_SD1 (ms) n.s. n.s. n.s. n.s. 0.99 ± 0.29 0.93 ± 0.26 0.97 ± 0.24 1.06 ± 0.42 1.23 ± 0.72
SYS_SD1 (ms) **# **# *# n.s. 0.70 ± 0.09 1.05 ± 0.21 1.03 ± 0.26 0.90 ± 0.16 0.91 ± 0.30
DIA_SD1 (ms) **# **# n.s. * 0.85 ± 0.13 1.42 ± 0.44 1.51 ± 0.60 1.10 ± 0.28 1.16 ± 0.30 SPPA RESP_row8 (%) n.s. n.s. **# n.s. 12.40 ± 2.29 10.01 ± 4.50 8.86 ± 4.78 8.21 ± 2.15 11.73 ± 2.87
BBI_DIA_col5 (%) * n.s. n.s. n.s. 13.86 ± 3.24 18.82 ± 4.61 13.87 ± 4.57 13.13 ± 4.34 13.66 ± 3.74 JSD BBI_SYS_JSD (a.u.,‰) * * n.s. n.s. 15.18 ± 4.48 8.66 ± 6.46 7.72 ± 4.79 13.34 ± 5.15 12.79 ± 4.92
BBI_RESP_JSD (a.u.,‰) n.s. n.s. * **# 9.40 ± 3.34 5.05 ± 4.43 5.86 ± 5.47 3.99 ± 3.93 3.23 ± 2.25 CCE SYS_DIA_SI (a.u.) **# **# n.s. n.s. 0.06 ± 0.01 0.11 ± 0.05 0.13 ± 0.07 0.07 ± 0.02 0.09 ± 0.04
(HRV - Heart Rate Variability; BPV - Blood Pressure Variability; SD - Symbolic Dynamics; JSD - Joint Symbolic Dynamics; (S)PPA - (Segmented) Poincaré Plot Analysis; CCE - Cross Conditional Entropy; mean - mean value; std - standard deviation; * - p < 0.05; ** - p < 0.01; n.s. - not significant; # - significant after Bonferroni-Holm adjustment.)
.
BioMedical
Engineering
OnLine
2011,
10
:88
-engineering
-online.com/c
ontent/10/1/8
8
Page
10
of
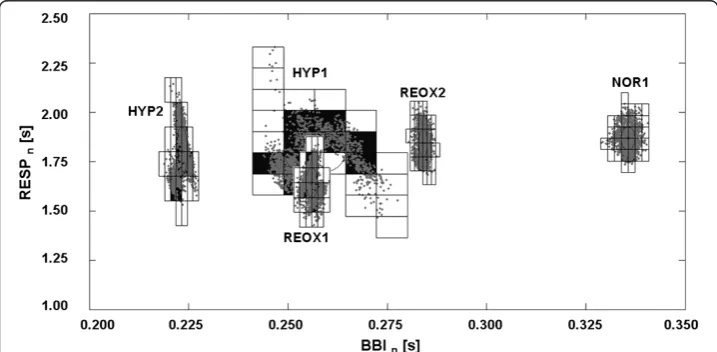
various significant trends. Indices from JSDandSPPA(Figure 4) also revealed high significances for the group tests between NOR1 and REOX1 or REOX2.
Linear dynamics
In this context the value of theHRVindexBBI_meanNNdecreased from NOR to HYP2 and revealed an increased significance level (p = 0.005). During the process of reoxygena-tion, the value ofBBI_meanNNslightly increased, but remained significantly decreased (p = 0.01) in comparison to NOR1. Another time domain parameter, namelyBBI_sdNN, was significantly (p = 0.04) higher within the HYP1 group compared to NOR1. During the process from HYP2 to REOX2, this index showed a transient trend to values similar to NOR1. RegardingBPVanalysis, indices showed no significant changes for mean values, but instead an altering progression for blood pressure variance. As a result, the time domain indexsdNNincreased significantly for both systolic and diastolic blood pressure (SYS: p = 0.05,DIA: p = 0.02) in HYP1 compared to NOR1.
The mean value of the ratio of the powers in the low (LF) and the high (HF) fre-quency range, LF/HF, from NN-intervals was higher in hypoxia than in normoxia and reoxygenation. However these indices revealed no significant differences caused by relatively high std, but LFpower tend to increase due to hypoxia.
Nonlinear dynamics
SDcomplexity measurewpsum02, a measure for decreasedHRV, significantly increased (p = 0.005) in HYP2 forBBI. ConcerningBPV, the complexity indexwd_renyi1showed high significances for both systolic and diastolic blood pressure for the comparison between NOR1 and HYP1. This parameter lasted high significantly increased forSYS and moderate significantly forDIAduring HYP2. During reoxygenationSYS_wd_renyi1 adapted to values similar to NOR1 without any significant differences whileDIA_wd_ renyi1maintained significantly (p = 0.05) increased. Short-term blood pressure fluctua-tions were found to be high significantly (p = 0.001) increased during both hypoxia
states. This was revealed by thePPAindexSD1. According toJSD, the significances of indexBBI_RESP_JSDrevealed an increasing trend (from p = 0.017 to p = 0.003) during reoxygenation. This index describes the percentage of contrary cardio-respiratory inter-actions which significantly decreased from REOX1 to REOX2. Confirmedly, the univari-ateSPPAindexRESP_row8showed a high significance (p = 0.004) for group test NOR1 vs. REOX1. On the contrary, the cardiovascular indexBBI_SYS_JSDsignificantly (p = 0.014) declined in HYP1 and HYP2 compared to NOR1. During the investigation of dif-ferences caused by hypoxia, significant results were also found using theCCEmethod. In this regard, the synchronisation indexSYS_DIA_SI, describing the coupling quantity of DIAandSYS(synchronisation), increased high significantly (p = 0.009) for both hypoxia states.
Discussion
In this study we analysed the effect of hypoxia on autonomic regulation in newborn piglets by applying linear and nonlinear methods to cardiovascular and respiratory sig-nals. The results indicated that control mechanisms of the autonomic nervous system (ANS) in newborn piglets are influenced considerably by exposure to a hypoxic condi-tion as well as to the inversion to normoxia. The results demonstrated that hypoxic conditions lead to an increase in sympathetic activity which decreases during the hypoxia process. This is in accordance with other studies concerning the analysis of autonomic regulation in piglets exposed to hypoxia [3,5,9,14,31-33]. These findings indicate that hypoxia induces time-dependent changes in the cardiovascular and respiratory nervous system. In fact, acute normocapnic hypoxia decreases cardiac vagal tone and increases sympathetic activity resulting in an increased respiration rate and heart rate. After resetting the normoxic supply, cardiovascular and respiratory response diminished as the indices variably changed to conditions similar to those observed before hypoxic exposure.
SYS_meanNN andDIA_meanNNdid not change significantly during the entire investi-gation. This is in accordance with a study by Gootman [3] showing that no significant changes in blood pressure amplitude are characteristic of premature responses to sti-mulation of baroreceptors and cardiopulmonary receptors. Moreover, they suggest a direct, hypoxia-induced, stimulation of the sympathetic nervous system (HR increase), overriding any baroreceptor inhibition due to the 10% increase in blood pressure.
In addition indices derived from frequency domain revealed no significances in dis-criminating groups although a shift ofLFandHFcomponents towards higher frequen-cies was noticed as described by Sica [9], reflecting much higher respiratory and heart rates. Respiration peaks were mostly located at high frequency range between 0.5 and 0.8 Hz associated with vagal control of heart rate [31]. The progress ofHRV indexLF/ HF indicated to a parasympathetic withdrawal and an ongoing sympathetic predomi-nant activation in autonomic tone during hypoxia (Table 1). These influences dimin-ished after reversal to reoxygenation.
The nonlinear HRVindexBBI_wpsum02 showed an increased complexity ofBBIat the beginning of hypoxia. Therefore the symbol-coded time series of the early hypoxic BBI included more different word types, indicating higher complexity. At the end of the hypoxic state this trend reversed because HRV complexity measureBBI_wpsum02 significantly increased. Hence, a higher number of words including only symbols “0” and “2” implies lower variability and, as a result, less complexity [35]. Likewise, the entropy index wd_renyi1revealed a higher complexity for both systolic and diastolic blood pressure under hypoxic conditions. An increased complexity in blood pressure was also found by Voss [36] in patients with dilated cardiomyopathy, observed by Shannon entropy. This specific heart disease and normocapnic hypoxia represent risk states for humans and animals that can be recognized via an increased blood pressure complexity. The nonlinear PPAmethod could support these findings on the basis of increased short-term variability (SD1). This index was produced clearer results than linear variability measures, although a high correlation between these indices is given.
According to bivariate analysis using nonlinear methods, findings showed that cardi-ovascular and respiratory signals from newborn piglets imply not only linear but also nonlinear properties which were altered by the autonomous system as a result of nor-mocapnic hypoxia. Results ofSPPA,JSDandCCEanalyses are in accordance with find-ings by Zwiener [5], confirming the existence and alterations of linear and nonlinear properties in cardiovascular and respiratory signals recorded from newborn piglets. Analyses fromJSD pointed out different results for cardiovascular interactions in con-trast to cardio-respiratory interactions. The indexBBI_SYS_JSD, determining cardiovas-cular interactions, decreased significantly during prolonged normocapnic hypoxia. This result could be a reference to less vagal activity due to normocapnic hypoxia. Contrast-ingly, the index BBI_RESP_JSD, manifesting the extent of vagal modulation between heart and respiratory rates, showed a continuously decreasing trend during reoxygena-tion. This index was reduced for all hypoxic and recovery periods, which suggests a high BBI-RESPcoherence and a pronounced respiratory sinus arrhythmia (RSA) after restored oxygen ratio [5].
than by blood pressure fluctuations. Presumably, hypoxic exposure is a severe interfer-ence to the newborn piglet whose immature autonomous system, especially with regard to respiration regulation, needs time to adapt to recovered oxygen fraction. SPPA indices discriminated groups involving both univariate and bivariate analyses. Percentages of data points related to specific columns and rows in the Poincaré plot were thus either significantly increased or decreased during normocapnic hypoxia. One noticeable SPPA index was BBI_DIA_col5. This index revealed an increase in point percentage caused by hypoxia which showed ratios equal to values for normoxic condi-tions already in the late hypoxia stage and following periods. The univariate SPPA indexRESP_row8could contribute to the results of cardio-respiratory analyses in that the JSD findings reflect ongoing respiratory regulatory processes other than those found in normoxia. Nonlinear dynamics to investigate the synchronisation of two sig-nals were applied using the CCE method, calculating entropies as measures of com-plexity. Regarding CCE, the blood pressure time series revealed a highly significant synchronisation indexSYS_DIA_SIfor HYP1 and HYP2, suggesting a high predictabil-ity level forDIAwhenSYSis given. The potential reason for the higher blood pressure synchronisation could be the augmented peripheral vasoconstriction, due to increased sympathetic activity during normocapnic hypoxia [34]. After initialising recovery, the synchronisation index decreased in the direction of normoxic values.
A limitation of this study is the small sample number of analysed newborn piglets (N = 7). In experimental animal studies, however, it is usual to investigate such “ small-numbered”samples, especially in the case of newborns. Furthermore, the large amount of determined indices (n>100) from uni- and bivariate signal analyses in combination with the small sample size could influence the results of statistical significance tests. Therefore, a statistical adjustment was performed in addition by multiple testing using the Bonferroni-Holm method [30] to confirm the t-test results.
Conclusions
compensatory processes of the newborn autonomous system due to postnatal hypoxia and reoxygenation.
Abbreviations List
ANS: Autonomic nervous system; BBI: Beat-to-Beat Interval; BPV: Blood Pressure Variability; CCE: Cross Conditional Entropy; DIA: Diastolic blood pressure; ECG: Elec-trocardiogram; HRV: Heart Rate Variability; JSD: Joint Symbolic Dynamics; NN: Nor-mal-to-Normal beat interval; PPA: Poincaré Plot Analysis; SD: Symbolic Dynamics; SI: Synchronisation Index; Std: Standard deviation; SYS: Systolic blood pressure; RSA: Respiratory Sinus Arrhythmia.
Acknowledgements
This study was partly supported by grants from Deutsche Forschungsgemeinschaft (DFG-VO 505/8-1 and DFG-VO 505/8-2).
Author details
1
Department of Medical Engineering and Biotechnology, University of Applied Sciences, Jena, Germany.2Institute of Medical Statistics, Computer Sciences and Documentation, Friedrich-Schiller-University, Jena, Germany.3Institute of
Molecular Cell Biology, University Hospital, Friedrich-Schiller-University, Jena, Germany.
Authors’contributions
BW and RB conducted the animal experiment and collected and assembled the data. SS and SR drafted the article and analysed and interpreted the data. ME, KS, HW and RB are well-versed in newborn physiology and participated in manuscript revision. AV conceived the study and critically revised it for significant intellectual content. All authors gave final approval of the version to be published.
Competing interests
The authors declare that they have no competing interests.
Received: 6 June 2011 Accepted: 3 October 2011 Published: 3 October 2011
References
1. Sinha SK, Donn SM:Fetal-to-neonatal maladaptation.Semin Fetal Neonatal Med2006,11:166-173. 2. Bauer R:Stupor and coma: pathophysiology of hypoxia–ontogenetic aspects.Suppl Clin Neurophysiol2004,
57:681-687.
3. Gootman PM, Gootman N:Postnatal changes in cardiovascular regulation during hypoxia.Adv Exp Med Biol2000, 475:539-548.
4. Gootman PM, Gootman N, Buckley BJ:Maturation of central autonomic control of the circulation.Fed Proc1983, 42:1648-1655.
5. Zwiener U, Hoyer D, Bauer R, Luthke B, Walter B, Schmidt K, Hallmeyer S, Kratzsch B, Eiselt M:Deterministic–chaotic and periodic properties of heart rate and arterial pressure fluctuations and their mediation in piglets.Cardiovasc Res1996,31:455-465.
6. Sica AL, Zhao N:Heart rate variability in conscious neonatal swine: spectral features and responses to short-term intermittent hypoxia.BMC Physiol2006,6:5.
7. Gootman PM, Gandhi MR, Coren CV, Kaplan NM, Pisana FM, Buckley BJ, Armour JA, Gootman N:Cardiac responses elicited by stimulation of loci within stellate ganglia of developing swine.J Auton Nerv Syst1992,38:191-200. 8. Gootman PM, Hundley BW, Sica AL:The presence of coherence in sympathetic and phrenic activities in a
developing mammal.Acta Neurobiol Exp (Wars)1996,56:137-145.
9. Sica AL, Ruggiero DA, Zhao N, Gootman PM:Developmental changes in heart rate variability during exposure to prolonged hypercapnia in piglets.Auton Neurosci2002,100:41-49.
10. Goncalves H, Henriques-Coelho T, Bernardes J, Rocha AP, Nogueira A, Leite-Moreira A:Linear and nonlinear heart-rate analysis in a rat model of acute anoxia.Physiol Meas2008,29:1133-1143.
11. Cerutti S, Hoyer D, Voss A:Multiscale, multiorgan and multivariate complexity analyses of cardiovascular regulation.
Philos Transact A Math Phys Eng Sci2009,367:1337-1358.
12. Voss A, Schulz S, Schroeder R, Baumert M, Caminal P:Methods derived from nonlinear dynamics for analysing heart rate variability.Philos Transact A Math Phys Eng Sci2009,367:277-296.
13. Voss A, Kurths J, Kleiner HJ, Witt A, Wessel N, Saparin P, Osterziel KJ, Schurath R, Dietz R:The application of methods of non-linear dynamics for the improved and predictive recognition of patients threatened by sudden cardiac death.Cardiovasc Res1996,31:419-433.
14. Zwiener U, Bauer R:Marked reduction of brainstem blood flow in artificially ventilated newborn piglets during normoxia and normocapnic hypoxia.Intensive Care Med2003,29:2277-2284.
16. Heart rate variability. Standards of measurement, physiological interpretation, and clinical use. Task Force of the European Society of Cardiology and the North American Society of Pacing and Electrophysiology. Eur Heart J Task Force1996,17:354-381.
17. Lasky RE, Parikh NA, Williams AL, Padhye NS, Shankaran S:Changes in the PQRST intervals and heart rate variability associated with rewarming in two newborns undergoing hypothermia therapy.Neonatology2009,96:93-95. 18. Kurths J, Voss A, Saparin P, Witt A, Kleiner HJ, Wessel N:Quantitative analysis of heart rate variability.Chaos1995,
5:88-94.
19. Voss A, Kurths J, Kleiner HJ, Witt A, Wessel N:Improved analysis of heart rate variability by methods of nonlinear dynamics.J Electrocardiol1995,28(Suppl):81-88.
20. Baumert M, Walther T, Hopfe J, Stepan H, Faber R, Voss A:Joint symbolic dynamic analysis of beat-to-beat interactions of heart rate and systolic blood pressure in normal pregnancy.Med Biol Eng Comput2002,40:241-245. 21. Caminal P, Giraldo BF, Vallverdu M, Benito S, Schroeder R, Voss A:Symbolic dynamic analysis of relations between
cardiac and breathing cycles in patients on weaning trials.Ann Biomed Eng2010,38:2542-2552.
22. Kamen PW, Tonkin AM:Application of the Poincare plot to heart rate variability: a new measure of functional status in heart failure.Aust N Z J Med1995,25:18-26.
23. Weiss JN, Garfinkel A, Spano ML, Ditto WL:Chaos and chaos control in biology.J Clin Invest1994,93:1355-1360. 24. Tulppo MP, Makikallio TH, Takala TE, Seppanen T, Huikuri HV:Quantitative beat-to-beat analysis of heart rate
dynamics during exercise.Am J Physiol1996,271:H244-252.
25. Brennan M, Palaniswami M, Kamen P:Poincare plot interpretation using a physiological model of HRV based on a network of oscillators.Am J Physiol Heart Circ Physiol2002,283:H1873-1886.
26. Huikuri HV, Seppanen T, Koistinen MJ, Airaksinen J, Ikaheimo MJ, Castellanos A, Myerburg RJ:Abnormalities in beat-to-beat dynamics of heart rate before the spontaneous onset of life-threatening ventricular tachyarrhythmias in patients with prior myocardial infarction.Circulation1996,93:1836-1844.
27. Voss A, Fischer C, Schroeder R, Figulla HR, Görnig M:Segmented Poincaré plot analysis for risk stratification in patients with dilated cardiomyopathy.Methods of Information in Medicine2010,49:511-515.
28. Seeck A, Baumert M, Fischer C, Khandoker A, Faber R, Voss A:Advanced Poincar’e plot analysis differentiates between hypertensive pregnancy disorders.Physiol Meas2011.
29. Porta A, Baselli G, Lombardi F, Montano N, Malliani A, Cerutti S:Conditional entropy approach for the evaluation of the coupling strength.Biol Cybern1999,81:119-129.
30. Hemmelmann C, Ziegler A, Guiard V, Weiss S, Walther M, Vollandt R:Multiple test procedures using an upper bound of the number of true hypotheses and their use for evaluating high-dimensional EEG data.J Neurosci Methods
2008,170:158-164.
31. Lipsitz LA, Pincus SM, Morin RJ, Tong S, Eberle LP, Gootman PM:Preliminary evidence for the evolution in complexity of heart rate dynamics during autonomic maturation in neonatal swine.J Auton Nerv Syst1997,65:1-9.
32. Mohan RM, Golding S, Paterson DJ:Intermittent hypoxia modulates nNOS expression and heart rate response to sympathetic nerve stimulation.Am J Physiol Heart Circ Physiol2001,281:H132-138.
33. Zhao N, Khan M, Ingenito S, Sica AL, Gootman N, Gootman PM:Electrocardiographic changes during postnatal development in conscious swine with cardiac autonomic imbalance.Auton Neurosci2001,88:167-174. 34. Harris TA, Healy GN, Colditz PB, Lingwood BE:Associations between serum cortisol, cardiovascular function and
neurological outcome following acute global hypoxia in the newborn piglet.Stress2009,12:294-304.
35. Boettger MK, Weber K, Grossmann D, Gajda M, Bauer R, Bar KJ, Schulz S, Voss A, Geis C, Brauer R, Schaible HG:Spinal tumor necrosis factor alpha neutralization reduces peripheral inflammation and hyperalgesia and suppresses autonomic responses in experimental arthritis: a role for spinal tumor necrosis factor alpha during induction and maintenance of peripheral inflammation.Arthritis Rheum2010,62:1308-1318.
36. Voss A, Schroeder R, Truebner S, Goernig M, Figulla HR, Schirdewan A:Comparison of nonlinear methods symbolic dynamics, detrended fluctuation, and Poincare plot analysis in risk stratification in patients with dilated cardiomyopathy.Chaos2007,17:015120.
37. Aouad LJ, Tam K, Waters KA:Effects of acute intermittent hypercapnic hypoxia on insulin sensitivity in piglets using euglycemic clamp.Metabolism2008,57:1056-1063.
38. Cheung PY, Obaid L, Emara M, Brierley Y, Johnson ST, Chan GS, Jewell L, Korbutt G, Bigam DL:Cardio-renal recovery of hypoxic newborn pigs after 18%, 21% and 100% reoxygenation.Intensive Care Med2008,34:1114-1121.
39. Solas AB, Kalous P, Saugstad OD:Reoxygenation with 100 or 21% oxygen after cerebral hypoxemia-ischemia-hypercapnia in newborn piglets.Biol Neonate2004,85:105-111.
40. Tichauer KM, Brown DW, Hadway J, Lee TY, St Lawrence K:Near-infrared spectroscopy measurements of cerebral blood flow and oxygen consumption following hypoxia-ischemia in newborn piglets.J Appl Physiol2006, 100:850-857.
doi:10.1186/1475-925X-10-88
Cite this article as:Schulzet al.:Quantification of compensatory processes of postnatal hypoxia in newborn


![Investigation of the pharmacophore of BK[ca] potassium channel openers](data:image/gif;base64,R0lGODlhAQABAIAAAP///wAAACH5BAEAAAAALAAAAAABAAEAAAICRAEAOw==)