diagnosis of selected hand skin features in
hyperspectral imaging
Koprowski
et al.
R E S E A R C H
Open Access
Automatic method for the dermatological
diagnosis of selected hand skin features in
hyperspectral imaging
Robert Koprowski
1*, S
ł
awomir Wilczy
ń
ski
2, Zygmunt Wróbel
1, S
ł
awomir Kasperczyk
3and Barbara B
ł
o
ń
ska-Fajfrowska
2* Correspondence: [email protected]
1Department of Biomedical
Computer Systems, University of Silesia, Faculty of Computer Science and Materials Science, Institute of Computer Science, ul. Będzińska 39, Sosnowiec 41-200, Poland Full list of author information is available at the end of the article
Abstract
Introduction:Hyperspectral imaging has been used in dermatology for many years. The enrichment of hyperspectral imaging with image analysis broadens considerably the possibility of reproducible, quantitative evaluation of, for example, melanin and haemoglobin at any location in the patient's skin. The dedicated image analysis method proposed by the authors enables to automatically perform this type of measurement.
Material and method:As part of the study, an algorithm for the analysis of hyperspectral images of healthy human skin acquired with the use of the Specim camera was proposed. Images were collected from the dorsal side of the hand. The frequencyλof the data obtained ranged from 397 to 1030 nm. A total of 4'000 2D images were obtained for 5 hyperspectral images. The method proposed in the paper uses dedicated image analysis based on human anthropometric data,
mathematical morphology, median filtration, normalization and others. The algorithm was implemented in Matlab and C programs and is used in practice.
Results:The algorithm of image analysis and processing proposed by the authors enables segmentation of any region of the hand (fingers, wrist) in a reproducible manner. In addition, the method allows to quantify the frequency content in different regions of interest which are determined automatically. Owing to this, it is possible to perform analyses for melanin in the frequency rangeλE∈(450,600) nm and for haemoglobin in the rangeλH∈(397,500) nm extending into the ultraviolet for the type of camera used. In these ranges, there are 189 images for melanin and 126 images for haemoglobin. For six areas of the left and right sides of the little finger (digitus minimus manus), the mean values of melanin and haemoglobin content were 17% and 15% respectively compared to the pattern.
Conclusions:The obtained results confirmed the usefulness of the proposed new method of image analysis and processing in dermatology of the hand as it enables reproducible, quantitative assessment of any fragment of this body part. Each image in a sequence was analysed in this way in no more than 100 ms using Intel Core i5 CPU M460 @2.5 GHz 4 GB RAM.
Keywords:Hyperspectral imaging, Image processing, Measurement automation, Segmentation
Introduction
The use of imaging in dermatological diagnosis is currently a very rapidly growing branch of medicine and computer science. Computer-assisted medical diagnosis gives much wider possibilities than the methods of traditional evaluation performed by a medical diagnostician. The results obtained from computer analysis are automatic, re-producible, calibrated and independent of human factors related to both the patient and the medical diagnostician who performs the examination. The most common methods of imaging are infrared and visible light. In this respect, the methods of assess-ment of various types of dermatological conditions based on simple methods of image analysis and processing are extremely popular. In thermal imaging, temperature changes resulting from the imaged diseases such as melanoma as well as thermal effects of the performed dermatological treatments are analysed automatically. As for imaging in visible light, a group of methods which enable morphometric mea-surements or profiled methods of image analysis and processing are used, for ex-ample, to determine the brightness of the RGB components in a segmented skin area. Hyperspectral imaging, which is also used in dermatology, offers much wider capabilities. Multispectral images are acquired using profiled multispectral cameras working in different spectra ranges. Additionally, depending on the frequency and spectrum range, various types of illuminators are used. Matching these two ele-ments (camera and illuminator) is extremely important because of the need to ob-tain a flat spectrum of the illuminator (lamp) in the range covered by the camera. In this range of light, for example, the visible one, it is possible to observe melanin or haemoglobin at a desired location on the skin. This observation is associated with image analysis enabling automatic and reproducible measurements independ-ent of interindividual variability.
The methods of image analysis and processing used in hyperspectral imaging of any object (not necessarily a medical one) can be divided into several groups, namely morphological methods [1-6], statistical methods [7-9] and profiled algo-rithms for selected applications. Among the morphological methods, there are clas-sical approaches [1,2,4] and those profiled to the analysis of image sequences [5,6]. The statistical methods are dominated by texture analysis [7-9] which is used as a set of features for classification and recognition. So far, profiled algorithms have been applied to face recognition [10], analysis of skin areas [11], and others [12]. These methods mainly dominate in the segmentation of specific objects [13]. On the basis of segmented objects, their morphometric measurements or analysis of their texture are performed [9]. These are, for example, methods which enable to assess the difference in absorption of radiation by skin chromophores such as hae-moglobin or melanin.
The amount and distribution of melanin is in fact an important factor determining, inter alia, the efficacy and safety of treatments in aesthetic medicine with the use of la-sers and ILP. In hyperspectral imaging of melanin and haemoglobin, only qualitative analyses of the results obtained are known [14-16]. Therefore, there is a need to object-ify the results obtained and to propose fully-automatic measurements of progression and changes of melanin or haemoglobin in the skin of the hand.
Material
As part of the study, an algorithm for the analysis of hyperspectral images of human, healthy skin acquired with the use of the Specim PFD-V10E camera was proposed. Im-ages were derived from the human hand having 2 Fitzpatrick skin phototypes. Individ-ual hands were illuminated with a typical lamp with flat spectral characteristics in the required range (based on HgAr emission for the VNIR spectral range). The images were obtained retrospectively during routine medical examinations carried out in ac-cordance with the Declaration of Helsinki. As for the described algorithm, no studies and experiments were carried out on humans. The resulting data were anonymized and stored in the output format, source 'dat' (ENVI File). The frequencyλ of the data ob-tained ranged from 397 to 1030 nm. Each image was recorded every 0.79 nm, which in total gave 800 2D images for each patient. The resolution M×N(number of rows and columns) of each image for the selected frequency was 899 × 1312 pixels. For the fixed distance of the object from the camera and the set focusing parameters, there was a square area covering the range 130 × 130μm per each pixel. A total of 4'000 2D images were obtained for 5 hyperspectral images. These images are subject to further analysis.
Method
Preprocessing
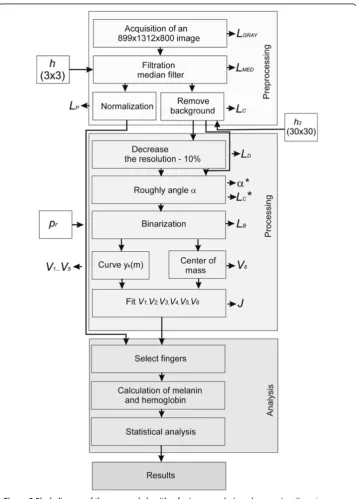
Input files with the extension *.dat containing a sequence of images are reorganized in the preliminary stage. This process (Figure 1) concerns the change in the organization of individual rows and columns obtained for different wavelengths to the sequence of imagesLGRAY(m,n,λ), wheremandnare row column coordinates and the wavelengthλ
respectively, for which the image was acquired. The number of rows and columns and the wavelength for each image are automatically read from the file *.hdr. This file also contains information about the data format (e.g. data type 4 - float 32 bits) and other elements that need to be taken into account when reading such data (wavelength units,
Figure 1Diagram of the acquisition and organization of data *.dat.The various stages of data analysis and reorganization are performed automatically. A hyperspectral camera saves each row sequentially for individual wavelengthsλ. In subsequent stages of processing, they are converted to the imageLGRAY(m,n,λ).
default bands, sensor type, interleave). For the analysed data, the image resolutionM×N was 899 × 1312 pixels.
Each of the images LGRAY(m,n,λ) is calibrated using the reference rows (used for the calibration for a given range of the spectrumλ) [17-19], and then subjected to filtration thus forming a new sequence of images LM(m,n,λ). This is median filtration with a
mask hM sized 3 × 3 pixels. The mask size was chosen arbitrarily taking into account
the possible contamination of the optical path as well as the image resolution and the size of the object [20-22]. A larger size of the maskhMcaused the removal of not only noise but also small elements in the image which are substantively important. Conse-quently, the size of 3 × 3 pixels remained. The final step of image pre-processing in-volves normalization and removal of uneven illumination. In the case of normalization of brightness levels, the range of minimum and maximum values in the imageLM(m,n,λ) is extended to the full range of brightness from 0 to 1, that is, the image after normalizationLP(m,n,λ) is equal to:
LPðm;n;λÞ ¼ LMðm;n;λÞ− minm;nðLMðm;n;λÞÞ
maxm;nLMðm;n;λÞ− minm;nðLMðm;n;λÞÞ ð1Þ
It should be noted that this normalization also covers the area to be calibrated. For this reason, the maximum brightness value equal to “1” after normalization corre-sponds to 100% emission for the wavelength λ. Removal of uneven illumination is re-lated to the subtraction from the image LP(m,n,λ) the image resulting from its filtration, i.e.:
LCðm;n;λÞ ¼LPðm;n;λÞ
−M 1
h2 ⋅Nh2
XMh2
m2¼1
XNh2
n2¼1
LP mþm2 −Mh2
2 ;nþn2− Nh2
2 ;λ
⋅h2ðm2;n2Þ
ð2Þ
form∈(Mh2/2,MC-Mh2/2) andn∈(Nh2/2,NC-Nh2/2).where:
Mh2×Nh2resolution of the maskh2,
LC(m,n,λ)–output image after the removal of uneven illumination.
To acquire the output imageLC(m,n,λ), its convolution with the maskh2sizedMh2×Nh2
equal to 30 pixels was used. The mask size was selected on the basis of twice the maximum size of the elements, objects visible in the image LC(m,n,λ), in this case it is 15 × 15,
i.e.Mh2×Nh2= 30 × 30 pixels. Next, based on the imagesLC(m,n,λ) andLP(m,n,λ), the
appropriate stages of image analysis and processing are carried out.
Image processing
The imagesLC(m,n,λ) andLP(m,n,λ) resulting from the initial stage of image processing are used for further processing steps. The image LC(m,n,λ) is further used in order to
isolate the region and the object of interest. The imageLP(m,n,λ) is a measurable image with respect to the valueλ.
medius, digitus annularis, digitus minimus manus) and the metacarpus and wrist area V6. Automatic localization of these places (points) fromV1to V6was made based on the pattern shown in Figure 2. Automatic recognition of individual locations (from V1 to V6) for each of the patients was carried out based on a hierarchical approach. The image LC(m,n,λ) is reduced to a resolution being 10% of the original resolution, that is
from the resolution 899 × 1312 pixels to 90 × 131 pixels using the nearest neighbour method. The result is the imageLD(m,n,λ,α) whereαis the angle of rotation relative to LC(m,n,λ). Then, the angle of the hand inclinationαis roughly determined, i.e.:
α¼ arg
α maxn
XM
m¼1
X
λ
LDðm;n;λ;αÞ !!
ð3Þ
andα∈(0°,180°).
The obtained result is the value of the rotation angle α* at which the hand image must be rotated for each wavelength λso that it is placed in a horizontal position. The rotation angle is constant for eachλso it does not occur in the formula (3). The image LC*(m,n,λ) rotated at the angleαis subjected to options for finding characteristic points
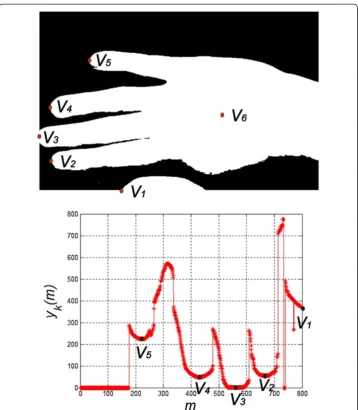
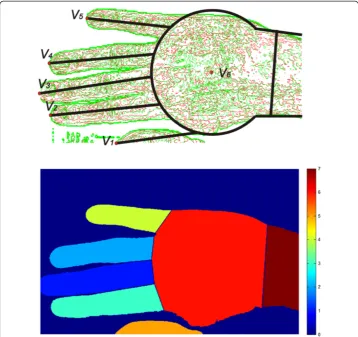
fromV1toV6. Detection of the position of characteristic points is carried out based on the local minima found on the contour of the hand - Figure 3. The contour curveyk(m) is formed on the basis of the binary image LB(m,n) resulting from binarization of the image LD(m,n,λ,α*) for the threshold pr determined automatically from the Otsu’s
formula [23], i.e.:
LBðm;nÞ ¼
1 if X
λ
LDðm;n;λ;αÞ>pr
0 other (
ð4Þ
The course of the curveyk(m) was determined on the basis of the position of the first
rows with the pixel values of“1”in the image LB(m,n) for each column. Local minima, which are highlighted in Figure 3, were also determined on this basis. In the present case, these are the points V2to V6(the big finger is not fully visible). The pointV6is
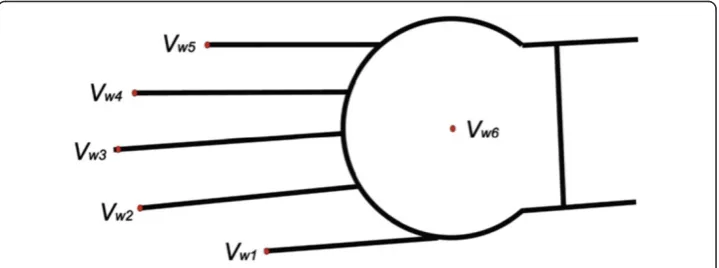
Figure 2Hand pattern used during matching to hyperspectral images.The division into individual (points) areas fromVw1toVw6is performed automatically. For each area, a number of the finger fromVw1
toVw5and the centre of mass of the wristVw6are assigned. In the upper part of the image, there is the
the centre of mass of the wrist calculated on the basis of the image LO(m,n) resulting from the opening operation of the imageLB(m,n), i.e.:
LOðm;nÞ ¼ minSE ðLDðm;nÞÞ ð5Þ
whereSE–square structural element sized 201 × 201.
The size of the structural element SE was selected on the basis of the maximum width of the fingers - for the set distance of the camera and its focal length. In the tests performed, the width of the biggest finger was no more than 200 pixels. On this basis, the centre of mass of the wrist was determined as the coordinates mv6 and nv6 of the
pointV6, i.e.:
Figure 3Binary image of the handLB(m,n) and the course of the curveyk(m).The binary image of the hand is acquired in a way which only enables to determine the position of the pointsV1toV6. These
points are determined on the basis of the local minimum in the courseyk(m). They provide a further basis
mv6¼
XN
n
XM
mLOðm;nÞ⋅m
XN
n
XM
mLOðm;nÞ
ð6Þ
nv6¼
XN
n
XM
mLOðm;nÞ⋅n
XN
n
XM
mLOðm;nÞ
ð7Þ
The centre of mass of the wrist is necessary to roughly detect the position of the hand relative to the pattern. After this stage, the positions of the individual points of fingers, i.e. V1,V2,V3,V4and V5, are matched. Matching is performed on the basis of minimization of the distance between the individual points of the pattern and the ana-lysed image. For the points of the pattern Vw1,Vw2, Vw3,Vw4 and Vw5, this is mi-nimization of the criterionJ:
J ¼
ffiffiffiffiffiffiffiffiffiffiffiffiffiffiffiffiffiffiffiffiffiffiffiffiffiffiffiffiffiffiffiffiffiffiffiffiffiffiffiffiffiffiffiffiffiffiffiffiffiffiffiffiffiffiffiffiffiffiffiffiffiffiffiffiffiffiffiffiffiffi Xi¼5
i¼1
mvi−mwvi
ð Þ2þXi¼5
i¼1
nvi−nwvi
ð Þ2
v u u
t ð8Þ
where mviand mwvi–coordinates of the points of the analysed image and the pattern i∈(1,5).
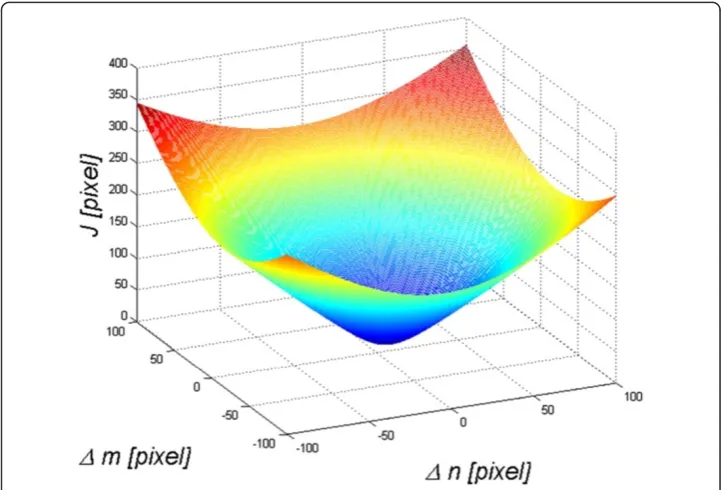
The value of the criterionJis calculated for the displacement of the pointsV1,V2,V3, V4and V5in the range of ±100 pixels in the axis of rows and columns. This range is sufficient for searching for the minimum value ofJ. Examples of the obtained values of the criterion J are shown in Figure 4. In this case, displacements amounting to −18 and −3 pixels in the axis of rows and columns respectively were obtained. This value
Figure 4Graph of changes in the value of the criterionJas a function ofΔmandΔn.Depending on the displacements of the pointsV1toV5(ΔmandΔn), the value of the criterionJis calculated. One global
informs about the need to move the image of the patient so that it would better (with respect to the criterionJ) match the pattern. Final adjustment of the positions of the in-dividual points of the fingers is performed on the basis of an analogous criterion. How-ever, it applies to only one vertex V. A block diagram of the proposed algorithm is shown in Figure 5, whereas matching the pattern to the patient's hand is shown in Figure 6. The image LP*(m,n,λ) corrected in terms of affine transformations is further
analysed in terms of the content of melanin and haemoglobin.
The performed and described analysis enables automatic and reproducible determin-ation of the position of individual areas of the hand. This process allows to perform fur-ther analysis of the brightness of the specific wavelengthsλ. These lengths correspond to the maximum emissivity of melanin and haemoglobin. For melanin, this is the frequency rangeλE∈(450,600) nm and for haemoglobin it isλH∈(397 nm,500 nm) extending into the ultraviolet. Within these ranges, there are 189 imagesLP*(m,n,λ) for the melanin and 126
images for haemoglobin. Accordingly, the image for melaninLE(m,n) was determined as:
LEðm;nÞ ¼ X
λ∈ð450;600Þ
L
pðm;n;λÞ ð9Þ
and analogously for the haemoglobinLH(m,n):
LHðm;nÞ ¼ X
λ∈ð397;500Þ
L
pðm;n;λÞ ð10Þ
The results obtained after brightness normalization are shown in Figure 6. The red component is the imageLE(m,n), while the green component is the imageLH(m,n). The
Figure 6Contours of melanin and haemoglobin images presented as components R-red and G-green respectively.For melanin, it is the contour formed as the sum of hyperspectral images in the frequency rangeλE∈(450,600) nm, whereas for haemoglobin this is the rangeλH∈(350,500) nm. Within these
ranges, there are 189 imagesLP *
blue component was extinguished. The images LE(m,n) and LH(m,n) are the basis for
further analysis of the results. Additionally, owing to the applied matching to the pat-tern, the division into individual fingers and the wrist is further used - Figures 6 and 7.
Results
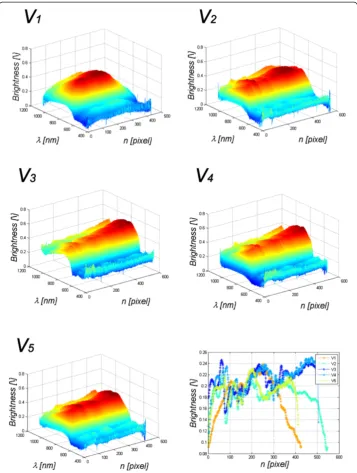
The results of automatic division into the fingers and wrist of the human hand (Figure 6) are further used in the tests. These analyses include automatic determination of the changes in the spectrum absorption for different frequencies λ∈(397,1030) for individual fingers. To this end, along each finger, the mean along its symmetry axis (for subsequent n) for a given frequencyλwas calculated. The obtained results for the sample calculations of melanin are shown in Figure 8. For subsequent fingers, characteristic changes in the intensity of each frequency λ are visible. The last graph in Figure 8 shows changes in
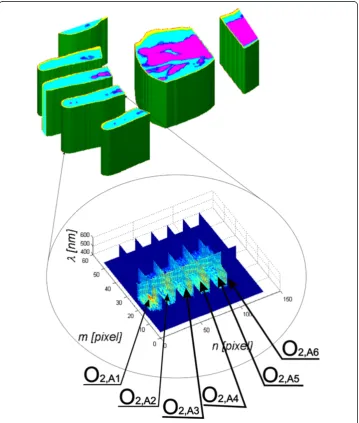
Figure 7Result of segmentation for individual wavelengths.The sample finger (V2) was divided into
six areas fromO2,A1toO2,A6for the left side and fromO2,B1toO2,B6for the right side. Within these areas, the
melanin along subsequent fingers. When approaching the wrist, an increase in the inten-sity by about 10% to 20% can be observed. The division of one finger (vertexV2) into
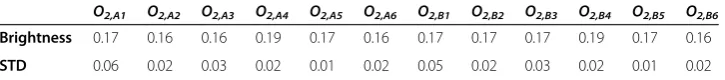
dif-ferent areas is shown at the bottom in Figure 7. The finger was divided into 12 areas, 6 on the side“A”and 6 on the side“B”of the finger - that is fromO2,A1toO2,A6for the sideA and fromO2,B1toO2,B6for the sideBrespectively - Figure 7. These areas are automatic-ally scaled depending on the size of the finger and other camera settings which may affect the size of the object. The results of the average brightness intensity and standard
Figure 8Graphs of changes in the value of spectrum for wavelengthsλfor the patient’s
subsequent fingers.The values on the axes are successive columns, wavelengthλand brightness for the selected wavelength. The last sixth graph shows the change of melanin along all five fingers of the patient. They-value is the mean value of brightness forλE∈(450,600) nm. The colours of individual lines correspond
deviation of the mean for each area are presented in Table 1. Between the sidesAandB, brightness changes are not greater than 1% (O2,A2,O2,B2and O2,A3,O2,B3). The standard
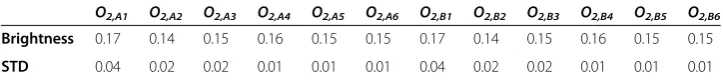
deviation of the mean is the highest for the areas of distal phalanges –areasO2,A1and O2,B1. The situation is similar for haemoglobin - Table 2. The standard deviation of the
mean is a bit smaller than in the case of melanin –it oscillates around the brightness value of 0.02. Higher brightness values exist for other wavelengths not included in the calculation of melanin or haemoglobin - Figure 8.
Comparison with other authors’results
The known results and methods presented by other authors can be divided into:
Issues related to hyperspectral imaging involving image analysis and processing and
Methods of analysis and processing of hand images that can be used in hyperspectral imaging.
In the first case, hyperspectral imaging was used, inter alia, to analyse the saturation of HbO2in people of different races (Zuzak [14,15]). Sampling from the hyposthenia region of African-American controls, the area within the square on the image, the per-centage of skin HbO2was 77.5 ± 0.2%, which is similar to the skin HbO2percentage of 78.2 ± 0.2% in healthy Caucasian subjects. In contrast, the percentage of skin HbO2in patients was significantly smaller and amounted to 61.0 ± 0.2% (p < 0.001). Percent renal parenchymal oxyhaemoglobin was also analysed by Liu [24]. In [13], there are also other results of analysis which is related only to the analysis of the whole ROI (region of interest) marked manually by an operator. The use of hyperspectral imaging to as-sess the time of the bruise formation is also interesting – Stam [25]. The inaccuracy found is 2.3% for fresh bruises and 3 to 24% for bruises up to 3 days old. In Authors’ conclusion [25], colour inhomogeneity of bruises can be used to determine their age. For example, the experiment results presented in [13] show that the hyperspectral based method has the potential to identify the spinal nerve more accurately than the traditional method as the new method contains both the spectral and spatial informa-tion of nerve secinforma-tions. There are many other areas of medicine where manual or semi-automatic marking of regions of interest is used - analysis of vibrational Filik J. [26], laparoscopic digital light processing–Olweny EO. [27], blood stains at the crime scene– Edelman G. [28], prostate cancer detection–Akbari H. [29], histopathological examination of excised tissue Vasefi F. [30] diabetic foot ulcer Yudovsky D. [31], cancer detection -Akbari H. [32], and others.
In the other case, these are morphological operations used in the classification of various types of artefacts visible in the image [1,2,5,6]. Other methods for classification are also used such as SVM (support vector machines) [4], Gauss-Markov model [7] or
Table 1 The percentage of melanin for the sample finger (vertexV2) and its standard
deviation (STD) of the mean
O2,A1 O2,A2 O2,A3 O2,A4 O2,A5 O2,A6 O2,B1 O2,B2 O2,B3 O2,B4 O2,B5 O2,B6
Brightness 0.17 0.16 0.16 0.19 0.17 0.16 0.17 0.17 0.17 0.19 0.17 0.16
wavelet method [9]. In the study of Dicker et al. [16], spectral library was gener-ated with 12 unique spectra, which was used to classify specimens where sample preparation was varied. Using a CT of 0.99 left large areas of the tissues unclassi-fied. Lowering the minimum correlation coefficient to 0.99 enabled all the samples to achieve >85% classification. The results referred mainly to the analysis of a hyper-spectral image by analyzing the histograms obtained. Liu Z. et al. [12] propose a novel tongue segmentation method that uses hyperspectral images and the SVM. The psented segmentation of the tongue allows to obtain reproducible and quantitative re-sults. Benediktsson J. et al. [2] present results for a sequential use of morphological opening and closure for the increasing size of the structural element. This method-ology is similar to the use of conditional erosion and dilation as in [3]. In turn, Rellier G. et al. [7] propose a probabilistic vector texture model, using a Gauss-Markov ran-dom field (MRF). The MRF parameters allow the characterization of different hyper-spectral textures.
In conclusion, the well-known studies related to using the methods for the analysis and processing of images into hyperspectral images is dominated by morphological analysis. Segmentation into specific areas refers to simple objects such as the tongue. In each case the methods described are profiled to a particular application. Therefore, the approach to the analysis of the hand proposed in this paper is an extension of these methods into a new area and new dedicated analysis methodology.
Summary
The paper presents a method for the analysis of melanin and haemoglobin in the area of the human hand. The characteristics of the described method are as follows:
Repeatability of measurements owing to limiting of operator’s participation in the study,
Full automatic operation of the algorithm - the arguments for each algorithm func-tion are set once when first starting the algorithm–as they only depend on the type of the multispectral camera used,
Possibility of any quantitative (not qualitative) assessment of the amount of melanin or haemoglobin in any area of the hand,
Possibility of automatic comparison of the results of any area of the finger with other areas or other study of the same person in therapy/disease monitoring,
Time analysis of a single image sequence does not exceed 100 ms when using Intel Core i5 CPU M460 @2.5 GHz 4 GB RAM.
The discussed methodology of hyperspectral image analysis and processing does not fully cover the issue. The presented algorithm for image analysis and processing can
Table 2 The percentage of haemoglobin for the sample finger (vertexV2) and its
standard deviation (STD) of the mean
O2,A1 O2,A2 O2,A3 O2,A4 O2,A5 O2,A6 O2,B1 O2,B2 O2,B3 O2,B4 O2,B5 O2,B6
Brightness 0.17 0.14 0.15 0.16 0.15 0.15 0.17 0.14 0.15 0.16 0.15 0.15
also be created by using the techniques from spectral methods [33,34], optical image analysis [35], microscopic analyses [36,37] and others [38-41]. In future work, the au-thors intend to analyse reproducibility of results for a larger number of patients using different types of hyperspectral cameras operating in the same spectral range. The im-pact of lighting and calibration method is equally interesting, which will be the subject of the authors’future work.
Abbreviations
THV:Thermal camera; STD: Standard deviation; SVM: Support vector machines; ROI: Region of interest.
Competing interests
The authors declare that they have no competing interests.
Authors’contributions
RK suggested the algorithm for image analysis and processing, implemented it and analysed the images. SW, ZW, SK, BBF performed the acquisition of the hyperspectral images and consulted the obtained results. All authors have read and approved the final manuscript.
Acknowledgements
This work was financially supported by the Medical University of Silesia in Katowice (Grant No. KNW–2–019/N/3/N). The authors wish to acknowledge the Katowice School of Economics for the ability of making measurements and Specim Company and LOT-Quantum Design Company for providing hyperspectral camera.
Author details
1Department of Biomedical Computer Systems, University of Silesia, Faculty of Computer Science and Materials
Science, Institute of Computer Science, ul. Będzińska 39, Sosnowiec 41-200, Poland.2Department of Basic Biomedical Science, School of Pharmacy, Medical University of Silesia in Katowice, ul. Kasztanowa 3, Sosnowiec 41-200, Poland.
3
Department of Biochemistry, School of Medicine with the Division of Dentistry, Medical University of Silesia in Katowice, ul. Jordana 19, 41-808 Zabrze, Poland.
Received: 12 March 2014 Accepted: 10 April 2014 Published: 22 April 2014
References
1. Plaza A, Martinez P, Plaza J, Perez R:Dimensionality reduction and classification of hyperspectral image data using sequences of extended morphological transformations.IEEE Trans Geosci Rem Sens2005,43(3):466–479. 2. Benediktsson JA, Palmason JA, Sveinsson JR:Classification of hyperspectral data from urban areas based on
extended morphological profiles.IEEE Trans Geosci Rem Sens2005,43(3):480–491.
3. Koprowski R, Teper S, Wrobel Z, Wylegala E:Automatic analysis of selected choroidal diseases in OCT images of the eye fundus.Biomed Eng Online2013,12:117.
4. Fauvel M, Benediktsson JA, Chanussot J, Sveinsson JR:Spectral and spatial classification of hyperspectral data using SVMs and morphological profiles.IEEE Trans Geosci Rem Sens2008,46(11):3804–3814.
5. Noyel G, Angulo J, Jeulin D:Morphological segmentation of hyperspectral images.Image Anal Stereol2007, 26(3):101–109.
6. Dalla MM, Villa A, Benediktsson JA, Chanussot J, Bruzzone L:Classification of hyperspectral images by using extended morphological attribute profiles and independent component analysis.IEEE Geosci Remote Sens Lett 2011,8(3):542–546.
7. Rellier G, Descombes X, Falzon F, Zerubia J:Texture feature analysis using a Gauss-Markov model in hyperspectral image classification.IEEE Trans Geosci Remote Sens2004,42(7):1543–1551.
8. Camps-Valls G, Gomez-Chova L, Munoz-Mari J, Vila-Frances J, Calpe-Maravilla J:Composite kernels for hyperspectral image classification.IEEE Geosci Remote Sens Lett2006,3(1):93–97.
9. Zhang X, Younan NH, O'hara CG:Wavelet domain statistical hyperspectral soil texture classification.IEEE Trans Geosci Remote Sens2005,43(3):615–618.
10. Pan Z, Member S, Healey G, Member S, Prasad M, Tromberg B:Face recognition in hyperspectral images.
IEEE Trans Pattern Anal Mach Intell2003,25(12):1552–1560.
11. Stamatas GN, Balas CJ, Kollias N:Hyperspectral image acquisition and analysis of skin.InBiomedical Optics 2003. International Society for Optics and Photonics.2003:77–82.
12. Liu Z, Yan JQ, Zhang D, Li QL:Automated tongue segmentation in hyperspectral images for medicine.
Appl Optic2007,46(34):8328–8334.
13. Li Q, Chen Z, He X, Wang Y, Liu H, Xu Q:Automatic identification and quantitative morphometry of unstained spinal nerve using molecular hyperspectral imaging technology.Neurochem Int2012,61(8):1375–1384. 14. Zuzak KJ, Francis RP, Wehner EF, Litorja M, Cadeddu JA, Livingston EH:Active DLP hyperspectral illumination: a
noninvasive, in vivo, system characterization visualizing tissue oxygenation at near video rates.Anal Chem 2011,83(19):7424–7430.
16. Dicker DT, Lerner J, Van Belle P, Barth SF, Guerry D, Herlyn M, Elder DE, El-Deiry WS:Differentiation of normal skin and melanoma using high resolution hyperspectral imaging.Cancer Biol Ther2006,5(8):1033–1038.
17. Samarov DV, Clarke ML, Lee JY, Allen DW, Litorja M, Hwang J:Algorithm validation using multicolor phantoms.
Biomed Opt Express2012,3(6):1300–1311.
18. Rosas JG, Blanco M:A criterion for assessing homogeneity distribution in hyperspectral images. Part 1: homogeneity index bases and blending processes.J Pharm Biomed Anal2012,70:680–690.
19. Rosas JG, Blanco M:A criterion for assessing homogeneity distribution in hyperspectral images. Part 2: application of homogeneity indices to solid pharmaceutical dosage forms.J Pharm Biomed Anal2012, 70:691–699.
20. Koprowski R, Wrobel Z:Identification of layers in a tomographic image of an eye based on the canny edge detection.Inf Technol Biomed Adv Intell Soft Comput2008,47:232–239.
21. Koprowski R, Teper S, Weglarz B, Wylęgała E, Krejca M, Wróbel Z:Fully automatic algorithm for the analysis of vessels in the angiographic image of the eye fundus.Biomed Eng Online2012,11:35.
22. Koprowski R, Wróbel Z:Layers recognition in tomographic eye image based on random contour analysis. Computer recognition systems 3.Adv Intell Soft Comput2009,57:471–478.
23. Otsu N:A threshold selection method from gray-level histograms.IEEE Trans Sys Man Cyber1979,9(1):62–66. 24. Liu ZW, Faddegon S, Olweny EO, Best SL, Jackson N, Raj GV, Zuzak KJ, Cadeddu JA:Renal oxygenation during
partial nephrectomy: a comparison between artery-only occlusion versus artery and vein occlusion.
J Endourol2013,27(4):470–474.
25. Stam B, van Gemert MJ, van Leeuwen TG, Teeuw AH, van der Wal AC, Aalders MC:Can color inhomogeneity of bruises be used to establish their age?J Biophotonics2011,4(10):759–767.
26. Filik J, Rutter AV, Sulé-Suso J, Cinque G:Morphological analysis of vibrational hyperspectral imaging data.
Analyst2012,137(24):5723–5729.
27. Olweny EO, Faddegon S, Best SL, Jackson N, Wehner EF, Tan YK, Zuzak KJ, Cadeddu JA:Renal oxygenation during robot-assisted laparoscopic partial nephrectomy: characterization using laparoscopic digital light processing hyperspectral imaging.J Endourol2013,27(3):265–269.
28. Edelman G, van Leeuwen TG, Aalders MC:Hyperspectral imaging for the age estimation of blood stains at the crime scene.Forensic Sci Int2012,223(1–3):72–77.
29. Akbari H, Halig LV, Schuster DM, Osunkoya A, Master V, Nieh PT, Chen GZ, Fei B:Hyperspectral imaging and quantitative analysis for prostate cancer detection.J Biomed Opt2012,17(7):076005.
30. Vasefi F, Najiminaini M, Ng E, Chamson-Reig A, Kaminska B, Brackstone M, Carson J:Transillumination hyperspectral imaging for histopathological examination of excised tissue.J Biomed Opt2011,16(8):086014.
31. Yudovsky D, Nouvong A, Schomacker K, Pilon L:Assessing diabetic foot ulcer development risk with hyperspectral tissue oximetry.J Biomed Opt2011,16(2):026009.
32. Akbari H, Uto K, Kosugi Y, Kojima K, Tanaka N:Cancer detection using infrared hyperspectral imaging.Cancer Sci2011,102(4):852–857.
33. Porwik P:Efficient spectral method of identification of linear Boolean function.Control Cybern2004,33(4):663–678. 34. Sonka M, Michael Fitzpatrick J:Medical Image Processing and Analysis, Handbook of Medical Imaging. Belligham:
SPIE; 2000.
35. Siedlecki D, Nowak J, Zajac M:Placement of a crystalline lens and intraocular lens: retinal image quality.
J Biomed Opt2006,11(5):054012.
36. Korzynska A, Hoppe A, Strojny W, Wertheim D:Investigation of a Combined Texture and Contour Method for Segmentation of Light Microscopy Cell Images. InProceedings of the Second IASTED International Conference on Biomedical Engineering.Anaheim, Calif. Calgary, Zurich: ACTA Press; 2004:234–239.
37. Korzynska A, Iwanowski M:Multistage morphological segmentation of bright-field and fluorescent microscopy images.Opt Electron Rev2012,20(2):87–99.
38. Castro A, Siedlecki D, Borja D, Uhlhorn S, Parel JM, Manns F, Marcos S:Age-dependent variation of the gradient index profile in human crystalline lenses.J Mod Opt2011,58(19–20):1781–1787.
39. Korus P, Dziech A:Efficient method for content reconstruction with self-embedding.IEEE Trans Image Process 2013,22(3):1134–1147.
40. Tadeusiewicz R, Ogiela MR:Automatic understanding of medical images new achievements in syntactic analysis of selected medical images.Biocybern Biomed Eng2002,22(4):17–29.
41. Edelman GJ, Gaston E, Leeuwen TG, Cullen PJ, Aalders MC:Hyperspectral imaging for non-contact analysis of forensic traces.Forensic Sci Int2012,223(1–3):28–39.
doi:10.1186/1475-925X-13-47