Open Access
Brief reports
A web server for interactive and zoomable Chaos Game
Representation images
Kazuharu Arakawa*, Kazuki Oshita and Masaru Tomita
Address: Institute for Advanced Biosciences, Keio University, Fujisawa, 252-8520, Japan
Email: Kazuharu Arakawa* - [email protected]; Kazuki Oshita - [email protected]; Masaru Tomita - [email protected] * Corresponding author
Abstract
Chaos Game Representation (CGR) is a generalized scale-independent Markov transition table, which is useful for the visualization and comparative study of genomic signature, or for the study of characteristic sequence motifs. However, in order to fully utilize the scale-independent properties of CGR, it should be accessible through scale-independent user interface instead of static images. Here we describe a web server and Perl library for generating zoomable CGR images utilizing Google Maps API, which is also easily searchable for specific motifs. The web server is freely accessible at http://www.g-language.org/wiki/cgr/, and the Perl library as well as the source code is distributed with the G-language Genome Analysis Environment under GNU General Public License.
Background
Genomic sequences exhibit characteristic nucleotide com-positional bias, especially in the relative abundances of short oligonucleotides. While diverse dinucleotide fre-quencies are observed among various phyla, closely related species tend to display similar compositions [1]. Through these studies, the relative abundances of dinucle-otides are considered to be the "genomic signature" [2,3]. Chaos Game Representation (CGR) was first proposed by Jeffrey as a scale-independent means to visualize this non-randomness of genomic sequences, by applying the con-cept of chaotic dynamical systems [4]. Further studies by Almeida et al. has shown that CGR is a generalized Markov chain probability table which can accommodate non-integer orders, and that CGR is advantageous over Markov transition tables for its computational efficiency and scale-independence [5-8].
Several software tools, including a database of CGR images [9], a web server [5], and a tool in the EMBOSS package [10], are already available for CGR analysis; how-ever, these tools produce static images, which limits the full utility of CGR as scale-independent Markov transition table. Zoomable User Interface (ZUI) is effective in repre-senting such scalable information [11], as exemplified by the popularity of Google Maps [12] in representing the geographical data. Therefore, here we describe a web server for generating interactive and zoomable CGR images, using Google Maps API [13] and Web 2.0 technol-ogies [14].
Implementation
Chaos Game Representation
In order to generate CGR for a given nucleotide sequence, a rectangular coordinate system is defined to be confined by four vertices representing the four nucleotides: A (-1, 1), C (-1, -1), G (1, 1), and T (1, -1). Then, starting from Published: 17 September 2009
Source Code for Biology and Medicine 2009, 4:6 doi:10.1186/1751-0473-4-6
Received: 5 August 2009 Accepted: 17 September 2009
This article is available from: http://www.scfbm.org/content/4/1/6
© 2009 Arakawa et al; licensee BioMed Central Ltd.
the origin (0, 0), a pointer is moved to the midpoint of current position and the vertex corresponding to the next nucleotide. For example, for a tetramer sequence "ACGT", the pointer is first moved to the midpoint between the ori-gin (0, 0) and T (1, -1), which is (0.5, -0.5), and then to the next midpoint between this position and G (1, 1), as shown in Figure 1a. Repeating this procedure for all nucle-otide within the given sequence results in the CGR image. Note that by tracing the nucleotide in the reverse order, a given position within the CGR image contains the infor-mation about its trajectory, and thus retains the informa-tion about the Markovian relainforma-tionships of successive nucleotides.
Mathematically, CGR is an iterated function system (IFS). For a given nucleotide sequence in reverse order g of length nG (gi ∈ A, T, G, C} and i = 1,..., nG), CGR X (set of coordinates Xi for i = 1,..., nG) is given by iterating the fol-lowing function,
where Xo = (0, 0), V(A) = (-1, 1), V(C) = (-1, -1), V(G) = (1, 1), V(T) = (1, -1).
k-mer table
To generate k-mer table (or FCGR: frequency matrices extracted from CGR, as defined by Almeida et al. [5]), a square is repeatedly subdivided into four squares, while retaining the quadrant representation of four nucleotides,
where A is upper left, C is lower left, G is upper right, and T is lower right. For example, for the tetramer "ACGT", upper left square representing A is subdivided, and then lower left square within this upper left square representing "AC" is subdivided, and so on (see Figure 1b for details). Repeating this process for all k-mer while color-coding the pixels with the abundance of corresponding k-mer from white (rare) to black (frequent) results in the k-mer table with 4k pixels of width 2k.
Mathematically, the position of a certain oligomer can be calculated by converting the nucleotide sequence into two binary bit sequences corresponding to the horizontal and vertical coordinates. C and T bases move to the lower quadrants, and G and T bases move to the right quadrants. Therefore, by substituting A and G with 0 and C and T with 1, a binary number corresponding to the y-distance from top-left corner pixel of the image is obtained. Simi-larly, x-distance is obtained by substituting A and C with 0 and G and T with 1. For example, distance of ACGT from the upper-left corner pixel is given by (0011, 0101) in binary, which is (3, 5) in decimal. Therefore, ACGT is located at the 4th column, 6th row of the 16 × 16 pixel image (Figure 1b).
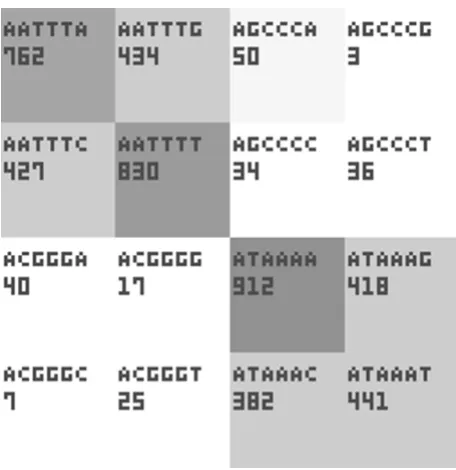
Each box representing certain k-mer produced by our soft-ware shows the sequence and the count of k-mer (Figure 2). In order to minimize the file size, we have defined 3 × 4 pixel font for the nucleotide sequence and 3 × 5 pixel font for numbers.
Xi =Xi−1+
(
Xi−1−V g( ) /i)
2 (1)(1)Algorithm for CGR and k-mer table Figure 1
Algorithm for CGR and k-mer table. (a) CGR is generated by iterating the movement of pointer to the midpoint of
Web interface
The web server interface was developed with G-language Genome Analysis Environment version 1.8.9 [15-17], and Google Maps API [13] was used for ZUI. CGR and k-mer table are drawn using the GD library, and subsequently converted into Google Maps format using the gener-ateGMap function of G-language GAE, which is computa-tionally optimized by utilizing multiple CPU cores. Incremental search of composite oligomers was imple-mented with Google Maps API and Javascript. Resulting web server is available through the G-language REST server [18].
Results and Discussion
Interactive and zoomable user interface
A typical interface of interactive and zoomable CGR gen-erated by our server is shown in Figure 3. CGR and k-mer table generated by our server is accessible as a Google Map; therefore, users can intuitively and smoothly navi-gate the large image by panning with mouse dragging, and by zooming in and out with mouse scroll wheels, double clicking, or by using the controller located in the upper left corner. ZUI allow multi-scale observation of large CGR image at varying magnification levels, which is suited to the scale-independent nature of CGR. The coor-dinate system of CGR and k-mer is set to be identical by calculating CGR in reverse sequence order; therefore,
k-mer table can be used as a guide to locate a certain oli-gomer and to look up the exact count of the olioli-gomer of interest. Using the overlay feature of Google Maps, CGR and k-mer images can be readily switched with the but-tons located in the upper right corner. Online examples are available at our website [19] for the genomes of Escherichia coli K12 (NC_000913), Bacillus subtillis (NC_000964), Synechococcus sp. (NC_005070), Pyrococcus furiosus (NC_003413), Mycoplasma genitalium (NC_000908), Saccharomyces cerevisiae chromosome I (NC_001133), Drosophila melanogaster chromosome 2R (NT_033778), and Homo sapiens chromosome 21 (NT_011512).
In order to fully utilize the CGR as scale-independent Markov transition table, and to be able to quickly locate oligomers in the k-mer table, the map can be searched for oligomers of any length from the search box located at the top (Figure 3). Search is incremental, and therefore corre-sponding position is immediately highlighted within the map upon typing the nucleotide sequence. Oligomers can be searched by specific sequences using only the four nucleotides (Figure 3a), or ambiguously using "n" to rep-resent the all four nucleotides (Figure 3b). 4n regions are
highlighted when multiple "n"s are used. With these zooming and interactive searching capabilities, CGR can be a powerful tool in studying the genomic signatures and overrepresented or underrepresented sequence motifs within the genome.
REST Web service API
The web server is provided as REST web service [20], through G-language REST Server [18]. In principle, our service can be accessed by specifying a URL with the fol-lowing syntax:
http://rest.g-language.org/[genome]/[method]/
Here the [genome] is a RefSeq accession number (see here for listing), and [method] is either cgr (for Chaos Game Representation) or kmer_table (for k-mer table). For example, for Mycoplasma genitalium genome (RefSeq: NC_000908) is:
http://rest.g-language.org/NC_000908/cgr/
http://rest.g-language.org/NC_000908/kmer_table/
Google Map view can be generated by appending "output = gmap" to the above URL, as follows:
http://rest.g-language.org/NC_000908/cgr/out put=gmap/
Close-up of oligomer boxes in k-mer table Figure 2
Close-up of oligomer boxes in k-mer table. In order to
In this way, all maps are generated on the fly, and are always up-to-date. Moreover, other pages or web-database sites can utilize our service to add CGR and k-mer table to their website, by simply referring to our URL. To use our service with user's own sequence, the sequence should be uploaded from http://rest.g-language.org/ upload/ and use the reference ID given by the uploader in place of the accession number. For more details about the service, or the Perl API distributed with the latest G-lan-guage GAE package (version 1.8.9 or above) to use the software locally, see the documentations in our website [19].
List of abbreviations
CGR: Chaos Game Representation; FCGR: Frequency matrices extracted from CGR; G-language GAE: G-lan-guage Genome Analysis Environment; IFS: Iterated Func-tion System; REST: RepresentaFunc-tional State Transfer; ZUI: Zoomable User Interface.
Competing interests
The authors declare that they have no competing interests.
Authors' contributions
KA designed and developed the software, and drafted the manuscript. KO participated in the implementation of the software. MT supervised the project. All authors have read and approved the final manuscript.
Acknowledgements
This research is supported by the Grant-in-Aid for Young Scientists No.20710158 from the Japan Society for the Promotion of Science (JSPS), as well as funds from the Yamagata Prefectural Government and Tsuruoka City.
References
1. Karlin S, Mrazek J, Campbell AM: Compositional biases of bacte-rial genomes and evolutionary implications. J Bacteriol 1997,
179(12):3899-3913.
2. Karlin S, Burge C: Dinucleotide relative abundance extremes: a genomic signature. Trends Genet 1995, 11(7):283-290. 3. Karlin S, Campbell AM, Mrazek J: Comparative DNA analysis
across diverse genomes. Annu Rev Genet 1998, 32:185-225. 4. Jeffrey HJ: Chaos game representation of gene structure.
Nucleic Acids Res 1990, 18(8):2163-2170.
5. Almeida JS, Carrico JA, Maretzek A, Noble PA, Fletcher M: Analysis of genomic sequences by Chaos Game Representation. Bio-informatics 2001, 17(5):429-437.
6. Almeida JS, Vinga S: Universal sequence map (USM) of arbi-trary discrete sequences. BMC Bioinformatics 2002, 3:6. 7. Almeida JS, Vinga S: Computing distribution of scale
independ-ent motifs in biological sequences. Algorithms Mol Biol 2006, 1:18.
Web-based interactive and zoomable CGR Figure 3
Web-based interactive and zoomable CGR. CGR is generated as interactive Google Map image from our server, which
allows smooth zooming with mouse scroll wheels, double clicks, or with the controller located in the upper left corner. Oli-gomers can be searched incrementally from the search box located at the top, either specifically as in (a), or ambiguously as in (b) by using the letter "n" to match all four nucleotides. Search result is immediately highlighted on the map.
Publish with BioMed Central and every scientist can read your work free of charge "BioMed Central will be the most significant development for disseminating the results of biomedical researc h in our lifetime."
Sir Paul Nurse, Cancer Research UK
Your research papers will be:
available free of charge to the entire biomedical community
peer reviewed and published immediately upon acceptance
cited in PubMed and archived on PubMed Central
yours — you keep the copyright
Submit your manuscript here: BioMedcentral 8. Almeida JS, Vinga S: Biological sequences as pictures: a generic
two dimensional solution for iterated maps. BMC Bioinformatics
2009, 10:100.
9. Bikandi J, San Millan R, Rementeria A, Garaizar J: In silico analysis of complete bacterial genomes: PCR, AFLP-PCR and endo-nuclease restriction. Bioinformatics 2004, 20(5):798-799. 10. Rice P, Longden I, Bleasby A: EMBOSS: the European Molecular
Biology Open Software Suite. Trends Genet 2000,
16(6):276-277.
11. Arakawa K, Tamaki S, Kono N, Kido N, Ikegami K, Ogawa R, Tomita M: Genome Projector: zoomable genome map with multiple views. BMC Bioinformatics 2009, 10:31.
12. Google Maps [http://maps.google.com/]
13. Google Maps API [http://code.google.com/apis/maps/]
14. Zhang Z, Cheung KH, Townsend JP: Bringing Web 2.0 to bioin-formatics. Brief Bioinform 2008, 10:1-10.
15. Arakawa K, Mori K, Ikeda K, Matsuzaki T, Kobayashi Y, Tomita M: G-language Genome Analysis Environment: a workbench for nucleotide sequence data mining. Bioinformatics 2003,
19(2):305-306.
16. Arakawa K, Suzuki H, Tomita M: Computational Genome Anal-ysis Using The G-language System. Genes, Genomes and Genom-ics 2008, 2(1):1-13.
17. Arakawa K, Tomita M: G-language System as a platform for large-scale analysis of high-throughput omics data. Journal of Pesticide Science 2006, 31(3):282-288.
18. G-language REST Service [http://rest.g-language.org/] 19. CGR Web Server [http://www.g-language.org/wiki/cgr/] 20. Stockinger H, Attwood T, Chohan SN, Cote R, Cudre-Mauroux P,
Falquet L, Fernandes P, Finn RD, Hupponen T, Korpelainen E, et al.: