R E S E A R C H A R T I C L E
Open Access
Sample size calculation for estimating key
epidemiological parameters using
serological data and mathematical
modelling
Stéphanie Blaizot
1*, Sereina A. Herzog
1,2, Steven Abrams
3, Heidi Theeten
4, Amber Litzroth
5and Niel Hens
1,3Abstract
Background:Our work was motivated by the need to, given serum availability and/or financial resources, decide on which samples to test in a serum bank for different pathogens. Simulation-based sample size calculations were performed to determine the age-based sampling structures and optimal allocation of a given number of samples for testing across various age groups best suited to estimate key epidemiological parameters (e.g., seroprevalence or force of infection) with acceptable precision levels in a cross-sectional seroprevalence survey.
Methods:Statistical and mathematical models and three age-based sampling structures (survey-based structure, population-based structure, uniform structure) were used. Our calculations are based on Belgian serological survey data collected in 2001–2003 where testing was done, amongst others, for the presence of Immunoglobulin G antibodies against measles, mumps, and rubella, for which a national mass immunisation programme was introduced in 1985 in Belgium, and against varicella-zoster virus and parvovirus B19 for which the endemic equilibrium assumption is tenable in Belgium.
Results:The optimal age-based sampling structure to use in the sampling of a serological survey as well as the optimal allocation distribution varied depending on the epidemiological parameter of interest for a given infection and between infections.
Conclusions:When estimating epidemiological parameters with acceptable levels of precision within the context
of a single cross-sectional serological survey, attention should be given to the age-based sampling structure. Simulation-based sample size calculations in combination with mathematical modelling can be utilised for choosing the optimal allocation of a given number of samples over various age groups.
Keywords:Infectious diseases, Mathematical models, Study design, Sample size, Allocation, Precision
Background
Several key epidemiological parameters such as the
preva-lence, the force of infection – rate at which susceptible
individuals become infected, or the basic reproduction
number R0– expected number of secondary cases of an
infected person in a totally susceptible population – can
be computed through the use of mathematical models.
Mathematical models for infectious diseases often rely on data from serological surveys. Specifically, in a cross-sectional serological survey, samples taken from individ-uals at a certain time point provide information about whether or not these individuals have been immunised before that time point (depicting current status data). Pathogen-specific antibodies following infection or vac-cination can be identified in the serum. The antibody levels are typically compared to a predetermined cut-off
level to determine the individuals’ humoral
immuno-logical status. The usefulness of these surveys in
epidemiology has recently been highlighted [1]. Under
* Correspondence:[email protected]
1Centre for Health Economics Research and Modelling Infectious Diseases
(CHERMID), Vaccine and Infectious Disease Institute (VAXINFECTIO), University of Antwerp, Antwerp, Belgium
Full list of author information is available at the end of the article
the assumptions of lifelong humoral immunity and an epidemic in a steady state, the age-specific force of infec-tion can be estimated from such data [2].
Publications that reported using a dynamic transmis-sion model to inform the design of studies in infectious diseases are scarce [3]. Moreover, only a few studies used mathematical or statistical models to inform the design
of serological surveys. Marschner [4] introduced a
method for determining the sample size of a cross-sec-tional seroprevalence survey to estimate the age-specific incidence of an irreversible disease, based on the illness-death model assuming time homogeneity and non-differential mortality as described in Keiding’s 1991 paper [5]. More recently, Nishiura et al. [6] proposed a framework to compute the uncertainty bounds of the
final epidemic size to H1N1–2009 and to determine the
minimum sample size required. Sepúlveda and Drakeley
[7] proposed two sample size calculators, depending on
whether the seroreversion rate (i.e., rate of antibody decay) is known, for estimating the seroconversion rate in malaria transmission in low endemicity settings using a reverse catalytic model. They extended the method to determine the sample size required to detect a reduction in the seroconversion rate at a given time point before
survey sampling caused by a field intervention [8].
Lastly, Vinh and Boni [9] assessed the power of serial
serological studies in inferring the basic reproduction number and other processes of influenza using a mathematical model.
In this paper, simulation-based sample size calcula-tions are performed in order to determine the age-based sampling structures and optimal allocation distributions best suited to estimate with acceptable precision levels several epidemiological parameters such as the preva-lence, force of infection, and basic reproduction number. Specifically, we use four models and three age-based sampling structures within the context of a single cross-sectional seroprevalence survey. We differentiate between endemic and non-endemic settings. In the latter case, we limit ourselves to estimating the prevalence and defer extensions thereof to future work. The objectives of this paper are i) to give insights into the age structure best suited to estimate the parameters with acceptable levels of precision; ii) to provide an order of magnitude of the sample size required to attain a specified precision for a particular parameter; and iii) to give insights into the optimal allocation of a fixed sample size among age groups.
Our work is motivated by the need to, given serum availability and/or financial resources, decide on which samples to test in a serum bank for different pathogens. In particular, the proportion of the samples to allocate in different age groups could be investigated to obtain the highest precision for a given parameter.
Methods Data
A serological survey testing for the presence of, amongst others, measles, mumps, rubella, varicella-zoster virus (VZV), and parvovirus B19 Immunoglobulin G (IgG)
antibodies was conducted on large representative
national serum banks in Belgium [10]. Serum samples
were collected, between 2001 and 2003, from residual blood samples used for routine laboratory testing (indi-viduals aged < 18 years) or from blood donors (18 years and over). This survey was designed as proposed by the European Sero-Epidemiology Network (ESEN) which aimed to standardize the serological surveillance of
immunity to various diseases in European countries [11].
In particular, children and adolescents were oversampled in the survey. A total of 3378 samples were collected and the age of the individuals ranged from 0 to 65 years. The number of samples with immunological status with regard to measles, mumps, rubella, VZV, and parvovirus B19 infections were 3190, 3004, 3195, 3256, and 3080, respectively. Since a national immunisation programme against measles, mumps, and rubella has been intro-duced in 1985 in Belgium with gradually increasing vaccine coverage in the targeted age groups (infants,
adolescents aged 11–13 years, and catch-up campaigns
in adults), endemic equilibrium for these infections in 2002 cannot be assumed. In contrast, no immunisation programme against VZV and parvovirus B19 has been introduced, making endemic equilibrium a tenable assumption for both infections.
Models
Here, we briefly present an overview of the methods used to derive key epidemiological parameters from serological survey data and we refer to Hens et al. [2] for a more in-depth explanation of the methodology. We start from the basic concept of an age-specific preva-lence and gradually move to the force of infection and other parameters such as the basic and effective reproduction numbers in endemic equilibrium.
the Susceptible-Infectious-Recovered (SIR) model, de-scribes the flow between the susceptible (S), the infected and infectious (I), and the recovered class (R). The fol-lowing set of partial differential equations in continuous age and time can be used to describe the SIR dynamics mathematically:
∂S að ;tÞ ∂a þ
∂S að ;tÞ
∂t ¼−λð Þa;tS að ;tÞ−μða;tÞS að ;tÞ; ∂I að ;tÞ
∂a þ∂I að∂t;tÞ¼λða;tÞS að ;tÞ−σða;tÞI að ;tÞ−μða;tÞI að ;tÞ; ∂R að ;tÞ
∂a þ ∂R að ;tÞ
∂t ¼σða;tÞI að ;tÞ−μða;tÞR að ;tÞ;
8 > > > > > < > > > > > :
with the age- and time-specific population size given by N(a,t) =S(a,t) +I(a,t) +R(a,t) and with λ(a,t) the force of infection, σ(a,t) the recovery rate, and μ(a,t) the all-cause mortality rate.
Assuming a closed population of size N in
demo-graphic and endemic equilibrium, we obtain a set of or-dinary differential equations (ODEs):
dS að Þ
da ¼−λð Þa S að Þ−μð ÞaS að Þ; dI að Þ
da ¼λð ÞaS að Þ−σð Þa I að Þ−μð Þa I að Þ; dR að Þ
da ¼σð Þa I að Þ−μð Þa R að Þ:
8 > > > > > < > > > > > :
Solving the above set of ODEs, the following
expres-sion for the seroprevalence of individuals of age a is
obtained:
πð Þ ¼a 1−exp −
Z a
0
λð Þudu
:
The above equation can be solved numerically by using a discrete age class framework, thereby assuming a constant force of infectionλkin each age class [a[k],a[k+ 1]],k= 1,⋯,J[13]. The seroprevalence at ageain thejth age interval is approximated by:
πð Þ ¼a 1−exp −X j−1
k¼1
λka½kþ1−a½ k−λja−a½ j
!
;
ð1Þ
wherea[1]= 0 anda[J+ 1]=L(the life expectancy). This model assumes that the infection-related morta-lity can be neglected, which is tenable for the infections studied in the present paper, and that the total population size is constant over time (i.e. the number of births and deaths are balanced) with a constant age distribution.
From this model, other key epidemiological parame-ters can be calculated such as the basic and effective
reproduction number (R0 and Reff respectively; Reff
reflects the actual average number of secondary cases that can be observed in a partially immune population) or the average age at infection.
Since seropositive results for measles, mumps, and ru-bella are a mix of vaccine- and infection-induced im-munity, implying time-heterogeneity which is beyond the scope of this paper, only the age-specific seropreva-lence for these diseases was modelled. We considered a logistic model with piecewise constant prevalence values within the following age classes based (partially) on vac-cination policies: [1,2), [2,11), [11,16), [16,21), [21,31), and [31,65] years. The estimates of the coefficients using this model (on the logit scale) are denoted by^β.
For VZV and parvovirus B19 infections, for which an endemic equilibrium is tenable in Belgium, three mathe-matical models for estimating the force of infection, used in previous studies [2,14–16], were considered.
The first model is a Maternally-derived
immunity-Sus-ceptible-Infectious-Recovered (MSIR) model with
piecewise constant force of infection. An MSIR com-partmental model adds to the basic SIR model a stage describing newborns and infants protected by maternally
acquired immunity (class M) [17]. This model assumes
that newborns and infants are protected by maternal anti-bodies and that this immunity is promptly lost at a given
ageA. Newborns and infants are then assumed to be
sus-ceptible to infection (class S), they may become infected
and infectious (classI), before recovering from the infec-tion (class R). The seroprevalence at age ain thejthage interval is approximated by, which is a slight adaptation of the model in (Eq.1):
πð Þ ¼a 1−exp −X j−1
k¼1
λk a½kþ1−a½ k
−λj a−a½ j
!
;
witha[1]=A, whereAis the age at which maternal
im-munity is lost. In this paper, we considered an MSIR model with piecewise constant force of infection within the following six age classes: [1,2), [2,6), [6,12), [12,19), [19,31), and [31,65] years. These age groups account for the Belgian schooling system, the fact that infection mainly takes place among young age groups, and for which similar forces of infection are expected between ages in a given age group. Note that, in general, the choice of these age categories is often done on an ad-hoc basis.
The second model considered in this paper is the exponentially damped model for the force of infection as
described by Farrington [14]. This model is based on the
λð Þ ¼a ðα1a−α3Þe−α2aþα3;
with α1, α2 and α3 the model parameters to be
esti-mated from the data. Integrating λ(a) results in a
non-linear model for the seroprevalence, i.e.,
πð Þ ¼a 1−exp αα1 2ae
−α2aþ 1
α2
α1
α2−α 3
e−α2a−1
½ −α3a
:
We considered a third model for parvovirus B19 infec-tion, a mathematical model allowing for boosting and waning immunity, since lifelong protection against infec-tion upon recovery from parvovirus B19 is quesinfec-tionable [18–22], which would limit the use of the two previous models. Goeyvaerts et al. [16] investigated several exten-sions of the MSIR model to determine whether waning of disease-acquired antibodies and/or boosting of low immunity by exposure to infectious individuals should be accounted for. Here, we used the model with the best Akaike information criterion (AIC) value which was the compartmental model allowing for age-specific waning of disease-acquired antibodies and boosting of low
immunity, denoted by “MSIRWb-ext AW” (see
Additional file 1). More specifically, waning was
mo-delled using an additional state (W) with age-specific
rates: individuals moved from the high immunity stateR
to the low immunity state Wat a rate ε1and ε2for age
group < 35 and≥35 years respectively. The boosting rate was assumed to be proportional to the force of infection
by a factor of φ. The transmission rates were assumed
to be directly proportional to age-specific rates of mak-ing social contact with a proportionality factorq.
Samples from children aged less than 1 year (6 months in the MSIRWb-ext AW model to be consistent with the original article) were omitted in our analyses because of distortions expected from the presence of maternal
antibodies against the various pathogens and low
number of samples of that age (n= 13).
The first two columns of Table 1 show a summary of
the models used for each of the pathogens studied. Formulas to calculate the various epidemiological pa-rameters (i.e., age-standardized seroprevalence and force of infection, R0, Reff, and the average age of infection)
can be found in Additional file1. The age-specific
sero-prevalence and force of infection were calculated in the following age groups: [1,2), [2,6), [6,12), [12,19), [19,31), and [31,65] years for each pathogen (including measles, mumps, and rubella for easier reading).
Estimating the model parameters
Maximum likelihood estimates were obtained for each model and pathogen assuming that the observed pre-valence follows a binomial distribution. Using the estimated values of the parameters for each model and pathogen (with age values rounded down to
inte-ger values), age-specific “true” prevalence values were
calculated which were used in the simulations (see next section).
Simulations
Three age structures were compared: the age structure derived from the pathogen-specific data of the sero-logical survey in which children and adolescents were oversampled (survey-based), the age structure of the
Belgian population in 2003 (population-based) [23], and
a uniform age structure (see Additional file1: Figure S1
and Table S1).
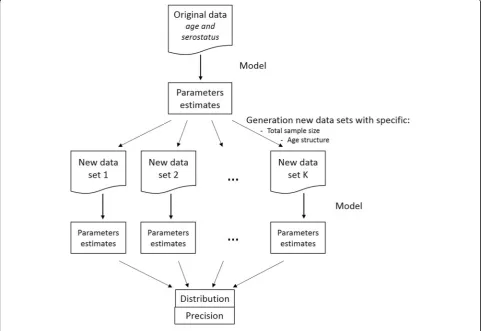
To compare the age-based sampling structures and determine the optimal allocation of samples over age groups, 500 (new) datasets were generated using a
bino-mial distribution and the age-specific “true” prevalence
values obtained for each model. We used several values
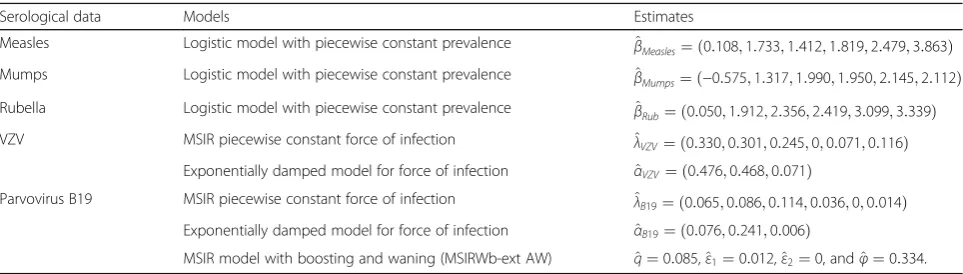
Table 1Summary of the models considered for each of the pathogens and the corresponding model parameter estimates using the observed serological survey data
Serological data Models Estimates
Measles Logistic model with piecewise constant prevalence β^Measles¼ ð0:108;1:733;1:412;1:819;2:479;3:863Þ Mumps Logistic model with piecewise constant prevalence β^Mumps¼ ð−0:575;1:317;1:990;1:950;2:145;2:112Þ Rubella Logistic model with piecewise constant prevalence β^Rub¼ ð0:050;1:912;2:356;2:419;3:099;3:339Þ VZV MSIR piecewise constant force of infection ^λVZV¼ ð0:330;0:301;0:245;0;0:071;0:116Þ
Exponentially damped model for force of infection α^VZV¼ ð0:476;0:468;0:071Þ
Parvovirus B19 MSIR piecewise constant force of infection ^λB19¼ ð0:065;0:086;0:114;0:036;0;0:014Þ Exponentially damped model for force of infection α^B19¼ ð0:076;0:241;0:006Þ
MSIR model with boosting and waning (MSIRWb-ext AW) ^q¼0:085,^ε1¼0:012,^ε2¼0, andφ^¼0:334. VZVvaricella-zoster virus,MSIR modelMaternally-derived immunity-Susceptible-Infectious-Recovered model.^β: coefficient estimates (logit scale) within the age classes [1,2), [2,11), [11,16), [16,21), [21,31), and [31,65] years.^λ: estimates of the force of infection within the age classes [1,2), [2,6), [6,12), [12,19), [19,31), and [31,65] years.^α: estimates of the three parameters describing the exponentially damped model.^q: estimated proportionality factor between the transmission and contact rates;εb1andεb2: estimated rates at which individuals moved from the high immunity stateRto the low immunity stateWfor age group < 35 and≥35
of the total sample size (N= 1650, 3300, 6600, 9900, 13,200, or 19,800) and the number of samples across age depended on the age-based sampling structure or allo-cation distribution used. Each dataset was then fitted with the corresponding model to obtain a distribution of the parameters values and the precision. Here, the opti-mal allocation was determined by calculating the preci-sions obtained using different distributions. To restrict the number of distributions to compare, we varied the proportions among the six age groups ([1,2), [2,6), [6,12), [12,19), [19,31), and [31,65] years) from 10 to 50% (leading to 126 distributions) and assuming a
uniform distribution within each age group. Figure 1
gives a schematic representation of the approach used in this paper. The precision was defined to be half the length of the 95% percentile-based confidence interval (CI) calculated over the 500 simulations. For the sero-prevalence and force of infection by age group, the age distribution providing the best joint precision, defined as the sum of the precisions in each age group, is reported.
In the MSIR model with piecewise constant force of infection for the VZV infection, simulations with biologically implausible estimated values (> 10) were excluded; such values were obtained in the age group
> 30 years due to a simulated prevalence of 100% in this age group. These simulations were replaced.
All analyses were performed using R software (version 3.3.1) [24].
Results
Estimates of the model parameters obtained using the observed serological survey data
The model estimates for each of the different pathogens
are given in Table 1. Additional file 1: Figure S3 shows
the estimated prevalence and force of infection for each model and disease. The models provided overall good fits and the results were close between the models. How-ever, for parvovirus B19, the exponentially damped model was not able to capture the decrease in seropreva-lence around age 30. In contrast, as expected, the MSIRWb-ext AW model was able to capture this decrease, albeit only partly. In this model, the force of infection had a bimodal shape (with modes around ages 7 and 35 years; Additional file1: Figure S3).
Since our simulations were based on integer age values, the MSIR and MSIRWb-ext AW models were re-run after rounding continuous age values down to integers; however, the estimates were close when using
continuous or integer values. The estimates obtained using the MSIR model with piecewise constant force of infection within the age classes [1,2), [2,6), [6,12), [12,19), [19,31), and [31,65] years were: ^λB19¼ ð0:077;0:
104;0:100;0:035;0;0:014Þ,^λVZV ¼ ð0:404;0:337;0:200;0
;0:076;0:113Þ. The following estimates were obtained
using the MSIRWb-ext AW model for parvovirus B19:^q
¼0:089, εb1¼0:014, εb2¼0, and φ^ ¼0:359. Estimates
of the prevalence and force of infection (overall and by
age groups), R0, average age at infection, and Reff are
provided in Additional file1: Tables S2-S4.
Comparisons of the three age-based sampling structures Because similar results were obtained when generating 1000 or 1500 datasets, only the results based on 500 simulations are presented. For the overall seroprevalence of measles and VZV, in both models used, the survey-based age structure led to the best precision (Figs.2 and 3, Additional file1: Table S5, Tables S8-S9). However, when modelling mumps and parvovirus B19, in the three models used, the precision of the overall seroprevalence was found to be better using a uniform
or population-based age structure (Figs. 2 and 4,
Additional file1: Table S6, Tables S10-S12). Finally, the precision for the estimated overall rubella seropreva-lence was similar for the three different age structures (Fig.2, Additional file1: Table S7).
The precision of the estimated overall force of infec-tion was better when using the survey-based age
struc-ture for VZV infection, in both models used (Fig. 3,
Additional file1: Tables S8-S9), and for parvovirus B19
infection under the MSIRWb-ext AW model, and using a uniform or population-based age structure for
parvo-virus B19 infection in the two other models used (Fig.4,
Additional file1: Tables S10-S12).
For all the pathogens, as could be expected given the oversampling in children and adolescents in the survey-based age structure, the precision of the estimated seroprevalence by age group was better when using the survey-based age structure in the young age groups and the uniform or population-based age structure for the
oldest age groups (Additional file 1: Tables S5-S12).
The same pattern was observed for the force of in-fection of VZV and parvovirus B19 by age group
(Additional file 1: Tables S8-S12).
In the exponentially damped model, the precision of R0 and the average age at infection was slightly better using the uniform or population-based age structure for parvo-virus B19 while it was better using the survey-based age
structure for VZV (Additional file1: Tables S8 and S10).
In the MSIRWb-ext AW model, the precision of R0, Reff, and the average age at infection of parvovirus B19 was slightly better using the survey-based age structure while
that of the relative boosting factor (φ) was better
using the uniform or population-based age structure (Additional file1: Figure S4 and Table S12). However, the precision of this factor was poor, with large confidence intervals, and the average age at infection should be inter-preted with caution given the bimodal force of infection.
Sample size needed
To obtain a 2% precision around the overall seropreva-lence estimate, the sample size needed would be around 1650 for mumps and parvovirus B19, while a lower number of samples would be sufficient for measles, VZV, and rubella; to obtain a 1% precision the sample size needed would be around 6600 for mumps and parvovirus B19, and 1650 for measles, VZV, and rubella (Figs.2,3, and4; Additional file1: Tables S5-S12). These results were quite consistent across age structures.
Optimal allocation of a fixed sample size among age groups
For the overall seroprevalence of measles, mumps, or rubella, the optimal allocation (distribution over age groups) of a fixed number of samples would be a distri-bution with a high percentage of the data among age groups [19,31) and [31,65] years, for each sample size
used (Additional file 1: Table S13-S15). Regarding the
seroprevalence by age group, for measles, mumps and rubella, we have noticed some variations across the sample sizes; the optimal allocations were broadly uniform across the age groups.
The optimal allocation for the overall VZV seropreva-lence or force of infection estimates varied with sample size; the oldest two age groups would rather be favoured (Fig.5and Additional file1: Tables S16-S17). The optimal allocation for the overall parvovirus B19 seroprevalence estimate would be a distribution with a high percentage of data in the oldest age group, for each model and sample
size used (Fig. 5 and Additional file 1: Tables S18-S20).
Regarding the overall force of infection of parvovirus B19, the optimal allocation would entail a distribution with high percentage among the oldest age group in the MSIR model with piecewise constant force of infection and exponentially damped model, while more equally dis-tributed over the various age groups for the MSIRWb-ext AW model.
Regarding the seroprevalence or force of infection by age group for VZV and parvovirus B19, some variations between models and sizes were observed; the optimal allocations were broadly uniform across the age groups.
Discussion
time constraints for performing a serological survey. Since analytical formulas for complex models are not available, simulation-based analyses are a flexible alter-native to address these considerations. In this paper, we proposed a simulation-based approach for sample size and age structure considerations, and optimal allocation of resources, in order to estimate key epidemiological parameters with acceptable levels of precision within the context of a single cross-sectional serological survey.
Our results showed that the best age structure to use in the sampling of a serological study as well as the opti-mal allocation distribution varied with the epidemio-logical parameters of interest. To our knowledge, only a
few studies investigated, using mathematical or statistical models, the optimal allocation of a given number of samples over age groups to obtain good precision.
Marschner [4] showed, using an example of measles
infection, that a uniform age distribution should not be optimal to obtain a good joint precision of the force of infection.
groups. Moreover, because of the formulas used to com-pute the basic or effective reproduction number and the average age at infection, the age structure best suited to estimate these parameters was related to that of the prevalence in the exponentially damped model and of the force of infection in the MSIRWb-ext AW model. In case the boosting rate is of interest, sufficiently sampling adults is essential. Anyway, the precision of this rate was poor as was also observed in previous analyses [16]. This could be explained by the complexity of the model used.
Our results showed that, to reach a given precision level around the overall seroprevalence estimate, the sample size needed would be higher for mumps and parvovirus B19 infections, compared to measles, VZV, and rubella infections. This may be explained by the fact that the prevalence levels across age groups were less
variable for measles, VZV, and rubella, with a prevalence reaching relatively high values at young ages, compared to mumps and parvovirus B19.
An important finding was that the age-specific prevalence profile, and thus the age-specific force of infection profile, had an effect on the optimal age structure to use in a serological survey or the optimal allocation for estimating the overall seroprevalence. Indeed, the optimal age structure varied between VZV and parvovirus B19 infections, the seroprevalence increasing more sharply between ages 1 and 10 for VZV compared to parvovirus B19.
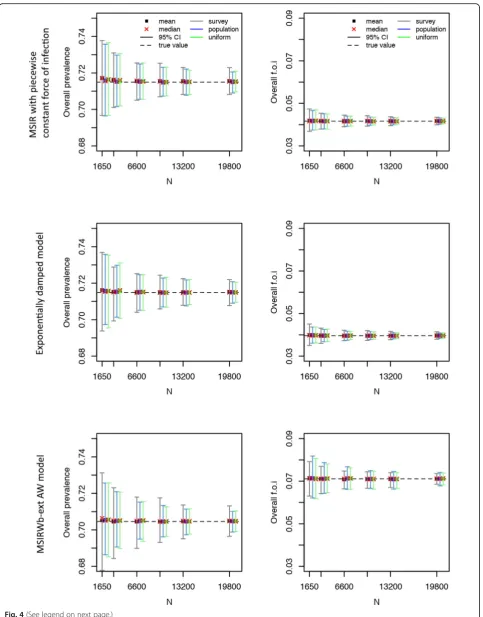
(See figure on previous page.)
Fig. 4Parvovirus B19 serological data: mean, median, and 95% confidence interval for the overall seroprevalence (left) and overall force of infection (right) over 500 simulations as a function of the total number of sampled individuals (N) for the Maternally-derived immunity-Susceptible-Infectious-Recovered (MSIR) model with piecewise constant force of infection (top), the exponentially damped model (middle), and the MSIR model allowing for age-specific waning of disease-acquired antibodies and boosting of low immunity (MSIRWb-ext AW) model (bottom).“True”overall seroprevalence is the estimated overall seroprevalence using the models on the observed serological data (with integer age values)
time but oscillates around a stationary average value. However, although VZV or parvovirus B19 infections may undergo regular epidemic cycles, the serological survey took place on a relatively long time period (around 17 months), which would average these poten-tial cycles. Moreover, this would have a limited impact on our results [25]. For parvovirus B19, although lifelong pro-tection against infection upon recovery is questionable, this does not seem to be due to time heterogeneity since similar patterns were seen in other countries at different time points [18,20,21].
Our analyses could be extended to power analyses in the context of hypothesis testing. Indeed, data sets could be simulated assuming that an alternative hypothesis is true, then tested against the null hypothesis to calculate the proportion of simulated data sets in which the null hypothesis is rejected, thereby providing an estimate of the statistical power. Other possible extensions are related to non-endemic settings. An endemic equilib-rium cannot be assumed for vaccine-preventable infec-tions such as measles, mumps, and rubella for which a national immunisation programme is in place. In such settings, dynamical mathematical models allowing time considerations could be used to calculate the sample size needed for estimating time-varying parameters with acceptable precision levels or to perform power calcu-lations to detect changes in parameter values over time, but this needs to be investigated. In particular, these ana-lyses could make use of serial seroprevalence surveys (i.e., repeated collections of cross-sectional population-representative serological samples) [9]. Finally, our ana-lyses could also be extended to more complex models, for example transmission models including maternal antibody waning in newborns or incorporating the pres-ence of individual heterogeneities [26,27].
Our analyses had some limitations. First, the number of age groups to optimally allocate a given number of samples had to be limited to avoid a huge number of combinations. Here, six age groups were used leading to 126 distributions. Alternative age groups of interest or a predetermined age distribution (e.g., derived from pre-vious surveys or population-based) can be used. More-over, the optimal allocation will depend on the rule used to calculate the joint precision. Here, we used the sum of the age-specific precisions. Alternative rules could be considered such as the sum of the relative precisions. However, favouring very small values could result in a very large sample size or be of less interest (e.g., if force of infection in older age groups is known to be small).
Second, the use of measurements of antibody levels based on diagnostic tests relies on the assumption of a perfect test (i.e., both sensitive and specific). In lack of which, discrepancies between the seroprevalence and the disease prevalence are observed in the presence of
misclassification, which would alter the estimates of the overall and age-specific prevalence, even more if sensi-tivity and specificity vary with age [28]. The estimate of the seroprevalence can be corrected if estimates of the sensitivity and specificity of the test(s) applied are avail-able [29]. Alternatively, mixture modelling of continuous antibody titres can be used; however the combination of this technique with mathematical models needs further investigations [2, 30–32]. In the current work, conside-ring misclassifications negligible appeared reasonable.
Finally, like other standard methods, the approach presented here would require prior knowledge about parameter values: e.g., (sero)prevalence or force of infec-tion by age (group) to simulate data. However, sensitivity analyses may be performed to assess how this prior knowledge affects the sample size needed or optimal allocation and would inform about the minimum sample size needed. Here, data from 2002 were used to illustrate our approach but, although the endemic equilibrium assumption for parvovirus B19 and VZV is believed to be reasonable, more recent estimates should be used to plan future studies.
In any case, the choice of sampling design or model-ling approach should be adapted to prior knowledge about the infection and the precision of estimates (over-all or age-specific) should be considered in the context of the study goals and the anticipated implications for infec-tion control measures or vaccine programs.
Conclusions
The main conclusions from the presented analyses are that attention should be given to the age-based sampling structure when estimating key epidemiological parame-ters with acceptable levels of precision within the con-text of a single cross-sectional serological survey, and that simulation-based sample size calculations in com-bination with mathematical modelling can be utilised for choosing the optimal allocation of a given number of samples over various age groups.
Additional file
Additional file 1:Supplementary material. (PDF 1693 kb)
Abbreviations
CI:confidence interval; ESEN: European Sero-Epidemiology Network; GLM: generalized linear model; MSIR model: Maternally-derived immunity-Susceptible-Infectious-Recovered model; MSIRWb-ext AW model: MSIR model allowing for age-specific waning of disease-acquired antibodies and boosting of low immunity; ODE: ordinary differential equation; SIR model: Susceptible-Infectious-Recovered model; VZV: varicella-zoster virus
Acknowledgements
Funding
This work received funding from the European Research Council (ERC) under the European Union’s Horizon 2020 research and innovation programme (grant agreement 682540–TransMID). The funder had no role in the design of the study and collection, analysis, and interpretation of data and in writing the manuscript.
Availability of data and materials
The datasets and code files can be obtained from the corresponding author upon request.
Authors’contributions
NH and SB conceived and designed the study. SB performed the numerical simulations. SB, SAH, SA, AL, HT, and NH contributed to the interpretation of the results. SB drafted the first version of the manuscript. SB, SAH, SA, AL, HT, and NH edited the manuscript and approved the final version.
Ethics approval and consent to participate
Ethical approval for the setup of the 2002 serum set was obtained from the Ethics Committee of the University of Antwerp. Since the samples were de-identified, consent was deemed unnecessary according to national regula-tions (decrees KB 13/02/2001 and KB 17/12/2003).
Consent for publication Not applicable.
Competing interests
The authors declare that they have no competing interests.
Publisher’s Note
Springer Nature remains neutral with regard to jurisdictional claims in published maps and institutional affiliations.
Author details
1Centre for Health Economics Research and Modelling Infectious Diseases
(CHERMID), Vaccine and Infectious Disease Institute (VAXINFECTIO), University of Antwerp, Antwerp, Belgium.2Institute for Medical Informatics, Statistics
and Documentation, Medical University of Graz, Graz, Austria.3Interuniversity Institute for Biostatistics and statistical Bioinformatics, UHASSELT, Hasselt University, Hasselt, Belgium.4Centre for the Evaluation of Vaccination, Vaccine and Infectious Disease Institute (VAXINFECTIO), University of Antwerp, Antwerp, Belgium.5Service of Epidemiology of infectious diseases, Scientific Directorate Epidemiology and Public Health, Sciensano, Brussels, Belgium.
Received: 29 May 2018 Accepted: 25 February 2019
References
1. Metcalf CJ, Farrar J, Cutts FT, Basta NE, Graham AL, Lessler J, et al. Use of serological surveys to generate key insights into the changing global landscape of infectious disease. Lancet. 2016;388(10045):728–30. 2. Hens N, Shkedy Z, Aerts M, Faes C, Van Damme P, Beutels P. Modeling
infectious disease parameters based on serological and social contact data: a modern statistical perspective. New York: Springer; 2012.
3. Herzog SA, Blaizot S, Hens N. Mathematical models used to inform study design or surveillance systems in infectious diseases: a systematic review. BMC Infect Dis. 2017;17(1):775.
4. Marschner IC. Determining the size of a cross-sectional sample to estimate the age-specific incidence of an irreversible disease. Stat Med. 1994;13(22):2369–81.
5. Keiding N. Age-specific incidence and prevalence - a statistical perspective. J R Stat Soc Ser A Stat Soc. 1991;154:371–412.
6. Nishiura H, Chowell G, Castillo-Chavez C. Did modeling overestimate the transmission potential of pandemic (H1N1-2009)? Sample size estimation for post-epidemic seroepidemiological studies. PLoS One. 2011;6(3):e17908. 7. Sepulveda N, Drakeley C. Sample size determination for estimating antibody
seroconversion rate under stable malaria transmission intensity. Malar J. 2015;14:141.
8. Sepulveda N, Paulino CD, Drakeley C. Sample size and power calculations for detecting changes in malaria transmission using antibody
seroconversion rate. Malar J. 2015;14:529.
9. Vinh DN, Boni MF. Statistical identifiability and sample size calculations for serial seroepidemiology. Epidemics. 2015;12:30–9.
10. Nardone A, Miller E. Serological surveillance of rubella in Europe: European Sero-epidemiology network (ESEN2). Euro Surveill. 2004;9(4):5–7. 11. Osborne K, Weinberg J, Miller E. The European Sero-epidemiology network.
Euro Surveill. 1997;2(4):29–31.
12. Hens N, Aerts M, Faes C, Shkedy Z, Lejeune O, Van Damme P, et al. Seventy-five years of estimating the force of infection from current status data. Epidemiol Infect. 2010;138(6):802–12.
13. Becker NG. Analysis of infectious disease data. London: Chapman and Hall; 1989.
14. Farrington CP. Modelling forces of infection for measles, mumps and rubella. Stat Med. 1990;9(8):953–67.
15. Goeyvaerts N, Hens N, Ogunjimi B, Aerts M, Shkedy Z, Van Damme P, et al. Estimating infectious disease parameters from data on social contacts and serological status. J R Stat Soc Ser C-Appl Stat. 2010;59:255–77.
16. Goeyvaerts N, Hens N, Aerts M, Beutels P. Model structure analysis to estimate basic immunological processes and maternal risk for parvovirus B19. Biostatistics. 2011;12(2):283–302.
17. Anderson R, May R. Infectious diseases of humans: dynamics and control. Oxford: Oxford University Press; 1991.
18. Schoub BD, Blackburn NK, Johnson S, McAnerney JM. Primary and secondary infection with human parvovirus B19 in pregnant women in South Africa. S Afr Med J. 1993;83(7):505–6.
19. Kaufmann J, Buccola JM, Stead W, Rowley C, Wong M, Bates CK. Secondary symptomatic parvovirus B19 infection in a healthy adult. J Gen Intern Med. 2007;22(6):877–8.
20. Vyse AJ, Andrews NJ, Hesketh LM, Pebody R. The burden of parvovirus B19 infection in women of childbearing age in England and Wales. Epidemiol Infect. 2007;135(8):1354–62.
21. Huatuco EM, Durigon EL, Lebrun FL, Passos SD, Gazeta RE, Azevedo Neto RS, et al. Seroprevalence of human parvovirus B19 in a suburban population in Sao Paulo, Brazil. Rev Saude Publica. 2008;42(3):443–9.
22. Nysen R. Parametric and semi-parametric model strategies with applications in chemical and microbial risk assessment. PhD thesis. Hasselt: Hasselt University; 2016.
23. EUROSTAT. Population on 1 January 2003 by age and sex, Belgium. [data table]http://ec.europa.eu/eurostat/data/database. Accessed 12 June 2017. 24. R Core Team. R: A language and environment for statistical computing.
Vienna: R Foundation for Statistical Computing; 2017.
25. Whitaker HJ, Farrington CP. Estimation of infectious disease parameters from serological survey data: the impact of regular epidemics. Stat Med. 2004;23(15):2429–43.
26. Abrams S, Hens N. Modeling individual heterogeneity in the acquisition of recurrent infections: an application to parvovirus B19. Biostatistics. 2015;16(1):129–42.
27. Abrams S, Aerts M, Molenberghs G, Hens N. Parametric overdispersed frailty models for current status data. Biometrics. 2017.https://doi.org/10.1111/ biom.12692.
28. Nokes DJ, Enquselassie F, Nigatu W, Vyse AJ, Cohen BJ, Brown DW, et al. Has oral fluid the potential to replace serum for the evaluation of population immunity levels? A study of measles, rubella and hepatitis B in rural Ethiopia. Bull World Health Organ. 2001;79(7):588–95.
29. Rogan WJ, Gladen B. Estimating prevalence from the results of a screening test. Am J Epidemiol. 1978;107(1):71–6.
30. Gay NJ. Analysis of serological surveys using mixture models: application to a survey of parvovirus B19. Stat Med. 1996;15(14):1567–73.
31. Vyse AJ, Gay NJ, Hesketh LM, Morgan-Capner P, Miller E. Seroprevalence of antibody to varicella zoster virus in England and Wales in children and young adults. Epidemiol Infect. 2004;132(6):1129–34.