A Novel Hybrid Approach for Email Spam
Detection based on Scatter Search Algorithm
and K-Nearest Neighbors
Samira Amjad1, Farhad Soleimanian Gharehchopogh21- Department of Computer Engineering, Maragheh Branch, Islamic Azad University, Maragheh, Iran.
2- Department of Computer Engineering, Urmia Branch, Islamic Azad University, Urmia, Iran.([email protected])
Received (2019-04-01) Accepted (2019-06-04)
Abstract: Because cyberspace and Internet predominate in the life of users, in addition to
business opportunities and time reductions, threats like information theft, penetration into systems, etc. are included in the field of hardware and software. Security is the top priority to prevent a cyber-attack that users should initially be detecting the type of cyber-attacks because virtual environments are not monitored. Today, email is the foundation of many internet attacks that have happened. The Hackers and penetrators are using email spam as a way to penetrate into computer systems junk. Email can contain viruses, malware, and malicious code. Therefore, the type of email should be detected by security tools and avoid opening suspicious emails. In this paper, a new model has been proposed based on the hybrid of Scatter Searching Algorithm (SSA) and K-Nearest Neighbors (KNN) to email spam detection. The Results of proposed model on Spambase dataset shows which our model has more accuracy with Feature Selection (FS) and in the best case, its percentage of accuracy is equal to 94.54% with 500 iterations and 57 features. Also, the comparison shows that the proposed model has better accuracy compared to the evolutionary algorithm (data mining and decision detection such as C4.5).
Keywords: Email Spam Detection, K-Nearest Neighbors, Scatter Searching Algorithm, Feature
Selection
I. INTRODUCTION
S
ending email via the free internet services such as Gmail and Yahoo mail, have been become an ordinary tradition for communication between the users and even prominent people, politician, employees, business managers sensitive jobs are using from this service for sending the message. Definitely, the use of these free services is very easy and good services are provided to users, but personal information of users may be placed on advertising agencies, malicious intruders, spy systems, and superpowers of theworld of technology that its result is sending spam to email users [1]. Today email is one of the most common human communication tools in daily life. However, generality and simplicity of using email have caused till to be the basis of the misuse of spammers and Internet hackers. Because the sending of millions of e-mail spams causes users' harassment, waste of time, costs, network resources, and bandwidth. So email spam has become a critical problem.
With development of cyberspace and the advancement of the new technologies and its extensiveness, it needs is felt that internet users should enhance their knowledge and How to cite this article:
technical information same as technology progress and they should effectively step toward increasing coefficient of security and reducing for cyberspace offences. Everyday cyber crooks appears in variant deceitful way. They get most profit on the cyberspace and to reach their criminal purposes [2]. More than 90% of the Internet emails exchanged are mail spam, which is a significant number of fake emails, and users are often misled because they are unaware from the contents inside the emails [3]. Email spams are not just garbage, and since they include virus attachments and spy software that can be a serious hazard to the recipient and cause their information to be removed. Therefore we need to tools in order to email spam detection [4]. Email spam is kind of email which is sent to users in order to harassment, advertising or distribution of the virus [5]. Every day we face a huge amount of email spam from anonymous sites and users. Email spam is unpleasant dilemma for users who are constantly using the internet and email.
This paper proposes a new approach for email spam detection using the improved KNN [6, 7] and Scatter Search Algorithm (SSA) [8-10]. The KNN used for classifying examples and it is based on a sample with K samples which have more similar characteristics, it is classified. In this case, K sample based on distance to the new sample will be identified and it class that has most similarity for new sample is identified as a result of class for new sample. In this paper, email spam detection is based on improved SSA-KNN. Using the SSA the most important features are selected and in order to classifying are delivered to KNN.
The remainder of this paper is organized as follows: In section 2, the recent literature on email spam detection is reviewed. Section 3, describes the proposed model. Experimental results are presented in Section 4 and finally, in Section 5, the drawn conclusions and future works are presented.
II. RELATED WORKS
So far, several techniques have been developed to email spam detection, each technique works based on a specific method. In most methods, data mining algorithms and meta-heuristic algorithms are used.
A new e-mail detection approach based on an improved Negative Selection Algorithm (NSA) called combined clustered NSA and fruit fly optimization (CNSA–FFO) has been proposed [11]. The system combined actual NSA with k-means clustering and FFO to enhance the efficiency of classic NSA. This method initially employs k-means clustering to generate the self-set clusters and then uses the FFO algorithm for the training stage to optimize the random generated detectors. In the testing phase of the proposed CNSA-FFO, both cluster and detector sets are used to classify whether an e-mail sample is a spam. If the sample is undetected by any of the detectors, then it should be assigned to the nearest set and added as a new detector. The dataset used in this study were obtained from Spambase dataset of e-mail messages. This benchmark contains 4601 messages, in which 1813 (39%) of the messages are marked as spam, whereas 2788 (61%) are labeled as non-spam. Experiments results in spam benchmark show that the performance of CNSA–FFO is better than the classic NSA and NSA-PSO, especially in terms of detection accuracy, positive prediction, and computational complexity.
Shuaib et al. [12] proposed the whale optimization algorithm (WOA), for the selection of salient features in the email corpus and rotation forest algorithm for classifying emails as spam and non-spam. The entire datasets were used, and the evaluation of the rotation forest algorithm was done before and after feature selection with WOA. The results obtained showed that the rotation forest algorithm after feature selection with WOA was able to classify the emails into spam and non-spam with a performance accuracy of 99.9% and a low FP rate of 0.0019 on Spambase dataset. This shows that the proposed method had produced a remarkable improvement as compared with some previous methods.
accuracy than the Support Vector Machine (SVM).
A new hybrid model based on the combining Intelligent Water Drops (IWD) algorithm and Naïve Bayes (NB) has been proposed for email spam detection [14]. The IWD algorithm is an algorithm based on swarm optimization from the view of the natural water drops that have inspired based on flows of water in the river. In the model of the combination of the IWD algorithm for FS and NB is used for classifying the sample. The results demonstrated that the percentage of accuracy of the hybrid model on SPAMBACE equal is to 94%.
In [15], the authors have presented the application of a classification model to classify spam emails from using a model- Deep Support Vector Machine (Deep SVM). Moreover, other classifier models like Support Vector Machine (SVM), Artificial Neural Network models have also been implemented to compare the performance of proposed Deep SVM model. Furthermore analysis has been done to compare all the performances using available numerical statistics obtained from these models to find the best model for the purpose. Fundamental criteria like Area under curve (AUC), Accuracy, F1 score, Recall, Precision were used to compare the models. Curves for ROC, Lift, Precision, and Recall are used for graphical analysis of the performances of these aforementioned models. The fundamental idea is to analyze performance of above mentioned models with each other and possibly find the best among them. The data set consists of 4601 instances. The performance of Deep SVM was significantly greater than that of other models with an accuracy of 92.8% while SVM and Artificial NN models fared at values of 89.2% and 91.2% respectively.
In [16], an integrated approach of machine learning based Naive Bayes (NB) algorithm and computational intelligence based Particle Swarm Optimization (PSO) is used for the email spam detection. Here, NB algorithm is used for the learning and classification of email content as spam and non-spam. PSO has the stochastic distribution & swarm behavior property and considered for the global optimization of the parameters of NB approach. For experimentation, dataset of Ling spam dataset is considered and evaluated the performance in terms of precision,
recall, f-measure, and accuracy. Based on the evaluated results, PSO outperforms in comparison with individual NB approach.
Hybrid model of DT and Logistic Regression (LR) has been proposed to spam base detection [17]. In the hybrid model of the LR for noise reduction and DT for creating rules and detecting spam examples have been used. The evaluation has been done on Spambase. The results showed that accuracy in the hybrid model is equal to 91.67%.
Abdolahnezhad and Banirostam [18] proposed an e-mail detection system based on the modified classic NSA called NSA-II. This model improves the random generation of a detector in NSA using spam and non-spam spaces. In the NSA-II training phase, two sets of detectors are generated, one for spam detectors and other for non-spam detectors. The detectors output from the two sets are used in the testing phase. If one of the spam detectors identified a new pattern, then the e-mail realizes the spam pattern; otherwise, the pattern is considered as a non-spam pattern. The experimental result in spam base dataset shows that the detection performance of NSA-II is higher than the conventional.
Bayesian Classifier model for detection of email spam on the three datasets with 1000, 1500, and 2100 samples has been tested [19]. In Bayesian classifier based on probability is done classification. The percentage of accuracy of three datasets is equal to 93.98%, 94.85%, and 96.46% respectively.
Hybrid model of Particle Swarm Optimization-ANN (PSO-Optimization-ANN) in order to email spam detection has been proposed [21]. PSO for FS and from ANN Multilayer Perceptron (MLP) has been used for training and testing samples. In PSO-ANN model from with activation function of SIGMOID for hidden layer 80% of dates for training and 20% of them has been used. The number of hidden layer in the ANN is between 3 till 15 and repeat the PSO for FS is equal to 200. Evaluation on LINGSPAM dataset with 481 spam and 2171 non-spam and SPAMASSASISN with 6000 email has been done. Assessment on SPAMASSASINS and LING-SPAM has shown percentage of accuracy in PSO-ANN is 99.98% and 99.79% respectively. The comparison showed that the PSO-ANN compared to the SVM with Kernel Function, SVM with Radial Basis Function (RBF), and ANN-RBF has more accuracy.
GMDH of ANN model has been proposed to email spam detection. GMDH is one of the most important ANN which has high ability is modeling of complex data [22]. Not only does this model provide classic statistical modeling, it is a regular process to overcome statistical and ANN weaknesses. GMDH-based networks have emerged as a powerful supervised inductive learning approach in artificial intelligence. This type of ANN, contain a collection of neuron which is made by link different pairs via quadratic polynomial. Network with combination of several quadratic polynomials from all of neural for a collection from input with Lowest Output Error can be defined. GMDH model evaluation has been carried out on Spambase. Spambase dataset contain 58 features and 4601 sample. The samples in two classes’ non-spam and spam have been classified. The results with the selection of different features showed that percentage of accuracy in the model of GMDH is more than ANN MLP. The highest percentage of accuracy of the GMDH model is about 92.4% and in the ANN-MLP and NB are 91.7% and 75.4% respectively.
Decision Tree (DT), SVM and ANN and their combine on two datasets with 14 features have been tasted [23]. First dataset includes 504 emails (336 non-spams and 336 spams) and second date set contains 657 emails (387 non-spams and 270 spams). In the model of decision tree of the entropy, SVM of Kernel Function, and ANN of the average error is used. Results showed that the
percentage of accuracy in hybrid model is 91.07% and in DT, SVM, ANN are respectively 89.88%, 88.69%. 89.88% and on the second dataset percentage of accuracy in hybrid model is 91.78% and DT and SVM and ANN are respectively 90.87%, 90.87%, and 89.04%.
Quadratic-Neuron-Based Neural Tree (QUANT) model [24] is the combination of ANN and DT to email spam detection. The model has provided training and testing based on ANN and classification with C4.5. The C4.5 has been used for analyzing the main effective feature of email spam. In C4.5 each path from root toward a node represents a classification rule. Evaluation on two datasets of Spam-Assassin and Corpus 2006 has been done. The evaluation on the Spam-Assassin showed that the percentage of accuracy QUANT is equal 89.15 and NB, Sequential Minimal Optimization (SMO), and C4.5 is equal to 81.08, 88.62, and 73.08 were respectively. Also on Corpus 2006 percentage of accuracy QUANT is equal 90.87 and NB, SMO, and C4.5 is equal to 88.15, 89.79, and 88.15 were respectively.
III. PROPOSED MODEL
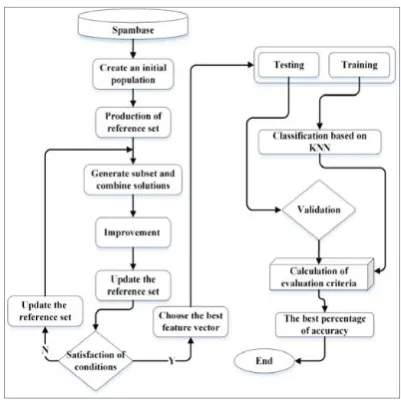
One of the options for email spam detection is using FS. The FS issue in the classification field consists of obtaining a subset of variables to perform the task without taking the remaining variables into account. This means that important features should be chosen and based on them the type of mail should be detected. In the proposed model for FS from SSA and for classifying the samples we using the KNN. The initial population based on Spambase features, including 4601 samples, is produced in the proposed model. Each record from the dataset is equal to a candidate in SSA. When the candidate is created for FS number of the candidate will be chosen and then from each candidate number of the feature accidentally will be chosen. Selected features are evaluated based on distance with other candidates' features [25]. The point is that using compare features a candidate to be selected that for the stage of classification its performance to be suitable in neighboring detection in order to increase the accuracy of the diagnosis.
performed to create a first population based on Spambase. Then a reference set of initial population in order to find the features will be selected. The reference set will be updated in several stages and optimal solutions are selected. Vectors that the distance between their features is less will be selected as an optimal vector.
Fig. 1. Flowchart of proposed model
Figure (2) shows the pseudo code of the proposed model, which combines SSA and KNN.
01: Procedure Proposed Model
02: Begin (Scatter Search)
03: Repeat
04: Create Population (Pop, Pop‐Size)
05: Repeat
06: Selection (Pop1,Size)
07: Selected‐Feature={}
08: Feature Selection
09: RS=Random Selection (count)
10: VC=Vector Comparison based on distance (count)
11: Evaluation (RS, VC)
12: Select best vector
13: Else Model Development
14: Improvement (Current‐Solution, Improved‐Solution)
15: Generate Reference‐set(Refset1, Refset2, Size_set1, Size_set2);
16: Repeat
17: Select Subset (Subset, subset‐size)
18: Combine (Subset, Cur sol)
19: improvement (Cur sol, improved ‐sol)
20: until (Stopping criterion1);
21: Update reference‐set(Refset1, Refset2, size_set1, size_set2);
22: Until (Stopping criterion2)
23: Until (Stopping criterion3)
24: End else
25: KNN Model:
26: For i= 1 to class_number
27: Train_data_class (i) =Partition (dataset, %)
28: For each Feature in each class
29: Calculate Euclidean distance
30: If Yes: select that feature
31: If No: go to KNN
32: Test_data_class (i) =Partition (dataset, %)
33: Evaluation test_data
34: End for i
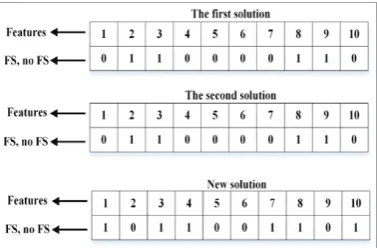
In the SSA with each repeat, candidates are improved and references set are updated. FS begins with the set of references and removes the worst feature iteratively while the solution improves. The goal of updating references set is creating optimal solutions and finds important features [26]. In this way, previous solutions are combined with new solutions and are created new solutions. Also, the size of the reference set is variable and for its updating, only the number of candidates can be updated. Combining references set solutions to enhance the solutions that have been obtained and updating references set with the solutions that are better than references set. In Figure (3) formation of candidate has been shown.
Fig. 3. Formation of candidate in SSA
In Figure (3) n and m are number of feature and number of sample respectively which amount of them equal to 57 and 4601. The vectors starts with an empty subset of features and iteratively adds the best feature as it improves the solution. In each stage from repeating improvement, it is possible number of candidate get less or more. In Figure (4), the creation of the new subset is shown.
Fig. 4. The creation of the new subset in SSA
The goal of combining solution is to create a better optimal solution. Amount of fitness of new solution with the previous solution is compared and if in increasing the accuracy of detection its performance be better as an improved solution will be added to the reference set.
3.1. K-Nearest Neighbors
The main criteria for the detection of similar samples in the KNN algorithm are the distance criterion. If a vector feature is defined
a1(x),a2(x),...,an(x) for detecting neighbors
form Euclidean distance according to Eq. (1) in order to get distance between two features of xi and xj is used.
n
r r i r j
j
i x a x a x
x d
1
2
)) ( ) ( ( ) ,
( (1)
The KNN is a method for classifying test samples based on k closest training examples in feature space [27, 28]. The test sample is assigned to the class mostly occurring amongst its KNN. Usually, the Euclidean distance is used to measure the closeness of the samples. Based on KNN at first training samples will be evaluated and a model in order to similar between samples is created. Samples are classified based on distance and similarity. In the first case, a sample should be selected to classify that the maximum number of instances existed in its neighborhood. As a result, after the distance of Euclidean is calculated between samples with the sorting of elements based on Euclidean distance among k neighbor are calculated, the label which possesses majority to be to the unknown sample will be given.
3.2. Criteria of Evaluation
100 FP TP
TP
Precision
(2)
100 FN TPTP
Recall
(3)
Recall) (Precision
Recall * Precision *
2 Measure F
(4)
100 FN) FP TN (TP
TN) (TP
Accuracy
(5)
Accuracy 1
Rate
Error (6)
True Positive (TP): numbers of samples that belong are positive class and classifier correctly assigns to positive class. False Positive (FP): numbers of samples that belong are not the positive class, but classifier incorrectly assigns to positive class. True Negative (TN): number of samples that a classifier correctly assigns to negative class. False Negative (FN): numbers of samples that belong are not the negative class, but classifier incorrectly assigns to negative class.
IV. EVALUATION AND RESULTS
In this section, evaluation of the proposed model has been done. Evaluation is done in programming VC# 2017 on the Spambase dataset [29] with 57 features and 4601 samples. VC# is based on a set of the classes’ library which contains a huge collection of components which have been made already. These components help to build programs as quickly as possible. VC# is a very powerful program and it can be used for programming with more management capabilities and easy to understand. At initial evaluation value of the parameter of k, the number of iteration and initial population are equal to 3, 100, and 100 respectively.
4.1. Results without Feature Selection
In Table (1) results of the proposed model without FS and based on k has been shown. Table (1) shows that percentage of accuracy for k=3 compared to other values of k are more. And also computational time by increasing the number of k is increased. Because searching for finding the entire similar neighbor needs to more time. Results of the Table (1) showed that percentage of accuracy with k=3 is equal to 71.94% and with with=7 is equal to 68.52%.
TABLE 1
RESULTS OF THE PROPOSED MODEL WITHOUT FS AND BASED ON NUMBER OF K
Proposed Model Criteria
K=7 K=6 K=5 K=4 K=3
67.42 68.23 69.58 69.15 70.25 Precision
68.49 69.78 70.33 70.64 72.13 Recall
67.95 68.99 69.95 69.88 71.17 F‐Measure
68.52 68.42 69.11 70.13 71.94 Accuracy
31.48 31.58 30.89 29.87 28.06 Error Rate
1.35 1.09 1.15 1.11 1.08 Time (Sec)
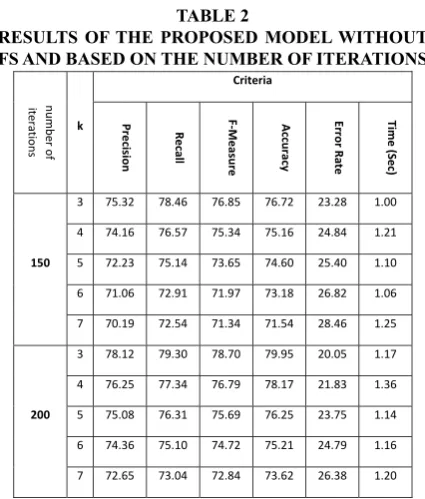
TABLE 2
RESULTS OF THE PROPOSED MODEL WITHOUT FS AND BASED ON THE NUMBER OF ITERATIONS
Criteria
k
number of
iter
ations Erro Time (Sec)
r Rate Accu racy F‐Mea sure Recall Precision 1.00 23.28 76.72 76.85 78.46 75.32 3 150 1.21 24.84 75.16 75.34 76.57 74.16 4 1.10 25.40 74.60 73.65 75.14 72.23 5 1.06 26.82 73.18 71.97 72.91 71.06 6 1.25 28.46 71.54 71.34 72.54 70.19 7 1.17 20.05 79.95 78.70 79.30 78.12 3 200 1.36 21.83 78.17 76.79 77.34 76.25 4 1.14 23.75 76.25 75.69 76.31 75.08 5 1.16 24.79 75.21 74.72 75.10 74.36 6 1.20 26.38 73.62 72.84 73.04 72.65 7
In Figure (5), the proposed model result without FS and based on number of iterations has shown. Results of the Figure (5) indicate that the percentage of accuracy the proposed model without FS and with 200 times is more than 150 times.
Fig. 5. Comparison of the results of the proposed model
without FS and based on the number of iterations
In the Table (3) results of the proposed model without FS based on the number of k and number of the reference set with 100 iterations is shown. Number of reference set considered less than 20. Table (3) showed that with increasing value of reference set the percentage of the accuracy increase. The reference set will be caused that
search space to be broad and solutions of optimizing were found. Optimal solution means finding the best distance between features.
TABLE 3
RESULTS OF THE PROPOSED MODEL WITHOUT FS BASED ON THE NUMBER OF K AND
REFERENCE SET Criteria k ref er ence set Time (Sec) Erro r Rate Accu racy F‐Mea sure Recall Precision 0.9821 19.83 80.17 81.42 82.51 80.36 3 8 1.02 20.98 79.02 80.41 80.66 80.17 4 1.05 21.82 78.18 79.54 79.76 79.33 5 1.08 23.74 76.26 78.67 79.07 78.29 6 1.17 24.51 75.49 78.09 78.38 77.81 7 1.01 14.18 85.82 85.39 86.72 84.11 3 12 1.07 15.85 84.15 84.41 85.31 83.53 4 1.12 16.35 83.65 83.81 84.19 83.44 5 1.21 17.86 82.14 82.82 83.46 82.19 6 1.26 20.94 79.06 79.74 80.15 79.35 7 1.04 14.51 85.49 87.01 87.95 86.09 3 16 1.06 15.79 84.21 85.88 86.24 85.54 4 1.11 16.39 83.61 84.01 84.79 83.26 5 1.16 17.08 82.92 82.66 83.20 82.13 6 1.27 18.89 81.11 81.62 82.64 80.64 7
TABLE 4
RESULTS OF THE PROPOSED MODEL WITHOUT FS BASED ON THE K AND NUMBER OF INITIAL
SOLUTION Criteria k Nu mb er of Solutions Time (Sec) Erro r Rate Accu racy F‐Mea sure Recall Precision 0.9856 20.49 79.51 79.59 80.17 79.03 3 40 1.04 22.75 77.25 78.67 79.30 78.05 4 1.07 23.19 76.81 77.37 78.29 76.48 5 1.13 24.72 75.28 75.61 76.07 75.16 6 1.20 25.95 74.05 74.91 75.19 74.64 7 1.07 19.75 80.21 80.78 81.23 80.35 3 50 1.12 20.68 79.32 81.03 81.46 80.61 4 1.15 22.71 77.29 79.72 80.22 79.24 5 1.10 22.95 77.05 78.40 79.09 77.73 6 1.21 23.82 76.18 76.56 77.05 76.08 7 0.9830 16.93 83.07 83.45 83.66 83.25 3 80 1.00 17.36 82.64 82.53 82.94 82.14 4 1.18 19.88 80.12 80.78 81.26 80.31 5 1.25 20.92 79.08 80.25 80.95 79.58 6 1.28 23.89 76.11 78.84 79.68 78.03 7
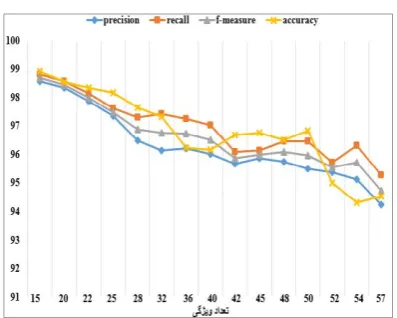
4.2. Results of the proposed model with FS In Table (5) results of evaluation of the proposed model based on FS and with 500 iterations has been shown. Table (5) showed that FS to be so effective in increasing rate of accuracy. If number of FS to be less, percentage of accuracy of proposed model increases. Because of reducing features, find similar features in less time and the percentage of accuracy is higher. If the number of feature were equal to 15 and the percentage of accuracy of is equal to 98.92% and if the number of feature were equal to 57 features, percentage of accuracy is equal to 94.54%. Also if the number of feature were equal to 15 and precision is equal to 98.56% and if the number of the feature were equal to 57 features and the precision is equal to 94.23%. The results of Table (5) showed that if the number of features increases, the computational time also increases.
TABLE 5
EVALUATION OF PROPOSED MODEL BASED ON FS AND 500 TIME REPEAT
Criteria
FS Erro Time (Sec)
r Rate Accu racy F‐Mea sure Recall Precision 0.4568 1.08 98.92 98.67 98.80 98.56 15 0.4621 1.47 98.53 98.44 98.56 98.33 20 0.5124 1.66 98.34 97.99 98.14 97.86 22 0.5638 1.84 98.16 97.47 97.61 97.34 25 0.5984 2.36 97.64 96.88 97.30 96.48 28 0.5992 2.67 97.33 96.77 97.42 96.13 32 0.7215 3.75 96.25 96.73 97.26 96.21 36 0.7508 3.83 96.17 96.52 97.02 96.03 40 0.8236 3.32 96.68 95.87 96.08 95.68 42 0.8751 3.25 96.75 96.00 96.15 95.86 45 0.9062 3.49 96.51 96.09 96.45 95.74 48 0.9079 3.18 96.82 95.98 96.46 95.51 50 1.02 4.99 95.01 95.54 95.72 95.38 52 1.05 5.68 94.32 95.72 96.31 95.14 54 1.13 5.46 94.54 94.74 95.27 94.23 57
Fig. 6. Comparison chart of the proposed model based
on FS and 500 iterations
4.3. Comparison and Evaluation
In this section, comparisons of proposed model with NSA and PSO-NSA have been shown. Table (6), showed that percentage of accuracy of the proposed model is more than NSA and PSO-NSA and its value is equal to 94.54%.
TABLE 6
COMPARISON OF PROPOSED MODEL WITH NSA AND PSO-NSA
Models
Criteria Proposed
Model PSO-NSA [20] NSA [20] 95.27 65.99 22.24 Recall 90.27 93.42 99.16 FP TN TN SP
94.23 86.71 94.53 Precision 82.13 80.87 66.24 TN FNTN NPV
94.74 74.95 36.01 F-Measure 94.54 82.62 68.86 Accuracy 68.15 63.37 36.06 ) )( )( )(
(TP FN(TP)(FP) (TN)(FP)TN FN FN FP TN TP
CC
Specificity (SP), Negative Prediction Value (NPV), Correlation Coefficient (CC)
In Table (7) comparison of the proposed model with RBF ANN-PSO based on training and testing has been shown. And value of training and testing are equal to 70% and 30% respectively. Results of comparisons showed that the proposed model has percentage of accuracy of more compare to RBF ANN-PSO.
TABLE 7
COMPARISON OF THE PROPOSED MODEL WITH RBF ANN-PSO BASED ON TRAINING AND TESTING
Decrease and increase the accuracy Accuracy Neuron Models Te sting Training Te sting Training -1.04 -1.01 88.05 89.05 10 RBF ANN-PSO [30] -1.01 -1.02 90.01 91.00 20 -1.01 -1.01 90.09 91.08 30 -1.01 -1.02 91.04 92.05 40 -1.02 -1.00 90.06 93.01 50 1.04 1.01 92.06 90.15 Run: First Proposed Model 1.01 1.02 91.05 93.48 Run: second 1.01 1.01 91.53 92.64 Run: third 1.01 1.02 92.54 94.02 Run: fourth 1.02 1.00 92.11 93.65 Run: fifth
Table (8) comparison of the proposed model with the data mining model is shown. In comparison with data mining, the proposed model is more accurate. The number of TP samples in the proposed model is equal to 2686 samples. According to the results of the Table (8) Logic Boost (LB), ANN-MLP, J48, and Bagging algorithm has more percentage of accuracy compared to other models. More detection of machine learning models is over 90%, but the percentage accuracy of the proposed model is higher than them. The maximum percentage of accuracy among machine learning models belong to Random Forest (RF) that its accuracy is equal to 93.89%. But the percentage of accuracy of the proposed model compared to it is equal to 94.54%.
TABLE 8
COMPARISON OF PROPOSED MODEL WITH DATA MINING MODELS FN TN FP TP The percentage of samples of correctly classified Models 335 1478 192 2596 88.54 Naïve Bayes [31]
334 1479 192 2596 88.56 Bayes Net [31]
190 1623 134 2654 92.95 Logic Boost (LB)
[31] 151 1662 158 2630 93.28 MLP ANN [30]
176 1637 133 2655 93.28 Stochastic Gradient Descent [31] 183 1630 129 2659 93.21 sequential minimal optimization [31] 173 1640 123 2665 93.56 KSTAR [31] 259 1554 122 2666 91.71 Decision Tree [31]
182 1631 170 2618 92.34 J48 [31] 166 1647 115 2673 93.89 Random Forest [31]
187 1626 202 2586 91.54 Random Tree [31]
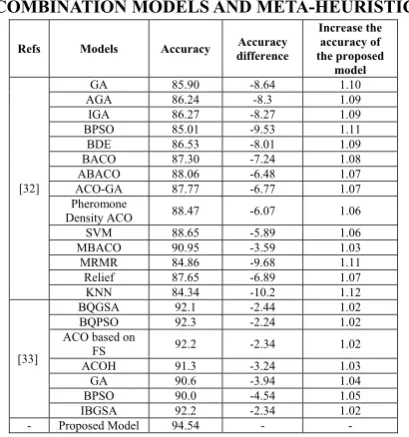
In Table (9) comparison of the proposed model with combination models and meta-heuristic is shown. The accuracy of most of the meta-heuristic models is more than 80% which have a high difference in accuracy compared to the proposed model. Percentage of the accuracy of Binary Ant Colony Optimization (BACO) algorithm is equal to 90.95% which against the percentage of accuracy of the proposed model is 94.54%.
Table (9) comparison of the proposed model with combination models is shown. Percentage of accuracy most of the combination models are up to 90% and against the percentage of accuracy of the proposed mode is equal to 94.54% and even more. In the Table (9) you observing that Quantum Binary Gravitational Search Algorithm (QBGSA), Binary Quantum Particle Swarm Optimization (BQPSO) algorithm and Ant Colony Optimization (ACO) algorithm based on FS have more accuracy. In models of Table (9) from all of the features in order to classification is used.
TABLE 9
COMPARISON OF PROPOSED MODEL WITH COMBINATION MODELS AND META-HEURISTIC
Increase the accuracy of the proposed model Accuracy difference Accuracy Models Refs 1.10 -8.64 85.90 GA [32] 1.09 -8.3 86.24 AGA 1.09 -8.27 86.27 IGA 1.11 -9.53 85.01 BPSO 1.09 -8.01 86.53 BDE 1.08 -7.24 87.30 BACO 1.07 -6.48 88.06 ABACO 1.07 -6.77 87.77 ACO-GA 1.06 -6.07 88.47 Pheromone Density ACO 1.06 -5.89 88.65 SVM 1.03 -3.59 90.95 MBACO 1.11 -9.68 84.86 MRMR 1.07 -6.89 87.65 Relief 1.12 -10.2 84.34 KNN 1.02 -2.44 92.1 BQGSA [33] 1.02 -2.24 92.3 BQPSO 1.02 -2.34 92.2 ACO based on
FS 1.03 -3.24 91.3 ACOH 1.04 -3.94 90.6 GA 1.05 -4.54 90.0 BPSO 1.02 -2.34 92.2 IBGSA - - 94.54 Proposed Model -
In Table (10) Comparison of the proposed model with other models based on the percentage of usage from samples of Spambase dataset is shown. Comparisons show that the proposed model has more percentage of accuracy compared
to other models. Among other models, the most percentage of accuracy belongs to Stochastic Gradient Boosting Decision Trees and RF. Also, the least percentage of accuracy belongs to Deep Learning (DL) algorithm. Percentage of accuracy proposed model with 20% samples is equal to 95.79%.
TABLE 10
COMPARISON OF PROPOSED MODEL WITH OTHER MODELS BASED ON PERCENTAGE OF
USAGE OF SPAMBASE
Models Spambase-5 Spambase-10 Spambase-15 Spambase-20 SPAMBASE Stochastic Gradient Boosting Decision Trees [34] 91.96 91.09 89.35 90.87
RF [34] 91.30 90.44 90.00 90.22
Extreme Learning Machine (ELM) [34] 70.87 73.04 67.61 64.78
SVM [34] 91.52 90.44 86.30 87.39
C4.5 [34] 86.09 86.09 81.96 84.13
KNN [34] 69.91 70.44 65.00 62.39
Linear Regression [34] 74.78 68.70 66.09 65.87
ADABOOST [34] 88.48 87.83 85.22 86.09
Naïve Bayes [34] 64.13 60.00 61.09 60.22
Deep Learning (DL) [34] 60.87 61.30 39.13 39.13
Proposed Model 97.45 96.063 95.75 95.79
In Table (11) comparison of the proposed model with KNN, SVM and Linear Discriminant Analysis (LDA) have been shown. Comparisons show that the proposed model compared to the KNN, SVM and LDA models have more accuracy. Also, SVM compared with KNN, and LDA has more accuracy. More percentage of accuracy in the proposed mode is equal to 98.61%.
TABLE 11
COMPARISON OF PROPOSED MODEL WITH KNN, SVM, AND LDA
Accuracy FS
Models Run=1 Run=2 Run=3 Run=4
V. CONCLUSION AND FUTURE WORKS
REFERENCES
1. Salihovic I., Serdarevic H., and Kevric J., 2018. The Role of Feature Selection in Machine Learning for Detection of Spam and Phishing Attacks. in International Symposium on Innovative and Interdisciplinary Applications of Advanced Technologies. pp. 476-483.
2. Pandey A.C., Rajpoot D.S., 2019. Spam review detection using spiral cuckoo search clustering method. Evolutionary Intelligence. Vol. 12, Issue 2, pp. 147-164.
3. Diale M., Celik T., and Van Der Walt C., 2019. Unsupervised feature learning for spam email filtering. Computers & Electrical Engineering. vol. 74, pp. 89-104.
4. Cabrera-Leon Y., Baez P.G., and Suarez-Araujo C.P., 2019. E-mail spam filter based on unsupervised neural architectures and thematic categories: design and analysis. in Computational Intelligence, ed: Springer. pp. 239-262.
5. M. Habib, H. Faris, M.A. Hassonah, J. Alqatawna, A.F. Sheta, A.M. Al-Zoubi, Automatic Email Spam Detection using Genetic Programming with SMOTE, 2018 Fifth HCT Information Technology Trends (ITT), IEEE, pp. 185190, 2018.
6. B. Martin, 1999. Instance-based learning: nearest neighbour with generalisation.
7. Hasanluo M. and Soleimanian Gharehchopogh F., 2016. Software cost estimation by a new hybrid model of particle swarm optimization and k-nearest neighbor algorithms. Journal of Electrical and Computer Engineering Innovations, vol. 4, pp. 49-55.
8. Scheuerer S. and Wendolsky R., 2006. A scatter search heuristic for the capacitated clustering problem, European Journal of Operational Research. vol. 169, pp. 533-547.
9. Maleki I., Gharehchopogh F.S., Ayat Z., and Ebrahimi L., 2014. A Novel Hybrid Model of Scatter Search and Genetic Algorithms for Software Cost Estimation. Magnt Research Report. 2, pp. 359-371.
10. Chaves A.A. and Lorena L.A.N., 2010. Clustering search algorithm for the capacitated centered clustering problem. Computers & Operations Research, vol. 37, pp. 552-558, 2010.
11. Chikh R. and Chikhi S., 2019. Clustered negative selection algorithm and fruit fly optimization for email spam detection. Journal of Ambient Intelligence and Humanized Computing, vol. 10, pp. 143-152.
12. Shuaib M., Abdulhamid S.M., Adebayo O.S., Osho O., Idris I., Alhassan J.K., Rana N., 2019. Whale optimization algorithm-based email spam feature selection method using rotation forest algorithm for classification. SN Applied Sciences, pp. 1:390.
13. Faris H., Ala’M A.-Z., Heidari A.A., Aljarah I., Mafarja M., Hassonah M.A., 2019. An intelligent system for spam detection and identification of the most relevant features based on evolutionary random weight networks, Information Fusion, 48, pp. 67-83.
14. Singh M., 2019. Classification of Spam Email Using Intelligent Water Drops Algorithm with Naïve
Bayes Classifier. in Progress in Advanced Computing and Intelligent Engineering, ed: Springer, pp. 133-138.
15. Roy S.S., Sinha A., Roy R., Barna C., Samui P., 2018. Spam Email Detection Using Deep Support Vector Machine, Support Vector Machine and Artificial Neural Network, International Workshop Soft Computing Applications SOFA 2016: Soft Computing Applications. pp. 162-174.
16. Agarwal K., Kumar T., 2018. Email Spam Detection Using Integrated Approach of Naïve Bayes and Particle Swarm Optimization, Second International Conference on Intelligent Computing and Control Systems (ICICCS). pp. 685-690.
17. Wijaya A. and Bisri A., 2016. Hybrid decision tree and logistic regression classifier for email spam detection, in 2016 8th International Conference on Information Technology and Electrical Engineering (ICITEE), pp. 1-4.
18. Abdolahnezhad M.R., Banirostam T., 2016. Improved negative selection algorithm for email spam detection application. International Journal of Advanced Research in Electronics and Communication Engineering (IJARECE), 5(4):956-960
19. Rathod S.B. and Pattewar T.M., 2015. Content based spam detection in email using Bayesian classifier, in 2015 International Conference on Communications and Signal Processing (ICCSP), pp. 1257-1261.
20. Idris I., Selamat A., Nguyen N.T., Omatu S., Krejcar O., Kuca K., 2015. A combined negative selection algorithm– particle swarm optimization for an email spam detection system. Engineering Applications of Artificial Intelligence, 39, pp. 33-44.
21. Behjat A.R., Mustapha A., Nezamabadi-pour H., Sulaiman M.N., and Mustapha N., 2013. A PSO-Based Feature Subset Selection for Application of Spam/Non-spam Detection. in Soft Computing Applications and Intelligent Systems, ed: Springer, pp. 183-193.
22. El-Alfy E.-S.M. and Abdel-Aal R.E., 2011. Using GMDH-based networks for improved spam detection and email feature analysis. Applied Soft Computing, vol. 11, pp. 477-488.
23. Ying K.-C., Lin S.-W., Lee Z.-J., and Lin Y.-T., 2010. An ensemble approach applied to classify spam e-mails. Expert Systems with Applications, vol. 37, pp. 2197-2201.
24. Su M.-C., Lo H.-H., and Hsu F.-H., 2010. A neural tree and its application to spam e-mail detection. Expert Systems with Applications, vol. 37, pp. 7976-7985.
25. Khalandi S. and Soleimanian Gharehchopogh F., 2018. A New Approach for Text Documents Classification with Invasive Weed Optimization and Naive Bayes Classifier. Journal of Advances in Computer Engineering and Technology, vol. 4, pp. 31-40.
26. Majidpour H. and Soleimanian Gharehchopogh F., 2018. An Improved Flower Pollination Algorithm with AdaBoost Algorithm for Feature Selection in Text Documents Classification. Journal of Advances in Computer Research, vol. 9, pp. 29-40.
F., 2018. An improved k-nearest neighbor with crow search algorithm for feature selection in text documents classification. Journal of Advances in Computer Research, vol. 9, pp. 37-48.
28. Miandoab E. E. and Gharehchopogh F.S., 2016. A novel hybrid algorithm for software cost estimation based on cuckoo optimization and k-nearest neighbors algorithms. Engineering, Technology & Applied Science Research, vol. 6, pp. 1018-1022.
29. Hopkins M., Reeber E., Forman G., and Suermondt J., 1999. "Spambase," UML Repository, ed.
30. Awad M., and Foqaha M., 2016. Email Spam Classification Using Hybrid Approach of RBF Neural Network and Particle Swarm Optimization. International Journal of Network Security & Its Applications, vol. 8, no. 4, pp. 17-28.
31. Sharma S. and Arora A., 2013. Adaptive approach for spam detection," International Journal of Computer Science Issues (IJCSI), vol. 10, p. 23.
32. Wan Y., Wang M., Z. Ye, and Lai X., 2016. A feature selection method based on modified binary coded ant colony optimization algorithm, Applied Soft Computing, vol. 49, pp. 248-258.
33. Barani F., Mirhosseini M., and Nezamabadi-Pour H., 2017. Application of binary quantum-inspired gravitational search algorithm in feature subset selection, Applied Intelligence, vol. 47, pp. 304-318.
34. Zhang C., C. Liu, Zhang X., and Almpanidis G., 2017. An up-to-date comparison of state-of-the-art classification algorithms. Expert Systems with Applications. vol. 82, pp. 128-150.