Volume 2, Issue 4, 2015
20 Available online at www.ijiere.com
International Journal of Innovative and Emerging
Research in Engineering
e-ISSN: 2394 – 3343 p-ISSN: 2394 - 5494
Effect of Rate of Loading on Compressive
Strength of Concrete
Saurah Mali, Tushar Pachpande and Ashwini Jogi
Kothrud, Pune, India
ABSTRACT:
To accurately predict the behavior of a reinforced concrete structure subjected to dynamic loads, effect of change in rate of loading should be accurately determined. It’s found that load rate as per IS specifications is time consuming and tedious and hence generally avoided. Hence, concrete of grade varying from M20 to M40 using loading rates 40 to 1540 kg/cm2/min were tested for above purpose. The ratio of strength to rate of loading was calculated which revealed logarithmic relationships. Suitable correction factor was proposed for determining the true strength of concrete cubes from obtained strength at higher rate of loading.
Keywords: Concrete, Rate of loading, Correction Factor, Cube Test, Strength
I. INTRODUCTION
Compressive strength of concrete is determined by testing concrete cubes of size 150mm x 150 mm x 150 mm. CTM, either electronic or manually operated are used for this purpose. The strength of concrete is tested on site using manually operated CTM. The rate of loading in such cases cannot be accurately determined and it violets the code specifications. The rate of loading applied by manually operated CTM is generally 8 to 10 times greater than the code specifications. It has been observed that strength increase as rate of loading increases. This is not the true strength and hence we get inaccurate results. False strength of concrete proves fatal as it may fail due to various factors in the long terms. Therefore, to ensure the functional performance and safety of structure it is necessary to determine the true strength of concrete.
In this project the effect of high rate of loading on compressive strength of concrete has been studied. As it has been observed that strength increases at higher rate of loading, it gives false strength which may prove hazardous. To avoid this, a suitable correction factor has been formulated which will enable us to obtain the true strength of concrete.
II. LITERATUREREVIEW
1. Compressive behaviour of concrete at high strain rates by P. H. Bishoff and S. H. Perry (materials and structures/ materiaux et constructions, 1991, 24, 425-450)
In the year 1991, Bishoff & Perry [1]conducted experimental technics commonly used for high strain- rates
testing of concrete in compression with methods used for recordings and testing stress and strain. The data recorded by them show and indicate the various types of loading rate that will be applied on concrete under various conditions. They also pointed out the vast range of straiun rate applied on concrete (10-8 under creep to
103 under blast effect). Hence studies are carried out to determine the strength of concrete under higher loading
rate.
2. Review of effect of loading rate on concrete in compression by H. C. Fu, M. A. Erki, M. Seckin. (J. Struct. Eng., 1991, 117(12), 3645-3659)
In the year 1991 H. C. Fu, M. A. Erki, M. Seckin [3]studied the response of reinforced concrete material and
elements to different strain rate. They concluded that increasing rate of loading will result in increase in strength and stiffness of concrete, yield strength of still increases and thus the improved axial and flexural capacity of RC elements may lead to undesirable effects on dynamic response on RC sections.
3. Rate effects and load relaxation in static fracture of concrete by Zdenek P. Bazant and Ravindra Gettu, Page 456-457 & 467
In 1992, Zdenek P. Bazant and Ravindra Gettu [6] published a paper regarding the rate effects and load
Volume 2, Issue 4, 2015
21 4. Fracture of rock: Effect of loading rate by Ravindra Gettu, Zdenek P. Bazant & Shang-Ping Bai
In 1993, Ravindra Gettu, Zdenek P. Bazant & Shang-Ping Bai [7]published a paper on effect of loading rate
on rock. They proposed that the fracture in all material is rate-sensitive. The paper concluded that the strength of rock increases with an increase in the loading rate. In case of concrete, they concluded that for higher time to peak load, the brittleness of failure increases.
5. Experimental Investigations of loading rate effects in reinforced concrete columns by W. Ghannoum, V. Saouma, G. Houssmann, K. Polkingorane, M. Eck & D. H. Kang (J. Struct . Engg., 2012.138: 1032-1041)
In the year 2012, W. Ghannoum, V. Saouma, G. Houssmann, K. Polkingorane, M. Eck & D. H. Kang [8]
studied loading rate effect on RC columns. They studied the behaviour of RC under effect of seismic loading. The single concrete column prototype was chosen to investigate effects of varying loading rates on behaviour of the specimen. The dynamic loading effects on column behaviour were observed in all tests.
They concluded that at the observed increase in strength at higher loading rate, the increase in strength is significant. And by ignoring such an increase, the codes are currently erring on the conservative side in strain assessment for short duration seismic loading.
6. Strain rate induced strength enhancement in concrete: much ado about nothing? by Leonard Schwer, 7th europian
LS-DYNA conference M-I-03, 2009
In 2009, Leonard Schwer [4]of Windsor, California, USA conducted unconfined compression test simulations
on concrete cylinder models. The strain-rate loading was increased from 10/sec to 100/sec and graph of axial load v/s time is plotted. The graph indicates behaviour of specimens under different loading rates, each of the clearly indicates that the axial load increased with increment inn loading rate.
7. Effect of loading rate on the fracture behaviour of high-strength concrete by G. Ruiza, X. X. Zhangb, R. C. Yu, E. Poveda, R. Porras and J. del Viso, Applied Mechanics and materials Vols. 24-25, 2010, p. 179-185
In 2010, G. Ruiza, X. X. Zhangb, R. C. Yu, E. Poveda, R. Porras and J. del Viso [2]studied the fractured
behaviour of high strength concrete by subjecting it to increased strain rate based on experimental data prepared by them, a graph of load-displacement curve was plotted. It was clearly indicated by the graph that the peak load increases with increasing load rates and the displacement remains almost constant.
8. Strain rate effect on performance of reinforced concrete member by Otani, Shunsuke, Takashi, Kaneko and Hitoshi Shiohara, Proceeding of FIB Symposium on concrete structures++++++ in seismic regions. May 2003.5, p. 367-371
In 2003, Otani, Shunsuke, Takashi, Kaneko and Hitoshi Shiohara [5]conducted experiments on four pairs of
RC beams to study its behaviour under various static and dynamic loading conditions. Loading gauge and strain gauge actuators were used for testing the specimens. From the experimental data, it was concluded that at the strain rate expected during earthquake, the flexural resistance of beams can increase from 7% up to 20%.
III.METHODOLOGY
The project has been divided into following three stages in order to obtain the required objective: 1. Market Survey & Literature Review
2. Experimental Work 3. Analysis of data obtained
1. MARKET SURVEY:
Through market survey, it’s been observed that many institutes and land laboratories do not follow the prescribed rate of loading and thus do not comply with I.S. Codes. There is no availability of pace rate adjuster. Also manually operated CTM was majorly found on construction sites. As the time required to test the concrete cubes at 140 kg/cm2/min is high, it is not followed on site. As concrete grades ranging from M20 to M40 are usually
used, they were selected for the project.
It is also observed that the time taken to test a cube is 20 seconds to 1 min which generates the rate of loading as 900 kg/cm2/min to 1400 kg/cm2/min.
2. EXPERIMENTAL WORK:
The experimental work consisted of the following stages: i. Casting of concrete cubes
ii. Testing of concrete cubes iii. Analysis of data
iv. Formulation of correction factor v. Application of correction factor
3. Analysis of data obtained:
Volume 2, Issue 4, 2015
22
IV.CORRECTIONFACTOR
Definition: A factor used to reduce the amount of deviation in a measurement to obtain the accurate value is called ‘correction factor’ [9]
Necessity: To correct the strength obtained at higher rate of loading, the correction factor shall be such that it will reduce the obtained strength at rate of loading greater than 140 kg/cm2/min and increase it at loading rate less than 140 kg/cm2/min.
hence, the correction factor will be a divisor term and hence it will vary between 0 and 1.6 as the strength increases by a maximum of 50-60% of the true strength.
As the equation obtained for curves of various grades are different, the correction factor shall not remain the same for each grade. Correction factor from each equation shall be computed separately for each grade from the equations or directly from the graph of correction factor.
V. RESULTS
1. COMPUTATION OF CORRECTION FACTOR
a. Following table shows the correction factors computed for M20 grade of concrete. These corrections factors were calculated by taking the strength obtained at 140 kg/cm2/min as datum.
Table 1: Correction Factors for grade M20
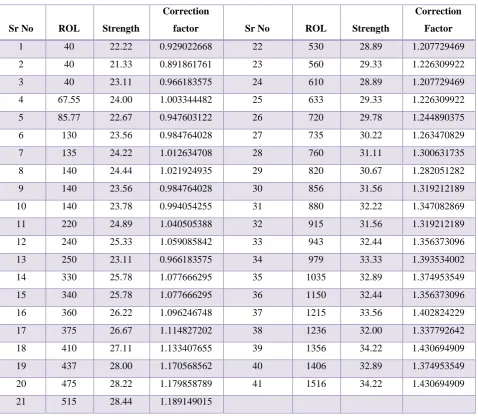
Following figure shows graph of rate of loading vs correction factor for M20 grade of concrete. The graph was plotted with respect to the data obtained from above table. The abscissa in the graph represents the rate of loading whereas the ordinate represent the correction factor. The graph gives an equation of curve (y = -6E-11x3-7E-08x2+0.0006x+0.9141).
This equation gives the correction factor for particular rate of loading.
Sr No ROL Strength
Correction
factor Sr No ROL Strength
Correction
Factor
1 40 22.22 0.929022668 22 530 28.89 1.207729469
2 40 21.33 0.891861761 23 560 29.33 1.226309922
3 40 23.11 0.966183575 24 610 28.89 1.207729469
4 67.55 24.00 1.003344482 25 633 29.33 1.226309922
5 85.77 22.67 0.947603122 26 720 29.78 1.244890375
6 130 23.56 0.984764028 27 735 30.22 1.263470829
7 135 24.22 1.012634708 28 760 31.11 1.300631735
8 140 24.44 1.021924935 29 820 30.67 1.282051282
9 140 23.56 0.984764028 30 856 31.56 1.319212189
10 140 23.78 0.994054255 31 880 32.22 1.347082869
11 220 24.89 1.040505388 32 915 31.56 1.319212189
12 240 25.33 1.059085842 33 943 32.44 1.356373096
13 250 23.11 0.966183575 34 979 33.33 1.393534002
14 330 25.78 1.077666295 35 1035 32.89 1.374953549
15 340 25.78 1.077666295 36 1150 32.44 1.356373096
16 360 26.22 1.096246748 37 1215 33.56 1.402824229
17 375 26.67 1.114827202 38 1236 32.00 1.337792642
18 410 27.11 1.133407655 39 1356 34.22 1.430694909
19 437 28.00 1.170568562 40 1406 32.89 1.374953549
20 475 28.22 1.179858789 41 1516 34.22 1.430694909
Volume 2, Issue 4, 2015
23
Graph 1: Rate of loading vs Correction factor of grade M20
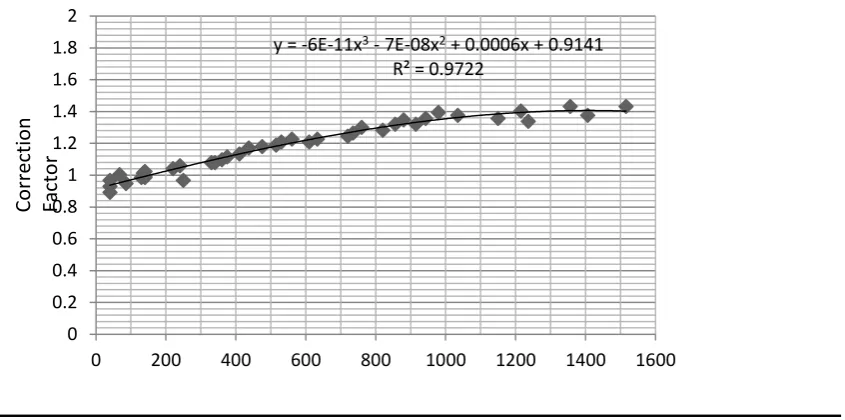
b. Following table shows the correction factors computed for M25 grade of concrete. These corrections factors were calculated by taking the strength obtained at 140 kg/cm2/min as datum.
Table 2: Correction factors for grade M25
Sr No ROL Strength
Correction
Factor Sr No ROL Strength
Correction
Factor
1 40 20.44 0.793170353 23 676 32.44 1.258828095
2 40 22.22 0.862242918 24 719 30.67 1.190143578
3 40 24.88 0.965463718 25 745 30.22 1.172681412
4 122.21 27.11 1.051998448 26 745 32 1.241753977
5 130 28 1.08653473 27 786 32.88 1.275902212
6 140 22.66 0.879317035 28 823 32.88 1.275902212
7 140 26.66 1.034536282 29 855 33.77 1.310438494
8 140 28 1.08653473 30 889 31.55 1.224291812
9 170 26.67 1.034924331 31 906 34.22 1.32790066
10 180 27.55 1.069072565 32 906 34.66 1.344974777
11 186 28 1.08653473 33 1024 33.77 1.310438494
12 231 28 1.08653473 34 1065 32.88 1.275902212
13 240 28.88 1.120682965 35 1069 32.88 1.275902212
14 266.6 26.22 1.017462165 36 1110 34.22 1.32790066
15 310 29.77 1.155219247 37 1122 33.77 1.310438494
16 323 29.33 1.13814513 38 1162 36 1.396973225
17 377 29.77 1.155219247 39 1219 35.11 1.362436942
18 444 31.11 1.207217695 40 1238 34.22 1.32790066
19 447 30.22 1.172681412 41 1310 38.22 1.483119907
20 533 28.44 1.103608847 42 1335 37.33 1.448583624
21 560 31.55 1.224291812 43 1463 38.67 1.500582072
22 576 31.55 1.224291812
y = -6E-11x3- 7E-08x2+ 0.0006x + 0.9141
R² = 0.9722
0 0.2 0.4 0.6 0.8 1 1.2 1.4 1.6 1.8 2
0 200 400 600 800 1000 1200 1400 1600
Correctio
n
Fa
cto
Volume 2, Issue 4, 2015
24 Following figure shows graph of rate of loading vs correction factor for M25 grade of concrete. The graph was plotted with respect to the data obtained from above table. The abscissa in the graph represents the rate of loading whereas the ordinate represent the correction factor. The graph gives an equation of curve (y = 6E-10x3-1E-06x2+0.0012x+0.869).
This equation gives the correction factor for particular rate of loading.
Graph 2: Rate of loading vs Correction factors of grade M25
2. PRACTICAL IMPLIMENTATION & VERIFICATION:
Correction factors computed are verified for their effective outputs. For this purpose, three cubes of M40 grade were casted. Each of these cube was tested at different rate of loading. Details given below:
Table 3: Casting Specifications for verification of correction factor
Cubes Specimen Tested After
(Days)
Rate of loading used (kg/cm2/min)
Strength (MPa)
Cube A 28 140 40.44
Cube B 28 633 45.33
Cube C 28 1024 48.44
Implementation of Correction factor:
In order to determine the true strength of concrete cube, the obtained strength shall be divided by suitable correction factor. By knowing the time required in testing, the rate of loading applied during testing can be calculated as shown below:
Rate of loading = Strength obtained in kN x 1000 9.81 x 225 x time in minutes
The equation of graph corresponding to its grade is given in the results. Substituting the value of ‘x’ that is rate of loading, the corresponding value of ‘y’ that is correction factor can be obtained. On dividing the obtained strength by the correction factor, the corrected strength of the specimen shall be obtained.
y = 6E-10x3- 1E-06x2+ 0.0012x + 0.8697
R² = 0.894
0 0.2 0.4 0.6 0.8 1 1.2 1.4 1.6 1.8 2
0 200 400 600 800 1000 1200 1400 1600
Co
rrectio
n
Facto
Volume 2, Issue 4, 2015
25
Table 4: Implementation of Correction Factor
Cube Specimen
Rate of loading used for testing (kg/cm2/min)
Equation for correction factor
Correction factor Corrected Strength
(MPa)
Cube A 140
Y = 2E – 10x3 – 6E
– 07x2 + 0.0006x +
0.891
1 40.44
Cube B 633 1.1299 40.440
Cube C 1024 1.1978 40.442
Thus, application of correction factor gives us precise results.
VI.CONCLUSIONS
1. With variation in rate of loading on concrete specimen, the strength varies proportionately. 2. At higher rate of loading, the compressive strength increases.
3. The increment is from 30% to almost 50% of the original strength.
4. However, at lower rate of loading, the reduction in strength of concrete cube compared to its true strength is insignificant.
5. The equations derived from the graph of rate of loading vs correction factor enables to find the correction factor with respect to rate of loading.
6. These correction factors enables to compute the true compressive strength of concrete.
REFERENCES
[1] P. H. Bishoff and S. H. Perry, “Compressive behaviour of concrete at high strain rates”, Materials and structural/ Matriaux et Constructions, 1991, 24, p. 425-450.
[2] G. Ruiza, X. X. Zhangb, R. C. Yu, E. Poveda, R. Porras and J. del Viso, “Effect of loading rate on the fracture behaviour of high-strength concrete”, Applied Mechanics and materials Vols. 24-25, 2010, p. 179-185.
[3] H. C. Fu, M. A. Erki, M. Seckin, “Review of effects of loading rate on concrete in compression”, J. Struct. Engg. 1991.117(12), p. 3645-3659.
[4] Leonard Schwer, “Strain rate iduced strength enhancement in concrete: much ado about nothing?”, seventh europian LS-DYNA conference M-I-03, 2009
[5] Otani, Shunsuke, Takashi, Kaneko and Hitoshi Shiohara, “Strain rate effect on performance of reinforced concrete member”, Proceeding of FIB Symphosium on concrete sturctures in sesmic regions. May 2003.5, p. 367-371. [6] Ravindra Gettu, “ Rate effects and loading relaxation on static fracture of concrete”, ACI Materials Journal, title no.
89, M49, 1992, p. 456-458
[7] Ravindra Gettu, Zednek P. Bazant, Shang-Ping Bai, “ Fracture of rock: Effect of loading rate’’, Engg. Fracture MechanicVolume 45, No.3, 1993, p. 393-398.
[8] W. Ghannoum, V. Souma, G. Haussmann, K. Polkinghorne, M. Eck and D. H. Kang, “ Experimental investigations of loading rate of effects in reinforced concrete columns”, J. Struct. Engg., 2012.138, p. 1032-1041.