VOLUME 38, ARTICLE 62, PAGES 1933,2002
PUBLISHED 12 JUNE 2018
http://www.demographic-research.org/Volumes/Vol38/62/
DOI: 10.4054/DemRes.2018.38.62
Research Article
The association between CVD-related
biomarkers and mortality in the Health and
Retirement Survey
Hannes Kröger
Rasmus Hoffmann
© 2018 Hannes Kröger & Rasmus Hoffmann.
This open-access work is published under the terms of the Creative Commons
Attribution 3.0 Germany (CC BY 3.0 DE), which permits use, reproduction,
and distribution in any medium, provided the original author(s) and source
are given credit.
1
Introduction
1934
2
Data and methods
1936
3
Analyses
1939
4
Results
1939
4.1
Cluster solution
1939
4.2
Description of risk groups and risk profiles
1940
4.3
Mortality prediction of different functional forms
1942
4.4
Cardiovascular mortality
1949
4.5
Gender- and age-specific results
1949
4.6
Excluding high levels of CRP
1950
5
Discussion
1951
6
Conclusion
1953
References
1955
The association between CVD-related biomarkers and mortality
in the Health and Retirement Survey
Hannes Kröger
1Rasmus Hoffmann
2Abstract
BACKGROUND
It has become increasingly common in multiple purpose general population surveys to
integrate different kinds of biomarker in the data collection process.
OBJECTIVE
In this article we test the predictive power of five different functional forms of
CVD-related biomarkers for all-cause and CVD mortality in the Health and Retirement Study
(HRS).
METHODS
We use five different functional forms of biomarker: A risk factor index, risk factors
separately, continuous biomarkers, risk groups comprising every possible combination
of risk factors, and a cluster analytic approach to identify risk profiles in the sample.
We use data from the Health and Retirement Study (HRS) with information on four
collected biomarkers (glycated hemoglobin (hbA1c), high-density lipoprotein (HDL),
total cholesterol, and C-reactive protein (CRP)) with an eight-year mortality follow-up
period.
RESULTS
The results show that the additive index has comparatively high predictive power,
relative to its simplicity. Risk profiles were identified in the data, with substantial
differences in mortality risk between the profiles. The more complex functional forms
improve prediction only moderately compared to the simple index, although we can
identify groups with an elevated mortality risk that are not identified in more
parsimonious approaches.
1
Deutsches Institut für Wirtschaftsforschung (DIW), Berlin, Germany. Email:
[email protected]
.
CONCLUSIONS
Depending on the specific research question, both a very simple modeling of biomarker
information and more detailed examinations of specific complex risk profiles can be
appropriate.
CONTRIBUTION
The study provides initial guidelines for the measurement of commonly used
biomarkers, which can be a reference for other studies that use biomarkers as health
indicators or for mortality prediction.
1. Introduction
It has become increasingly common in multiple purpose general population surveys to
integrate different kinds of biomarker in the data collection process. This enables the
objective measurement of different aspects of respondents’ health status in addition to
conventional self-reported measures (Layard 2010; Lindau and McDade 2008). This
combination allows researchers to bridge disciplinary boundaries between social
sciences, epidemiology, and medical and health sciences. The problem during data
collection is one of limited resources, both in terms of the time and effort of the
respondents themselves and with regard to the financial resources necessary to measure
biomarkers (Hauser et al. 2010; Weir 2008). This limitation forces general population
surveys – for which health is just one dimension among others – to focus on a reduced
subset of potentially relevant biomarkers. Therefore, many surveys have primarily
relied on biomarkers that have been shown in prior (clinical) research to be predictive
of cardiovascular disease (CVD), as this constitutes the major cause of death in midlife
and old age in most countries hosting these surveys (Hernon 2013; Lozano et al. 2012;
Murray and Lopez 1997).
al. 2016a; Juster, McEwen, and Lupien 2010; McEwen 1998; Seeman et al. 2001) and
biological age (Levine and Crimmins 2014), or on more specific CVD indices,
including the well-known Framingham Heart Score (Lloyd-Jones et al. 2004). In many
applications it is difficult to find an explicitly theoretically driven framework for the
implementation of biomarkers in survey research. It is thus important to have external
references upon which the decision of how to use biomarkers can be based. In this study
we provide evidence of the association between mortality and a reduced set of
CVD-related biomarkers, helping future studies to determine which functional form of
biomarker might be most suitable for their approach.
Using binary risk factors is the most common approach to utilizing the information
contained in biomarkers; this method is based on clinical evidence of the harmfulness
of experiencing certain conditions above a certain threshold (e.g., hypertension if
systolic blood pressure is elevated above 140 mmHg). Many biosocial surveys give
explicit guidelines to users on how to construct such risk factors, which makes them
easy to use even without prior experience in this field (Benzeval et al. 2014; Crimmins
et al. 2013). Our analyses are therefore of an explanatory nature, and are designed to
determine whether mortality prediction is best achieved by using a simple risk factor
index, binary risk factors, continuous biomarkers, risk profiles, or risk groups based on
a combination of risk factors.
With our study we provide evidence that can guide the use of biomarkers in
biosocial surveys and contribute to the literature examining different functional
relationships between survey-based biomarkers and mortality.
The main criteria that we try to balance when comparing the different
specifications of functional forms of biomarkers are the predictive power of the whole
model and of group membership in identified risk groups on the one hand, versus the
parsimony of the model specification on the other. Predictive power in our context
means how well the model can distinguish between those who die and those who
survive in the period of observation and how well the predicted age of death matches
the observed age of death. Ultimately, a strongly predictive model is desirable, but the
complexity of the model is a natural trade-off. A model can always be made more
predictive by adding any number of variables to the model or by introducing
interactions between existing variables. However, the more complex a model is, the
harder it will be to interpret theoretically, and the greater the risk of overfitting.
Overfitting means that the model produces good results in the data set being researched,
but will perform relatively poorly when the model is applied to another dataset because
the complexity of the model takes too many dataset-specific idiosyncrasies into account
that do not reflect actual underlying processes in the population. Therefore, a reduction
in complexity is also valuable – if it does not come at too great a cost of predictive
power – because it allows future research to integrate simpler functional forms of
biomarker into their studies more easily and to focus on other areas of the model.
2. Data and methods
We use data from the Health and Retirement Study (HRS), a survey of the general
household population aged 50+ in the US (Sonnega et al. 2014). The HRS is sponsored
by the National Institute on Aging (grant number NIA U01AG009740) and is
conducted by the University of Michigan. In our analyses we use both the harmonized
HRS data set from RAND
3(RAND 2016) and sensitive health data on biomarkers
(Health and Retirement Study 2013).
In the HRS, blood-based, CVD-related biomarkers were collected in 2006 for one
half of the total sample and in 2008 for the other half. HRS uses the dried blood spot
method to collect biomarkers (Crimmins et al. 2014). We use the first measurements of
blood spots in HRS (2006 and 2008) and an eight-year mortality follow-up to assess
all-cause mortality (six-year follow up for those who had their blood spots taken in 2008).
3
The RAND HRS data file is an easy-to-use longitudinal data set based on the HRS data. It was developed at
The analyses exclude individuals with invalid survey weights or missing
information on the race control variable, those who have information missing entirely
on three or more of the four biomarkers given below (or on the death indicator), and
those who are never observed beyond the first time point of measurement (1,350 cases).
Those with partially missing data on biomarkers are retained; multiple imputation by
chained equation (MICE) is used to handle the missing data (White, Royston, and
Wood 2011). Thirty imputed data sets are used for the analyses, and the parameters and
standard errors are calculated by applying Rubin’s rule (Rubin 2004). This leaves
14,416 individuals to be analyzed, of whom 2,029 die during the period of observation,
794 of them with CVD as the main cause of death.
We study four biomarkers in this study: cholesterol, hbA1c, C-reactive protein,
and systolic blood pressure. In the sample the correlation between systolic and diastolic
blood pressure is over 0.7, indicating that they transport similar information. We use the
ratio of total cholesterol to HDL cholesterol, as the first waves of data collection in
HRS using the dried blood spot method resulted in implausible cholesterol levels.
Although all measures in HRS were adjusted to reflect levels equivalent to markers
taken from venous blood (Crimmins et al. 2014), the levels of total and HDL
cholesterol deviate strongly from those in reference studies like NHANES (Crimmins et
al. 2013). The distortion is proportional for total and HDL cholesterol, so that the ratio
is comparable to other studies. It holds for all four biomarkers that we study that higher
values potentially indicate more problems. However, there are cut-off values that have
been used previously in the literature which indicate that the biomarker lies outside the
normal range and a potential health risk is present. The cut-off points used to define
binary risk factors from the continuous measures of the biomarkers are noted in
parentheses:
1. Ratio of total to HDL cholesterol (Men: ≥ 5; Women: ≥ 4.5)
2. Glycated hemoglobin, hbA1c (≥ 6.4%)
3. C-reactive protein (≥3
mgl
)
4. Systolic blood pressure (SBP, ≥140 mmHg)
used in previous studies (Rosero-Bixby and Dow 2009; Seeman et al. 2004) and has
been tested in a randomized control trial (The SPRINT Research Group 2015).
All analyses are weighted by weights provided by the HRS survey team (Crimmins
et al. 2013). These weights are meant to account for non-random sampling and selective
non-response to participation in the biomarker measurement. Table 1 presents the
summary statistics in the sample. All data preparation and analyses use Stata 14.2
including user-written packages (Jann 2007). The calculation of the area under the
curve (AUC) for the survival analytic models was done in R 3.4.1 using the
survivalROC package (Heagerty and Saha-Chaudhuri 2013).
Table 1:
Summary statistics
Mean SD Minimum Maximum Missing
Age at measurement 67.11 9.69 51.00 89.00 0
White 0.78 0.42 0.00 1.00 0
Black 0.16 0.37 0.00 1.00 0
Other 0.06 0.24 0.00 1.00 0
Male 0.43 0.49 0.00 1.00 0
Risk factors
High ratio of TC to HDL (>5) 0.22 0.42 0.00 1.00 2,126
High hbA1c (≥6.4%) 0.16 0.37 0.00 1.00 159
High CRP (≥3.0 ug/mL) 0.38 0.49 0.00 1.00 520
High risk systolic BP (≥140 mmHG) 0.32 0.47 0.00 1.00 694
Continuous biomarkers
Ratio of TC to HDL 3.97 1.24 1.33 23.85 2,126
Blood glycated hemoglobin level (%) 5.89 1.04 3.57 17.26 159
Blood CRP level (ug/mL) 4.36 8.31 0.02 280.00 520
Systolic BP (mmHG) 131.62 20.35 41.67 223.33 694
Observations 14,416
In our study we consider five different functional forms of the biomarker data that is
collected in HRS. First, we compose a simple index (“index”) counting the number of
risk factors individuals exhibit, which ranges from 0 to 4. Second, we consider the risk
factors as separate dichotomous indicators, which is the most common approach (“risk
factors”). Third, we use the biomarkers in their continuous form (“continuous”). Fourth,
we define risk groups based on every possible combination of risk factors, resulting in
2
4=16 risk groups (“risk groups,” RG). Fifth, we use a cluster analytic approach to
identify risk profiles based on the continuous information from the biomarkers (“risk
profiles,” RP).
3. Analyses
We assess the predictive power of the different functional forms of biomarker in two
ways. First, we look for differences in mortality risk between risk groups based on
biomarkers using Cox proportional hazard models. Second, we evaluate the overall
model fit by employing a classification measure, namely the area under the curve
(AUC) based on the receiver operating characteristic (ROC), developed for survival
analytic models (Heagerty and Zheng 2005). All models are adjusted for a second order
polynomial of age at the time of blood spot measurement, a dummy for white versus
non-white, and gender.
Before the analyses of predictive power can be conducted, we require a cluster
solution to identify biomarker risk profiles in the data. We perform a cluster analysis
using the method of Ward and Hook (Ward 1963; Ward and Hook 1963) and Euclidean
distance as the dissimilarity measure. All biomarkers are z-standardized to enable the
equal contribution of each biomarker to the cluster solution, despite differences in
scaling. In finding an optimal cluster solution we aim to balance a parsimonious
approach, with the goal of identifying hidden combinations of biomarker levels that
might be harmful. To retain a level of parsimony, the maximum number of clusters
should not exceed the number of risk groups derived from the combination of risk
factors, which is 16. Given a maximum number of 16 clusters, we use the elbow
criterion on two scree plots to determine the number of clusters. We look at the increase
in the dissimilarity, which is the traditional criterion endogenous to the clustering
algorithm, but more importantly we look at the decrease in predictive power in terms of
the AUC with each step of merging two clusters. We choose the solution of 16 clusters
or fewer for which we find the first significant decrease in AUC or significant increase
in the dissimilarity measure, whichever comes first.
4. Results
4.1 Cluster solution
complexity in the analyses, resulting in a 9-cluster solution instead of a 16-cluster
solution.
Figure 1: Scree plot
a) Scree plot for dissimilarity measure b) Scree plot for AUC
Note: The figure shows the relationship between the cluster solution and the dissimilarity measure (left panel 1a) and the decrease in AUC in a survival analytic model (right panel 1b).
4.2 Description of risk groups and risk profiles
Table 2:
Risk groups as combinations of risk factors and their distribution in
the sample
Risk factor
Risk group Cholesterol hbA1c CRP BP(sys) N Prop. (%)
0000 0 0 0 0 3,624 31.05
0001 0 0 0 1 1,492 12.78
0010 0 0 1 0 1,809 15.5
0011 0 0 1 1 844 7.23
0100 0 1 0 0 453 3.88
0101 0 1 0 1 282 2.42
0110 0 1 1 0 373 3.2
0111 0 1 1 1 227 1.94
1000 1 0 0 0 814 6.97
1001 1 0 0 1 331 2.84
1010 1 0 1 0 594 5.09
1011 1 0 1 1 334 2.86
1100 1 1 0 0 124 1.06
1101 1 1 0 1 90 .77
1110 1 1 1 0 150 1.29
1111 1 1 1 1 130 1.11
Figure 2:
Description of cluster solution in standard deviations from the
sample mean
Note: Cholesterol = Ratio of total to HDL cholesterol; hbA1c = Glycated hemoglobin; CRP= C-reactive protein; BP (SYS) = Systolic blood pressure
4.3 Mortality prediction of different functional forms
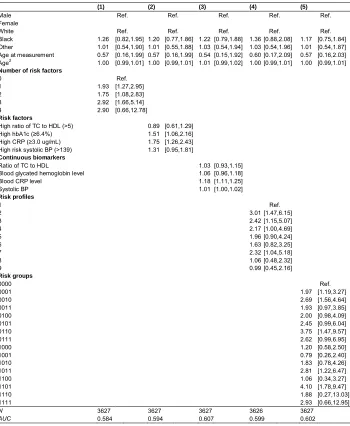
Table 3:
Hazard ratios from Cox models on all-cause mortality with different
functional forms on their own
(1) (2) (3) (4) (5)
Male Ref. Ref. Ref. Ref. Ref.
Female 0.66 [0.60,0.73] 0.64 [0.58,0.70] 0.67 [0.61,0.74] 0.64 [0.58,0.71] 0.63 [0.57,0.70]
White Ref. Ref. Ref. Ref. Ref.
Black 1.24 [1.06,1.44] 1.18 [1.01,1.37] 1.21 [1.03,1.41] 1.22 [1.05,1.43] 1.18 [1.01,1.37] Other 0.82 [0.62,1.10] 0.82 [0.61,1.10] 0.78 [0.58,1.05] 0.82 [0.61,1.10] 0.82 [0.61,1.09] Age at measurement 1.00 [0.80,1.25] 0.99 [0.79,1.24] 1.01 [0.81,1.26] 1.01 [0.81,1.27] 0.99 [0.79,1.24] Age2 1.00 [1.00,1.00] 1.00 [1.00,1.00] 1.00 [1.00,1.00] 1.00 [1.00,1.00] 1.00 [1.00,1.00]
Number of risk factors
0 Ref.
1 1.43 [1.24,1.66]
2 1.70 [1.45,1.98]
3 2.20 [1.80,2.68]
4 3.54 [2.41,5.21]
Risk factors
High ratio of TC to
HDL (>5) 1.00 [0.88,1.14]
High hbA1c (≥6.4%) 1.58 [1.40,1.78] High CRP (≥3.0
ug/mL) 1.77 [1.59,1.96]
High risk systolic BP
(>139) 1.00 [0.90,1.12]
Continuous biomarkers
Ratio of TC to HDL 1.04 [1.00,1.08]
Blood glycated
hemoglobin level 1.18 [1.13,1.23]
Blood CRP level 1.01 [1.01,1.02]
Systolic BP 1.00 [1.00,1.00]
Risk profiles
1 Ref.
2 1.93 [1.55,2.39]
3 1.31 [1.04,1.64]
4 1.76 [1.43,2.18]
5 1.64 [1.24,2.16]
6 1.01 [0.80,1.27]
7 3.10 [2.42,3.96]
8 1.09 [0.87,1.38]
9 0.86 [0.67,1.09]
Risk groups
0000 Ref.
0001 1.15 [0.95,1.40]
0010 1.95 [1.64,2.33]
0011 1.58 [1.27,1.96]
0100 1.48 [1.13,1.95]
0101 1.63 [1.21,2.20]
0110 3.18 [2.42,4.19]
0111 2.68 [2.03,3.55]
1000 1.03 [0.78,1.37]
1001 1.02 [0.72,1.45]
1010 1.82 [1.40,2.37]
1011 1.76 [1.33,2.35]
1100 1.36 [0.88,2.10]
1101 2.07 [1.26,3.37]
1110 2.69 [1.76,4.11]
1111 3.57 [2.43,5.26]
N 14,416 14,416 14,416 14,416 14,416
Model 4 shows mortality risk differences between the RPs identified in the data.
With reference to RP1 (slightly higher BP, low other markers), only RP6 (very high
hBA1c, elevated other biomarkers), RP8, and RP9 (the low risk profiles) do not differ
significantly in terms of mortality risk. The mortality risk increases considerably for
RP7 (high hbA1c, average other biomarkers HR 3.10 [CI: 2.42; 3.96]), and moderately
for RP2 (low cholesterol, but high BP and CRP, HR 1.93 [CI: 1.55; 2.39]) and RP4
(very high CRP, HR 1.76 [CI: 1.43; 2.18]). The other profiles show even lower HR.
This shows that high inflammation and undiagnosed (or untreated) diabetes are strong
risk factors, as is high cholesterol. A surprising result is that RP6, which has extremely
high levels of hbA1c and increased other biomarkers, is not associated with increased
mortality risk, even though one would expect it to be, given the diabetes risk and
increased other biomarkers.
Using the combination of predefined risk factors as risk groups, we see some of
these results validated. Unsurprisingly, the highest mortality risk is for those who have
all four risk factors. Also particularly high are those with both CRP and hbA1c (0110,
HR 3.18 [CI: 2.42; 4.19]), those with all risk factors present except elevated blood
pressure (1110, HR 2.69 [CI: 1.76; 4.11]), and those with all risk factors present except
high cholesterol (0111, HR 2.68 [CI: 2.03; 3.55]).
It is of further interest to establish which of the functional forms retain predictive
power if the other functional forms are controlled for. For this purpose we estimated
three further models, which are composed of, respectively:
a) the index, the continuous data, and the risk profiles (RPs);
b) the risk factors (RFs), the continuous data, and the RPs, and
c) the continuous data, the RPs, and the risk groups.
When taking the RPs and continuous levels into account, the index still retains
some predictive power, with those who have 3 or 4 RFs showing an increased mortality
risk (HR 1.62 [CI: 1.20; 2.18] and 2.37 [CI: 1.48; 3.79] respectively). The mortality risk
differences for the RPs are somewhat attenuated in all three models, but especially the
RPs mentioned above (2,4,7) still show substantially higher mortality risk, even when
taking risk factors, continuous measures, and even the predefined risk group
combinations into account. For continuous biomarkers, only CRP retains some
predictive power; however, its effect is smaller than the unconditional effect estimate,
albeit still significant in all three models.
For the risk factors the hazard ratios of CRP and hbA1c are also attenuated, but
exhibit some increased mortality risk when taking RPs and continuous measures into
account (HR 1.31 [CI: 1.12; 1.53] and 1.42 [CI: 1.19; 1.69] respectively). Finally, the
risk groups are also attenuated; when controlling for RPs and continuous measures,
however, the same combinations as above show an increased mortality to a greater
extent than RP membership.
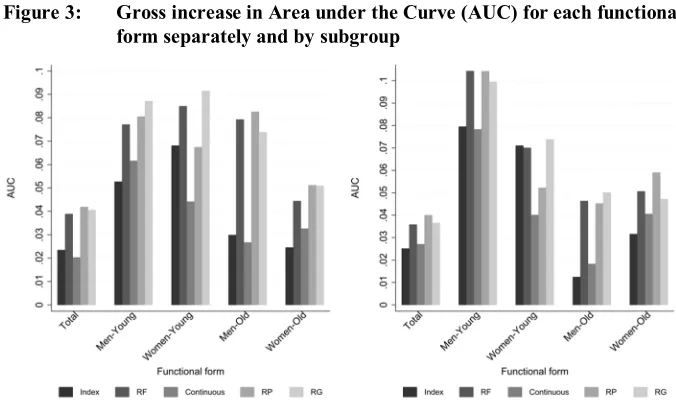
Figures 3 and 4 plot the AUC for the survival models. The left-hand panel shows
the results for all-cause mortality, the right-hand panel the results for CVD mortality.
We will first discuss the results for all-cause mortality and then turn to the results for
CVD mortality in a separate section. Within the panels the results are divided into
analyses for the total sample and into analyses for gender- and age-specific subgroups.
Again, we will first discuss the results for the total sample and turn to the
subgroup-specific results in a separate section.
Table 4:
Hazard ratios from Cox models on all-cause mortality with different
functional forms conditional on the other forms
(1) (2) (3)
Male Ref. Ref. Ref.
Female 0.63 [0.57,0.70] 0.64 [0.58,0.72] 0.64 [0.58,0.71]
White Ref. Ref. Ref.
Black 1.17 [1.00,1.37] 1.16 [0.99,1.35] 1.16 [0.99,1.36]
Other 0.81 [0.60,1.08] 0.81 [0.60,1.08] 0.81 [0.60,1.08]
Age at measurement 1.01 [0.81,1.26] 1.00 [0.80,1.25] 1.00 [0.80,1.25]
Age2 1.00 [1.00,1.00] 1.00 [1.00,1.00] 1.00 [1.00,1.00]
Number of risk factors
0 Ref.
1 1.32 [1.09,1.59]
2 1.38 [1.10,1.73]
3 1.62 [1.20,2.18]
4 2.37 [1.48,3.79]
Risk factors
High ratio of TC to HDL (>5) 0.92 [0.75,1.13]
High hbA1c (≥6.4%) 1.42 [1.19,1.69]
High CRP (≥3.0 ug/mL) 1.31 [1.12,1.53]
High risk systolic BP (>139) 1.02 [0.85,1.22]
Continuous biomarkers
Ratio of TC to HDL 0.98 [0.92,1.04] 1.05 [0.97,1.13] 1.05 [0.97,1.13] Blood glycated hemoglobin level 1.05 [0.98,1.13] 1.01 [0.93,1.10] 1.01 [0.93,1.10] Blood CRP level 1.01 [1.00,1.01] 1.01 [1.00,1.01] 1.01 [1.00,1.01] Systolic BP 1.00 [0.99,1.00] 1.00 [0.99,1.00] 1.00 [0.99,1.00]
Risk profiles
1 Ref. Ref. Ref.
2 1.55 [1.21,1.99] 1.38 [1.07,1.79] 1.47 [1.12,1.92]
3 1.28 [0.98,1.68] 1.25 [0.95,1.63] 1.26 [0.96,1.65]
4 1.54 [1.22,1.95] 1.42 [1.10,1.83] 1.40 [1.07,1.83]
5 1.39 [0.97,1.98] 1.21 [0.83,1.76] 1.23 [0.84,1.81]
6 0.95 [0.74,1.23] 0.90 [0.69,1.17] 0.93 [0.70,1.22]
7 2.05 [1.43,2.95] 1.77 [1.23,2.53] 1.79 [1.23,2.60]
8 1.19 [0.90,1.56] 1.12 [0.86,1.45] 1.17 [0.89,1.55]
9 0.92 [0.72,1.19] 0.91 [0.71,1.17] 0.92 [0.72,1.19]
Risk groups
0000 Ref.
0001 1.19 [0.92,1.52]
0010 1.46 [1.15,1.85]
0011 1.23 [0.92,1.66]
0100 1.46 [1.05,2.01]
0101 1.47 [1.03,2.12]
0110 2.05 [1.46,2.88]
0111 1.80 [1.25,2.58]
1000 0.99 [0.70,1.40]
1001 0.88 [0.56,1.38]
1010 1.28 [0.90,1.82]
1011 1.22 [0.84,1.77]
1100 1.14 [0.69,1.88]
1101 1.57 [0.89,2.76]
1110 1.74 [1.05,2.87]
1111 2.21 [1.37,3.55]
N 14,416 14,416 14,416
AUC 0.625 0.625 0.626
We can see in Figure 3 that continuous biomarkers have the lowest gross increase
in AUC (0.02), meaning comparatively low predictive power for mortality status. The
risk index is the second lowest (0.024); after that, the risk factors, risk groups, and risk
profiles have higher gross AUC, and are very close together (about 0.04). Overall, the
gross increase in predictive power is not very high, with an increase from 0.576 to a
maximum of 0.618.
The marginal gains shown in Figure 4 are, of course, smaller than the gross gains.
The continuous biomarkers are lowest again, and risk profiles and risk groups have the
highest marginal discriminatory power, but the additional gain remains below 0.01 in
all cases.
Summing up, we can say that the different functional forms of the four biomarkers
under study show some degree of gross and marginal predictive power. We established
that especially those groups with extreme values in CRP (RP4), hbA1c (RP7), and
blood pressure (combined with increased CRP, RP2) have an increased mortality risk,
even accounting for their specific risk factor combinations. Extreme values of CRP are
often taken as indicators of acute rather than chronic inflammation, and previously have
often been excluded when taking CRP as an indicator of chronic inflammation (Osman
et al. 2006). These results show that very high levels of CRP actually do correlate with
an additional increase in mortality risk, and thus that it might only be prudent to
exclude them if one wants to target just chronic conditions and can also be sure that
such elevated levels are due solely to inflammatory diseases, which is not always the
case (Ishii et al. 2012). The risk groups showed that the combination of CRP and hbA1c
is particularly associated with elevated mortality, and also that merely a higher number
of risk factors, regardless of the specific combination, increases the mortality risk –
highlighting the validity of the simple risk factor index.
Figure 3:
Gross increase in Area under the Curve (AUC) for each functional
form separately and by subgroup
Note: The AUC is averaged over age in the total sample and within the age-specific groups. The left hand panel shows all-cause mortality, the right hand panel CVD mortality. RF = risk factors; RP = risk profiles; RG = risk groups.
Figure 4:
Marginal increase in Area under the Curve (AUC) for each
functional form separately and by subgroup
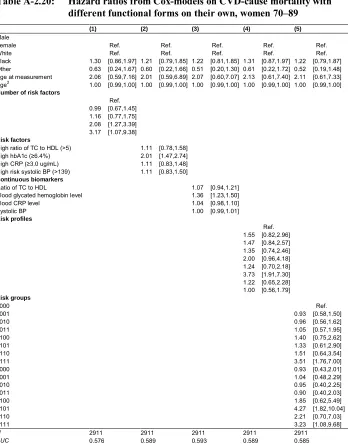
4.4 Cardiovascular mortality
As the four biomarkers used in this study are particularly indicative of
cardiovascular-related diseases, we repeat the analyses using CVD-specific mortality instead of
all-cause mortality as the event in the survival analytical models. The right hand panels of
Figures 3 and 4 show that, for the total sample, levels of predictive power are about the
same in CVD-specific and all-cause mortality models. The performance of continuous
biomarkers is a little better in CVD-specific models relative to the other functional
forms.
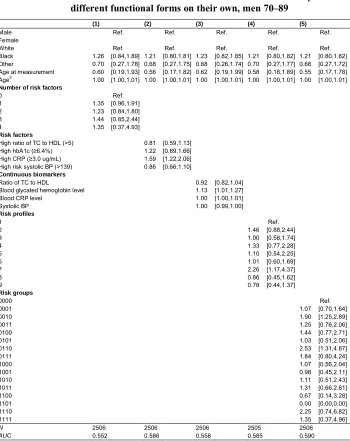
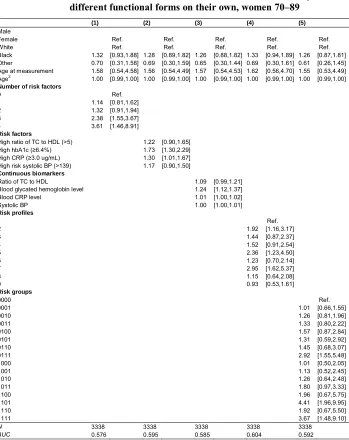
4.5 Gender- and age-specific results
We further explore whether the predictive power is different between the young (50–
69) and old (70–89), with age referring to starting age, and whether the results differ
between men and women. We divide the subgroups by age and gender simultaneously
because the majority of deaths in young age are men, so that a division by age would be
automatically correlated with gender in the results. For simplicity, we look just at the
AUC for overall model predictive power. The results are reported in Figures 3 and 4.
The gross predictive power of all functional forms is highest among young men,
especially for CVD-specific mortality. For marginal predictive power the differences
are smaller, and differences between groups are less pronounced. In old age, on average
the biomarkers can predict mortality to a lesser degree, a result mainly driven by the
poor performance of the index and continuous biomarkers. This indicates that in old
age, more complex combinations might be necessary to adequately predict mortality,
whereas the loss resulting from more parsimonious functional forms is lower in
younger age groups.
4.6 Excluding high levels of CRP
High levels of CRP (above 10
mgl
) are often seen as an indicator of acute illness, and
some studies that focus on CRP as an indicator of chronic stress or allostatic load
exclude those observations (Freeman et al. 2016). To check the sensitivity of our results
to the decision to include or exclude individuals with very high CRP levels, we repeat
all analyses for a sample restricted to CRP levels of below 10
mgl(1,809 individuals,
12.55% of the sample).
Figure 5 shows the comparison of the AUC with and without individuals with very
high levels of CRP. The values chosen are for the total sample and all-cause mortality,
but are illustrative of the structure in all model specifications (see Table A-1 in the
Appendix). The most striking finding is that the continuous biomarkers gain in gross
predictive power, while all other functional forms lose power. Excluding high-level
CRP individuals leaves all four more complex functional forms with about the same
level of predictive power, while the index is still lower. Looking at the marginal benefit
on the right hand side of Figure 5, continuous biomarkers gain as well, but remain
below the other functional forms.
Figure 5:
Gross and marginal increase in Area under the Curve (AUC) by
CRP-based exclusion criterion
Thus, which population is under investigation in a study on CVD-related
biomarkers, be it the whole population or only individuals with non-acute health
problems, may also be potentially significant. The continuous biomarkers, especially
CRP, have a much higher discriminatory power relatively and absolutely speaking
when individuals suspected to have some kind of acute illnesses are excluded. This
needs to be taken into account when making decisions about the functional form to be
used; however, it should be noted that there is no correct choice per se, and the
definition of the population to be examined depends on the specific research question.
5. Discussion
The aim of our study is to determine how a reduced set of CVD-related biomarkers,
gathered as part of a population-based survey, is related to all-cause and CVD-related
mortality. In particular, we try to estimate how much predictive power can be delivered
by different functions – both parsimonious and more complex – of four biomarkers, as
collected in the Health and Retirement Study (HRS). Simple codings – like an index, or
the risk factors on their own – showed substantial risk differences and had adequate
discriminatory power overall. Beyond these simple codings, certain combinations of
risk factors, especially inflammation and diabetes biomarkers, identified groups of
individuals at an increased risk of mortality. Using continuous biomarkers yielded the
lowest overall predictive power in the total sample and contributed little additional
predictive power, but had equal predictive power in a sample excluding individuals
with very high levels of CRP (suspected acute illness). This highlights the fact that
there is probably no universally valid optimal functional form: Different populations
under study might warrant a different treatment of the biomarkers. Linearity seems to
be violated in the case of CRP, and we can consider very high levels of CRP to have a
different gradient than moderate levels (below 10
mgl
).
Within the sample we were also able to identify risk profiles that showed
considerable differences in mortality risk, even after controlling for risk-factor-based
functional forms of the biomarkers. Here, extreme values of CRP (in particular) and
hbA1c were predictive, as was the combination of high CRP and very high blood
pressure, beyond the simple fact of an individual possessing the risk factor or not.
the simple index, the total gain is modest. Therefore, we argue that in certain
circumstances in which survey-based research focuses on generalized concepts like
allostatic load (Delpierre et al. 2016a; Juster, McEwen, and Lupien 2010; McEwen
1998; Seeman et al. 2001), our results validate such a parsimonious approach, at least
for the set of CVD-related biomarkers under study here. A similar approach might seem
appropriate if health inequalities with respect to objective indicators are the subject of
investigation (Dowd and Zajacova 2010; Rosero-Bixby and Dow 2009), as an
alternative to looking at risk differences for specific health issues, such as hbA1c for
diabetes (Bennett, Guo, and Dharmage 2007; Rohlfing et al. 2000).
On the other hand, a closer examination of groups that exhibit unusual
combinations of biomarker levels might also be a worthwhile research undertaking, be
it to establish the consequences of belonging to these risk groups or risk profiles, or to
establish the determinants of being in such a risk group. The fact that the predictive
power of several of the risk profiles was still present when taking other functional forms
into account corroborates the interpretation that the combinations of biomarker levels
are related to processes that affect the cardiovascular system (and perhaps other
systems) beyond what we can diagnose from the simple risk factor approaches.
From the analyses of subgroups we were able to establish that gross increase in
predictive power was higher for younger than for older individuals. In older age, many
more factors come into play that contribute to mortality risk, reducing the overall
discriminatory power of the biomarkers, regardless of functional form. We find no
stronger link across all groups between the biomarkers and CVD mortality than is the
case with all-cause mortality, despite the fact that the biomarkers under study are
particularly predictive of CVD mortality. However, this refers to overall model
prediction.
Limitations
used as indicators of frailty (Walston et al. 2006). Whether this hypothesis holds has to
be tested in future studies.
Second, we excluded by design individuals who had all missing information on
biomarkers and those who refused the biomarker collection. Although we used weights
to account for selective participation in the blood spot measurements, it is possible that
the results might be systematically different for certain individuals, perhaps those who
were very infirm and at high mortality risk due to poor health at the time of the
interview, thus resulting in their nonparticipation. Unfortunately, it is unclear whether
this exclusion leads to an overestimation or underestimation of the predictive power of
the functional forms of biomarkers we tested.
Third, we only investigated the biomarkers’ relationship with all-cause and
CVD-specific mortality. However, it would be interesting to establish the relationship with
other cause-specific mortality. Despite the fact that the biomarkers investigated in HRS
were collected with a special focus on cardiovascular disease (Weir 2008), the results
for all-cause mortality are similar to those for CVD mortality with respect to predictive
power. Nevertheless, for more specific analyses, a dataset with a higher number of
events and a more specific classification of causes of deaths is needed in future
research.
Finally, we only evaluated one survey; it is important to replicate the analyses
using different data sets, as our strategy was largely explorative. When testing the
approach with other data, it would be productive both to analyze a data set that had no
or little prior panel attrition – as the HRS has (Domingue et al. 2017) – and also to use
data in which biomarkers were collected not from dried blood spots but through
different methods, such as venous blood, to see whether this yields similar results.
Based on these limitations, and on our analysis of previous studies, we conclude
that reference studies that evaluate different ways of using objective health indicators
like biomarkers in biosocial surveys are an important part of the research process: They
can help establish the predictive value of those indicators for mortality, and create a
basis for further research investigating the determinants and consequences of
biomarkers gathered by population-based social surveys.
6. Conclusion
depend not on overall model quality but on whether certain specific risk group
combinations need to be identified. For continuous biomarkers, especially CRP,
whether individuals with acute illness are to be excluded from the analyses (which
increases the predictive power) or whether they are to be included seems to play a role.
While the total gain in predictive power might look sobering at first, we cannot expect
to make phenomenal gains in predictive power using only four indicators which are, as
all variables, subject to measurement error, and can only reflect the limited aspect of the
organism’s functioning that is relevant to morbidity and mortality. It has to be
remembered that a major advantage of integrating biomarkers lies in their objective
measurement, which makes them complementary to self-reported and subjective
measures in large-scale population-based surveys.
References
American Diabetes Association (2011). Executive summary: Standards of medical care
in diabetes: 2011.
Diabetes Care
34(Supplement 1): S4–S10.
doi:10.2337/dc11-S004
.
Bennett, C.M., Guo, M., and Dharmage, S.C. (2007). HbA1c as a screening tool for
detection of Type 2 diabetes: A systematic review.
Diabetic Medicine
24(4):
333–343.
doi:10.1111/j.1464-5491.2007.02106.x
.
Benzeval, M., Davillas, A., Kumari, M., and Lynn, P. (2014).
Understanding society:
The UK Household Longitudinal Study: Biomarker user guide and glossary
.
Colchester: University of Essex.
Crimmins, E., Faul, J., Kim, J.K., Guyer, H., Langa, K., Ofstedal, M.B., Sonnega, A.,
Wallace, R., and Weir, D. (2013).
Documentation of biomarkers in the 2006 and
2008 Health and Retirement Study
. Ann Arbor: Survey Research Center,
University of Michigan.
Crimmins, E., Kim, J.K., McCreath, H., Faul, J., Weir, D., and Seeman, T. (2014).
Validation of blood-based assays using dried blood spots for use in large
population studies.
Biodemography and Social Biology
60(1): 38–48.
doi:10.1080/19485565.2014.901885
.
Delpierre, C., Barboza-Solis, C., Torrisani, J., Darnaudery, M., Bartley, M., Blane, D.,
Kelly-Irving, M., Getz, L., Tomasdottir, M.O., Roberston, T., and Gustafsson,
P.E. (2016a). Origins of heath inequalities: The case for Allostatic Load.
Longitudinal and Life Course Studies
7(1): 79–103.
doi:10.14301/llcs.v7i1.325
.
Delpierre, C., Fantin, R., Barboza-Solis, C., Lepage, B., Darnaudéry, M., and
Kelly-Irving, M. (2016b). The early life nutritional environment and early life stress as
potential pathways towards the metabolic syndrome in mid-life? A lifecourse
analysis using the 1958 British Birth cohort.
BMC Public Health
16(815): 1–19.
doi:10.1186/s12889-016-3484-0
.
Domingue, B.W., Belsky, D.W., Harrati, A., Conley, D., Weir, D.R., and Boardman,
J.D. (2017). Mortality selection in a genetic sample and implications for
association studies.
International Journal of Epidemiology
46(4): 1285–1294.
doi:10.1093/ije/dyx041
.
Dowd, J.B. and Zajacova, A. (2010). Does self-rated health mean the same thing across
socioeconomic groups? Evidence from biomarker data.
Annals of Epidemiology
Freeman, J.A., Bauldry, S., Volpe, V.V., Shanahan, M.J., and Shanahan, L. (2016). Sex
differences in associations between subjective social status and C-reactive
protein in young adults.
Psychosomatic Medicine
78(5): 542–551.
doi:10.1097/
PSY.0000000000000309
.
Goldman, N., Turra, C.M., Rosero-Bixby, L., Weir, D., and Crimmins, E. (2011). Do
biological measures mediate the relationship between education and health: A
comparative study.
Social Science and Medicine
72(2): 307–315.
doi:10.1016/
j.socscimed.2010.11.004
.
Gruenewald, T.L., Seeman, T.E., Ryff, C.D., Karlamangla, A.S., and Singer, B.H.
(2006). Combinations of biomarkers predictive of later life mortality.
Proceedings of the National Academy of Sciences
103(38): 14158–14163.
doi:10.1073/pnas.0606215103
.
Hamer, M. and Chida, Y. (2009). Associations of very high C-reactive protein
concentration with psychosocial and cardiovascular risk factors in an ageing
population.
Atherosclerosis
206(2): 599–603.
doi:10.1016/j.atherosclerosis.
2009.02.032
.
Hauser, R.M., Weinstein, M., Pool, R., and Cohen, D. (2010).
Conducting biosocial
surveys: Collecting, storing, accessing, and protecting biospecimens and
biodata
. Washington, D.C.: National Academies Press.
Heagerty, P.J. and Saha-Chaudhuri, P. (2013). survivalROC: Time-dependent ROC
curve estimation from censored survival data [electronic resource].
Heagerty, P.J. and Zheng, Y. (2005). Survival model predictive accuracy and ROC
curves.
Biometrics
61(1): 92–105.
doi:10.1111/j.0006-341X.2005.030814.x
.
Health and Retirement Study (2013). Biomarker data 2006, biomarker data 2008:
Public use dataset [electronic resource]. Ann Arbor: University of Michigan.
http://hrsonline.isr.umich.edu/index.php?p=avail
.
Hernon, M. (2013). Deaths: Leading causes for 2010.
National Vital Statistics Reports
62(6): 1–96.
Ishii, S., Karlamangla, A.S., Bote, M., Irwin, M.R., Jacobs, D.R., Cho, H.J., Seeman,
T.E., and Seeman, T.E. (2012). Gender, obesity and repeated elevation of
C-reactive protein: Data from the CARDIA cohort.
PloS One
7(4): e36062.
doi:10.1371/journal.pone.0036062
.
Juster, R.-P., McEwen, B.S., and Lupien, S.J. (2010). Allostatic load biomarkers of
chronic stress and impact on health and cognition.
Neuroscience and
Biobehavioral Reviews
35(1): 2–16.
doi:10.1016/j.neubiorev.2009.10.002
.
Layard, R. (2010). Measuring subjective well-being.
Science
327(5965): 534–535.
doi:10.1126/science.1186315
.
Levine, M.E. and Crimmins, E.M. (2014). A comparison of methods for assessing
mortality risk.
American Journal of Human Biology
26(6): 768–776.
doi:10.1002/ajhb.22595
.
Lindau, S.T. and McDade, T.W. (2008).
Minimally invasive and innovative methods for
biomeasure collection in population-based research
. Washington, D.C.:
National Academies Press.
Lloyd-Jones, D.M., Wilson, P.W.F., Larson, M.G., Beiser, A., Leip, E.P., D’Agostino,
R.B., and Levy, D. (2004). Framingham risk score and prediction of lifetime risk
for coronary heart disease.
The American Journal of Cardiology
94(1): 20–24.
doi:10.1016/j.amjcard.2004.03.023
.
A.A., Moran, A., Mulholland, K., Nair, M.N., Naldi, L., Narayan, K.M.V.,
Nasseri, K., Norman, P., O’Donnell, M., Omer, S.B., Ortblad, K., Osborne, R.,
Ozgediz, D., Pahari, B., Pandian, J.D., Rivero, A.P., Padilla, R.P., Perez-Ruiz,
F., Perico, N., Phillips, D., Pierce, K., Pope III, C.A., Porrini, E., Pourmalek, F.,
Raju, M., Ranganathan, D., Rehm, J.T., Rein, D.B., Remuzzi, G., Rivara, F.P.,
Roberts, T., De León, F.R., Rosenfeld, L.C., Rushton, L., Sacco, R.L., Salomon,
J.A., Sampson, U., Sanman, E., Schwebel, D.C., Segui-Gomez, M., Shepard,
D.S., Singh, D., Singleton, J., Sliwa, K., Smith, E., Steer, A., Taylor, J.A.,
Thomas, B., Tleyjeh, I.M., Towbin, J.A., Truelsen, T., Undurraga, E.A.,
Venketasubramanian, N., Vijayakumar, L., Vos, T., Wagner, G.R., Wang, M.,
Wang, W., Watt, K., Weinstock, M.A., Weintraub, R., Wilkinson, J.D., Woolf,
A.D., Wulf, S., Yeh, P.-H., Yip, P., Zabetian, A., Zheng, Z.-J., Lopez, A.D., and
Murray, C.J.L. (2012). Global and regional mortality from 235 causes of death
for 20 age groups in 1990 and 2010: A systematic analysis for the Global
Burden of Disease Study 2010.
The Lancet
380(9859): 2095–2128.
doi:10.1016/S0140-6736(12)61728-0
.
McEwen, B.S. (1998). Stress, adaptation, and disease: Allostasis and allostatic load.
Annals of the New York Academy of Sciences
840(1): 33–44.
doi:10.1111/j.1749-6632.1998.tb09546.x
.
Murray, C.J.L. and Lopez, A.D. (1997). Alternative projections of mortality and
disability by cause 1990–2020: Global Burden of Disease Study.
The Lancet
349(9064): 1498–1504.
doi:10.1016/S0140-6736(96)07492-2
.
Osman, R., L’Allier, P.L., Elgharib, N., and Tardif, J.-C. (2006). Critical appraisal of
C-reactive protein throughout the spectrum of cardiovascular disease.
Vascular
Health and Risk Management
2(3): 221–237.
doi:10.2147/vhrm.2006.2.3.221
.
Pearson, T.A., Mensah, G.A., Alexander, R.W., Anderson, J.L., Cannon, R.O., Criqui,
M., Fadl, Y.Y., Fortmann, S.P., Hong, Y., Myers, G.L., Rifai, N., Smith, S.C.,
Taubert, K., Tracy, R.P., and Vinicor, F. (2003). Markers of inflammation and
cardiovascular disease.
Circulation
107(3): 499–511.
doi:10.1161/01.CIR.
0000052939.59093.45
.
RAND (2016).
HRS data, version P
. Santa Monica: RAND Center for the Study of
Aging.
Rohlfing, C.L., Little, R.R., Wiedmeyer, H.M., England, J.D., Madsen, R., Harris, M.I.,
Flegal, K.M., Eberhardt, M.S., and Goldstein, D.E. (2000). Use of GHb (HbA1c)
in screening for undiagnosed diabetes in the US population.
Diabetes Care
Rosero-Bixby, L. and Dow, W.H. (2009). Surprising SES gradients in mortality, health,
and biomarkers in a Latin American population of adults.
The Journals of
Gerontology Series B: Psychological Sciences and Social Sciences
64(1): 105–
117.
doi:10.1093/geronb/gbn004
.
Rubin, D.B. (2004).
Multiple imputation for nonresponse in surveys
. Hoboken: Wiley.
Seeman, T.E., Crimmins, E., Huang, M.-H., Singer, B., Bucur, A., Gruenewald, T.,
Berkman, L.F., and Reuben, D.B. (2004). Cumulative biological risk and
socio-economic differences in mortality: MacArthur Studies of Successful Aging.
Social Science and Medicine
58(10): 1985–1997.
doi:10.1016/S0277-9536(03)
00402-7
.
Seeman, T.E., McEwen, B.S., Rowe, J.W., and Singer, B.H. (2001). Allostatic load as a
marker of cumulative biological risk: MacArthur studies of successful aging.
Proceedings of the National Academy of Sciences
98(8): 4770–4775.
doi:10.1073/pnas.081072698
.
Shmotkin, D., Lerner-Geva, L., Cohen-Mansfield, J., Blumstein, T., Eyal, N., Shorek,
A., Kave, G., and Hazan, H. (2010). Profiles of functioning as predictors of
mortality in old age: The advantage of a configurative approach.
Archives of
Gerontology and Geriatrics
51(1): 68–75.
doi:10.1016/j.archger.2009.07.010
.
Sonnega, A., Faul, J.D., Ofstedal, M.B., Langa, K.M., Phillips, J.W.R., and Weir, D.R.
(2014). Cohort profile: The Health and Retirement Study (HRS).
International
Journal of Epidemiology
43(2): 576–585.
doi:10.1093/ije/dyu067
.
The SPRINT Research Group (2015). A randomized trial of intensive versus standard
blood-pressure control.
New England Journal of Medicine
373(22): 2103–2116.
doi:10.1056/NEJMoa1511939
.
Vasunilashorn, S., Best, L.E., Kim, J.K., and Crimmins, E.M. (2014). Predicting
mortality from profiles of biological risk and performance measures of
functioning. In: Anson, J. and Luy, M. (eds.).
Mortality in an international
perspective
. Cham: Springer International: 119–135.
doi:10.1007/978-3-319-03029-6_5
.
Walston, J., Hadley, E.C., Ferrucci, L., Guralnik, J.M., Newman, A.B., Studenski, S.A.,
Ershler, W.B., Harris, T., and Fried, L.P. (2006). Research agenda for frailty in
older adults: Toward a better understanding of physiology and etiology:
Summary from the American Geriatrics Society/National Institute on Aging
Research conference on frailty in older adults.
Journal of the American
Ward, H.J. (1963). Hierarchical grouping to optimize an objective function.
Journal of
the American Statistical Association
58(301): 236–244.
doi:10.1080/01621459.
1963.10500845
.
Ward, H.J. and Hook, E.M. (1963). Application of an hierarchical grouping procedure
to a problem of grouping profiles.
Educational and Psychological Measurement
23: 69–81.
doi:10.1177/001316446302300107
.
Weir, D. (2008).
Elastic powers: The integration of biomarkers into the health and
retirement study
. Washington, D.C.: National Academies Press.
White, I.R., Royston, P., and Wood, A.M. (2011). Multiple imputation using chained
equations: Issues and guidance for practice.
Statistics in Medicine
30(4): 377–
399.
doi:10.1002/sim.4067
.
World Health Organization (2011).
Use of glycated haemoglobin (HbA1c) in diagnosis
Appendix
Table A-1: AUC for all models in the analyses
Gross increase Marginal increase
Baseline Index RF Cont RP RG Index RF RG Mortality Total sample All 0.576 0.599 0.615 0.596 0.618 0.617 0.625 0.625 0.626
CRP <= 10 mg/l 0.579 0.596 0.603 0.611 0.606 0.605 0.614 0.614 0.616 Young men All 0.534 0.587 0.612 0.596 0.615 0.622 0.629 0.635 0.641
All-cause CRP <= 10 mg/l 0.541 0.584 0.594 0.607 0.599 0.602 0.618 0.626 0.634 Young women All 0.573 0.641 0.657 0.617 0.640 0.664 0.667 0.670 0.675 CRP <= 10 mg/l 0.574 0.625 0.638 0.631 0.616 0.638 0.634 0.642 0.647 Old men All 0.522 0.552 0.601 0.548 0.604 0.595 0.614 0.616 0.620 CRP <= 10 mg/l 0.534 0.563 0.592 0.589 0.591 0.590 0.602 0.604 0.607 Old women All 0.538 0.563 0.583 0.571 0.589 0.589 0.598 0.602 0.604 CRP <= 10 mg/l 0.538 0.557 0.575 0.584 0.578 0.582 0.590 0.598 0.599 Total sample All 0.583 0.608 0.619 0.610 0.623 0.620 0.631 0.629 0.632 CRP <= 10 mg/l 0.593 0.611 0.616 0.624 0.617 0.615 0.629 0.626 0.629 Young men All 0.590 0.669 0.694 0.668 0.694 0.689 0.716 0.718 0.720 CRP <= 10 mg/l 0.591 0.662 0.681 0.674 0.695 0.679 0.716 0.713 0.721
CVD Young women All 0.606 0.677 0.676 0.646 0.658 0.680 0.684 0.681 0.690 CRP <= 10 mg/l 0.647 0.698 0.688 0.678 0.681 0.710 0.703 0.702 0.726 Old men All 0.540 0.552 0.586 0.558 0.585 0.590 0.602 0.602 0.607 CRP <= 10 mg/l 0.537 0.551 0.574 0.581 0.576 0.566 0.599 0.601 0.594 Old women All 0.544 0.576 0.595 0.585 0.604 0.592 0.610 0.613 0.611 CRP <= 10 mg/l 0.546 0.576 0.589 0.593 0.589 0.585 0.605 0.610 0.609
Note: RF = risk factors; Cont = continuous biomarkers; RP = risk profiles; RG = risk groups.
Table A-2.1: Hazard ratios from Cox-models on all-cause mortality with different
functional forms on their own, total sample
(1) (2) (3) (4) (5)
Male Ref. Ref. Ref. Ref. Ref.
Female 0.66 [0.60,0.73] 0.64 [0.58,0.70] 0.67 [0.61,0.74] 0.64 [0.58,0.71] 0.63 [0.57,0.70]
White Ref. Ref. Ref. Ref. Ref.
Black 1.24 [1.06,1.44] 1.18 [1.01,1.37] 1.21 [1.03,1.41] 1.22 [1.05,1.43] 1.18 [1.01,1.37] Other 0.82 [0.62,1.10] 0.82 [0.61,1.10] 0.78 [0.58,1.05] 0.82 [0.61,1.10] 0.82 [0.61,1.09] Age at measurement 1.00 [0.80,1.25] 0.99 [0.79,1.24] 1.01 [0.81,1.26] 1.01 [0.81,1.27] 0.99 [0.79,1.24] Age2 1.00 [1.00,1.00] 1.00 [1.00,1.00] 1.00 [1.00,1.00] 1.00 [1.00,1.00] 1.00 [1.00,1.00]
Number of risk factors
0 Ref.
1 1.43 [1.24,1.66]
2 1.70 [1.45,1.98]
3 2.20 [1.80,2.68]
4 3.54 [2.41,5.21]
Risk factors
High ratio of TC to HDL (>5) 1.00 [0.88,1.14]
High hbA1c (≥6.4%) 1.58 [1.40,1.78]
High CRP (≥3.0 ug/mL) 1.77 [1.59,1.96] High risk systolic BP (>139) 1.00 [0.90,1.12]
Continuous biomarkers
Ratio of TC to HDL 1.04 [1.00,1.08]
Blood glycated hemoglobin level 1.18 [1.13,1.23]
Blood CRP level 1.01 [1.01,1.02]
Systolic BP 1.00 [1.00,1.00]
Risk profiles
1 Ref.
2 1.93 [1.55,2.39]
3 1.31 [1.04,1.64]
4 1.76 [1.43,2.18]
5 1.64 [1.24,2.16]
6 1.01 [0.80,1.27]
7 3.10 [2.42,3.96]
8 1.09 [0.87,1.38]
9 0.86 [0.67,1.09]
Risk groups
0000 Ref.
0001 1.15 [0.95,1.40]
0010 1.95 [1.64,2.33]
0011 1.58 [1.27,1.96]
0100 1.48 [1.13,1.95]
0101 1.63 [1.21,2.20]
0110 3.18 [2.42,4.19]
0111 2.68 [2.03,3.55]
1000 1.03 [0.78,1.37]
1001 1.02 [0.72,1.45]
1010 1.82 [1.40,2.37]
1011 1.76 [1.33,2.35]
1100 1.36 [0.88,2.10]
1101 2.07 [1.26,3.37]
1110 2.69 [1.76,4.11]
1111 3.57 [2.43,5.26]
N 14,416 14,416 14,416 14,414 14,416
AUC 0.599 0.615 0.596 0.618 0.617
Table A-2.2: Hazard ratios from Cox-models on all-cause mortality with different
functional forms on their own, total sample
(1) (2) (3) (4) (5)
Male Ref. Ref. Ref. Ref. Ref.
Female 0.65 [0.58,0.72] 0.64 [0.57,0.71] 0.63 [0.56,0.71] 0.64 [0.57,0.71] 0.63 [0.57,0.71]
White Ref. Ref. Ref. Ref. Ref.
Black 1.27 [1.07,1.51] 1.22 [1.03,1.45] 1.20 [1.00,1.42] 1.27 [1.07,1.51] 1.22 [1.02,1.45] Other 0.87 [0.63,1.21] 0.86 [0.62,1.20] 0.85 [0.61,1.17] 0.86 [0.62,1.20] 0.86 [0.62,1.20] Age at measurement 0.97 [0.75,1.25] 0.96 [0.74,1.23] 0.97 [0.75,1.25] 0.98 [0.76,1.27] 0.96 [0.74,1.23] Age2 1.00 [1.00,1.00] 1.00 [1.00,1.00] 1.00 [1.00,1.00] 1.00 [1.00,1.00] 1.00 [1.00,1.00]
Number of risk factors
0 Ref.
1 1.32 [1.14,1.53]
2 1.45 [1.23,1.72]
3 1.93 [1.55,2.40]
4 2.84 [1.79,4.50]
Risk factors
High ratio of TC to HDL (>5) 0.96 [0.83,1.11]
High hbA1c (≥6.4%) 1.56 [1.36,1.78]
High CRP (≥3.0 ug/mL) 1.53 [1.36,1.73] High risk systolic BP (>139) 1.03 [0.91,1.16]
Continuous biomarkers
Ratio of TC to HDL 1.00 [0.95,1.05]
Blood glycated hemoglobin level 1.18 [1.13,1.24]
Blood CRP level 1.11 [1.08,1.14]
Systolic BP 1.00 [1.00,1.00]
Risk profiles
1 Ref.
2 1.70 [1.34,2.15]
3 1.28 [1.00,1.64]
4 1.49 [1.18,1.88]
5 1.42 [1.05,1.93]
6 1.02 [0.81,1.30]
7 2.93 [2.21,3.89]
8 1.09 [0.85,1.38]
9 0.87 [0.68,1.11]
Risk groups
0000 Ref.
0001 1.15 [0.95,1.40]
0010 1.72 [1.42,2.08]
0011 1.31 [1.02,1.69]
0100 1.43 [1.07,1.90]
0101 1.61 [1.19,2.19]
0110 2.78 [1.99,3.89]
0111 2.64 [1.91,3.64]
1000 1.04 [0.78,1.38]
1001 0.97 [0.69,1.37]
1010 1.52 [1.09,2.10]
1011 1.49 [1.07,2.07]
1100 1.32 [0.84,2.06]
1101 2.06 [1.26,3.39]
1110 2.04 [1.16,3.58]
1111 2.86 [1.80,4.54]
N 12607 12607 12607 12605 12607
AUC 0.596 0.603 0.611 0.606 0.605
Table A-2.3: Hazard ratios from Cox-models on all-cause mortality with different
functional forms on their own, men 50–69
(1) (2) (3) (4) (5)
Male Ref. Ref. Ref. Ref. Ref.
Female
White Ref. Ref. Ref. Ref. Ref.
Black 1.41 [0.96,2.05] 1.32 [0.91,1.94] 1.49 [1.03,2.15] 1.47 [1.01,2.13] 1.31 [0.89,1.94] Other 0.87 [0.47,1.58] 0.89 [0.49,1.61] 0.92 [0.50,1.69] 0.91 [0.49,1.67] 0.88 [0.49,1.60] Age at measurement 0.50 [0.16,1.58] 0.50 [0.16,1.59] 0.50 [0.16,1.62] 0.53 [0.17,1.66] 0.52 [0.16,1.65] Age2 1.01 [1.00,1.02] 1.01 [1.00,1.02] 1.01 [1.00,1.02] 1.01 [1.00,1.01] 1.01 [1.00,1.01]
Number of risk factors
0 Ref.
1 1.96 [1.32,2.91]
2 2.34 [1.53,3.58]
3 2.82 [1.69,4.71]
4 3.26 [0.85,12.53]
Risk factors
High ratio of TC to HDL (>5) 0.91 [0.66,1.25]
High hbA1c (≥6.4%) 1.56 [1.14,2.14]
High CRP (≥3.0 ug/mL) 2.13 [1.60,2.83] High risk systolic BP (>139) 1.12 [0.84,1.51]
Continuous biomarkers
Ratio of TC to HDL 1.06 [0.97,1.16]
Blood glycated hemoglobin level 1.10 [1.00,1.20]
Blood CRP level 1.04 [1.03,1.05]
Systolic BP 1.00 [1.00,1.01]
Risk profiles
1 Ref.
2 3.19 [1.63,6.22]
3 2.35 [1.12,4.93]
4 2.94 [1.48,5.81]
5 2.33 [1.14,4.76]
6 1.66 [0.83,3.32]
7 3.22 [1.58,6.56]
8 1.10 [0.50,2.42]
9 0.99 [0.46,2.14]
Risk groups
0000 Ref.
0001 1.78 [1.09,2.93]
0010 2.92 [1.80,4.72]
0011 2.51 [1.43,4.40]
0100 1.94 [0.94,3.98]
0101 2.33 [0.97,5.58]
0110 5.10 [2.55,10.21]
0111 2.84 [1.20,6.70]
1000 1.18 [0.60,2.32]
1001 0.85 [0.29,2.52]
1010 2.71 [1.42,5.17]
1011 2.23 [1.02,4.88]
1100 1.17 [0.38,3.62]
1101 3.96 [1.69,9.26]
1110 3.13 [1.03,9.48]
1111 3.27 [0.85,12.54]
N 3627 3627 3627 3626 3627
AUC 0.587 0.612 0.596 0.615 0.622
Table A-2.4: Hazard ratios from Cox-models on all-cause mortality with different
functional forms on their own, men 50–69
(1) (2) (3) (4) (5)
Male Ref. Ref. Ref. Ref. Ref.
Female
White Ref. Ref. Ref. Ref. Ref.
Black 1.26 [0.82,1.95] 1.20 [0.77,1.86] 1.22 [0.79,1.88] 1.36 [0.88,2.08] 1.17 [0.75,1.84] Other 1.01 [0.54,1.90] 1.01 [0.55,1.88] 1.03 [0.54,1.94] 1.03 [0.54,1.96] 1.01 [0.54,1.87] Age at measurement 0.57 [0.16,1.99] 0.57 [0.16,1.99] 0.54 [0.15,1.92] 0.60 [0.17,2.09] 0.57 [0.16,2.03] Age2 1.00 [0.99,1.01] 1.00 [0.99,1.01] 1.01 [0.99,1.02] 1.00 [0.99,1.01] 1.00 [0.99,1.01]
Number of risk factors
0 Ref.
1 1.93 [1.27,2.95]
2 1.75 [1.08,2.83]
3 2.92 [1.66,5.14]
4 2.90 [0.66,12.78]
Risk factors
High ratio of TC to HDL (>5) 0.89 [0.61,1.29]
High hbA1c (≥6.4%) 1.51 [1.06,2.16]
High CRP (≥3.0 ug/mL) 1.75 [1.26,2.43] High risk systolic BP (>139) 1.31 [0.95,1.81]
Continuous biomarkers
Ratio of TC to HDL 1.03 [0.93,1.15]
Blood glycated hemoglobin level 1.06 [0.96,1.18]
Blood CRP level 1.18 [1.11,1.25]
Systolic BP 1.01 [1.00,1.02]
Risk profiles
1 Ref.
2 3.01 [1.47,6.15]
3 2.42 [1.15,5.07]
4 2.17 [1.00,4.69]
5 1.96 [0.90,4.24]
6 1.63 [0.82,3.25]
7 2.32 [1.04,5.18]
8 1.06 [0.48,2.32]
9 0.99 [0.45,2.16]
Risk groups
0000 Ref.
0001 1.97 [1.19,3.27]
0010 2.69 [1.56,4.64]
0011 1.93 [0.97,3.85]
0100 2.00 [0.98,4.09]
0101 2.45 [0.99,6.04]
0110 3.75 [1.47,9.57]
0111 2.62 [0.99,6.95]
1000 1.20 [0.58,2.50]
1001 0.79 [0.26,2.40]
1010 1.83 [0.78,4.26]
1011 2.81 [1.22,6.47]
1100 1.06 [0.34,3.27]
1101 4.10 [1.78,9.47]
1110 1.88 [0.27,13.03]
1111 2.93 [0.66,12.95]
N 3627 3627 3627 3626 3627
AUC 0.584 0.594 0.607 0.599 0.602
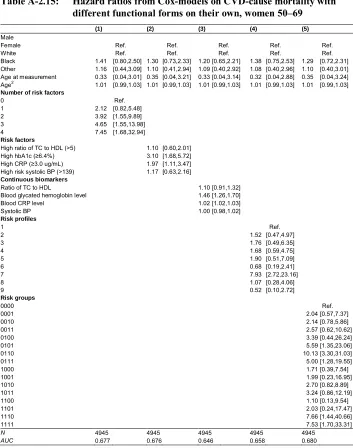
Table A-2.5: Hazard ratios from Cox-models on all-cause mortality with different
functional forms on their own, women 50–69
(1) (2) (3) (4) (5)
Male
Female Ref. Ref. Ref. Ref. Ref.
White Ref. Ref. Ref. Ref. Ref.
Black 1.36 [0.96,1.93] 1.28 [0.90,1.82] 1.31 [0.91,1.88] 1.39 [0.97,1.99] 1.27 [0.89,1.81] Other 0.70 [0.37,1.30] 0.68 [0.36,1.29] 0.70 [0.37,1.32] 0.71 [0.37,1.34] 0.69 [0.36,1.31] Age at measurement 0.79 [0.25,2.56] 0.82 [0.25,2.66] 0.87 [0.27,2.86] 0.77 [0.24,2.49] 0.84 [0.26,2.71] Age2 1.00 [0.99,1.01] 1.00 [0.99,1.01] 1.00 [0.99,1.01] 1.00 [0.99,1.01] 1.00 [0.99,1.01]
Number of risk factors
0 Ref.
1 1.77 [1.12,2.80]
2 2.97 [1.86,4.75]
3 3.42 [1.85,6.34]
4 7.10 [3.26,15.50]
Risk factors
High ratio of TC to HDL (>5) 1.06 [0.73,1.53]
High hbA1c (≥6.4%) 2.33 [1.67,3.26]
High CRP (≥3.0 ug/mL) 2.18 [1.59,2.98] High risk systolic BP (>139) 1.11 [0.79,1.56]
Continuous biomarkers
Ratio of TC to HDL 1.10 [0.96,1.25]
Blood glycated hemoglobin level 1.29 [1.16,1.43]
Blood CRP level 1.02 [1.02,1.03]
Systolic BP 1.00 [0.99,1.01]
Risk profiles
1 Ref.
2 1.46 [0.74,2.89]
3 1.55 [0.67,3.59]
4 1.59 [0.89,2.82]
5 1.73 [0.76,3.94]
6 0.56 [0.25,1.25]
7 4.43 [2.36,8.30]
8 0.88 [0.42,1.83]
9 0.57 [0.25,1.29]
Risk groups
0000 Ref.
0001 1.44 [0.68,3.06]
0010 2.14 [1.31,3.49]
0011 2.25 [1.14,4.44]
0100 2.03 [0.68,6.06]
0101 4.15 [1.78,9.67]
0110 5.79 [3.08,10.90]
0111 4.48 [1.94,10.34]
1000 1.03 [0.44,2.42]
1001 1.08 [0.13,9.26]
1010 2.76 [1.49,5.12]
1011 1.92 [0.66,5.56]
1100 0.33 [0.04,2.52]
1101 1.39 [0.26,7.40]
1110 5.80 [2.44,13.80]
1111 7.15 [3.28,15.59]
N 4945 4945 4945 4945 4945
AUC 0.641 0.657 0.617 0.640 0.664
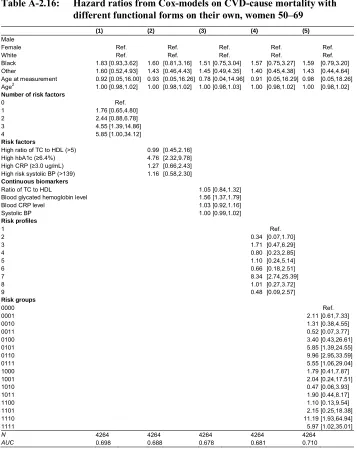
Table A-2.6: Hazard ratios from Cox-models on all-cause mortality with different
functional forms on their own, women 50–69
(1) (2) (3) (4) (5)
Male
Female Ref. Ref. Ref. Ref. Ref.
White Ref. Ref. Ref. Ref. Ref.
Black 1.55 [1.02,2.36] 1.43 [0.93,2.19] 1.42 [0.92,2.20] 1.49 [0.97,2.31] 1.41 [0.91,2.17] Other 0.82 [0.39,1.72] 0.80 [0.38,1.70] 0.81 [0.39,1.71] 0.80 [0.37,1.70] 0.81 [0.37,1.73] Age at measurement 0.87 [0.21,3.59] 0.84 [0.20,3.48] 0.81 [0.19,3.35] 0.84 [0.20,3.45] 0.86 [0.20,3.58] Age2 1.00 [0.99,1.01] 1.00 [0.99,1.01] 1.00 [0.99,1.01] 1.00 [0.99,1.01] 1.00 [0.99,1.01]
Number of risk factors
0 Ref.
1 1.47 [0.90,2.38]
2 2.17 [1.29,3.64]
3 2.71 [1.32,5.57]
4 3.71 [1.16,11.86]
Risk factors
High ratio of TC to HDL (>5) 0.85 [0.51,1.39]
High hbA1c (≥6.4%) 2.44 [1.61,3.69]
High CRP (≥3.0 ug/mL) 1.66 [1.16,2.37] High risk systolic BP (>139) 1.21 [0.81,1.81]
Continuous biomarkers
Ratio of TC to HDL 0.98 [0.83,1.17]
Blood glycated hemoglobin level 1.31 [1.16,1.47]
Blood CRP level 1.11 [1.04,1.19]
Systolic BP 1.00 [0.99,1.01]
Risk profiles
1 Ref.
2 1.03 [0.47,2.27]
3 1.46 [0.59,3.61]
4 1.05 [0.55,1.99]
5 0.92 [0.31,2.70]
6 0.59 [0.27,1.29]
7 4.01 [1.99,8.09]
8 0.85 [0.40,1.77]
9 0.55 [0.24,1.29]
Risk groups
0000 Ref.
0001 1.41 [0.68,2.94]
0010 1.62 [0.93,2.84]
0011 1.66 [0.71,3.90]
0100 2.00 [0.66,6.04]
0101 4.04 [1.77,9.22]
0110 5.09 [2.49,10.42]
0111 4.80 [1.86,12.39]
1000 1.04 [0.44,2.46]
1001 1.00 [0.11,9.06]
1010 1.55 [0.66,3.65]
1011 1.57 [0.47,5.18]
1100 0.31 [0.04,2.24]
1101 1.27 [0.27,6.06]
1110 3.84 [0.90,16.43]
1111 3.77 [1.18,12.05]
N 4264 4264 4264 4264 4264
AUC 0.625 0.638 0.631 0.616 0.638
Table A-2.7: Hazard ratios from Cox-models on all-cause mortality with different
functional forms on their own, men 70–89
(1) (2) (3) (4) (5)
Male Ref. Ref. Ref. Ref. Ref.
Female
White Ref. Ref. Ref. Ref. Ref.
Black 1.13 [0.88,1.45] 1.07 [0.83,1.37] 1.11 [0.86,1.43] 1.10 [0.85,1.42] 1.07 [0.83,1.38] Other 0.84 [0.49,1.43] 0.83 [0.49,1.41] 0.78 [0.46,1.34] 0.84 [0.49,1.43] 0.83 [0.49,1.40] Age at measurement 0.96 [0.47,1.96] 0.91 [0.44,1.86] 1.02 [0.50,2.10] 0.94 [0.46,1.93] 0.90 [0.44,1.85] Age2 1.00 [1.00,1.00] 1.00 [1.00,1.01] 1.00 [1.00,1.00] 1.00 [1.00,1.00] 1.00 [1.00,1.01]
Number of risk factors
0 Ref.
1 1.28 [1.03,1.60]
2 1.36 [1.08,1.71]
3 1.82 [1.36,2.44]
4 1.91 [0.90,4.04]
Risk factors
High ratio of TC to HDL (>5) 0.87 [0.70,1.07]
High hbA1c (≥6.4%) 1.26 [1.05,1.52]
High CRP (≥3.0 ug/mL) 1.83 [1.56,2.15] High risk systolic BP (>139) 0.91 [0.78,1.07]
Continuous biomarkers
Ratio of TC to HDL 0.97 [0.90,1.04]
Blood glycated hemoglobin level 1.13 [1.05,1.22]
Blood CRP level 1.01 [1.00,1.01]
Systolic BP 1.00 [0.99,1.00]
Risk profiles
1 Ref.
2 1.96 [1.44,2.67]
3 1.04 [0.73,1.50]
4 1.60 [1.15,2.23]
5 1.40 [0.92,2.15]
6 0.85 [0.60,1.21]
7 2.44 [1.62,3.65]
8 1.21 [0.85,1.71]
9 0.87 [0.60,1.26]
Risk groups
0000 Ref.
0001 0.97 [0.74,1.28]
0010 1.97 [1.51,2.57]
0011 1.46 [1.08,1.99]
0100 1.20 [0.79,1.83]
0101 1.12 [0.73,1.72]
0110 2.37 [1.57,3.57]
0111 2.70 [1.84,3.97]
1000 0.98 [0.64,1.51]
1001 0.88 [0.54,1.43]
1010 1.45 [0.94,2.22]
1011 1.60 [1.05,2.45]
1100 1.10 [0.54,2.26]
1101 0.51 [0.13,2.04]
1110 1.86 [0.89,3.89]
1111 1.91 [0.90,4.05]
N 2506 2506 2506 2505 2506
AUC 0.552 0.601 0.548 0.604 0.595