Vol. 5, No. 4, 2013 Article ID IJIM-00351, 6 pages Research Article
Ranking Network-Structured Decision-Making Units and Its
Application in Bank Branches
M. Shahriari ∗†
————————————————————————————————–
Abstract
Data envelopment analysis (DEA) is a method used for measuring the efficiency of decision-making units. Unlike the standard models, which assume decision-making units to be a black box, network data envelopment analysis focuses on the internal structure of these units. Some researchers have developed a two-stage method where all the inputs are entirely used in the first stage, producing outputs which are subsequently fed as inputs to the second stage. These indices are introduced as intermediate indices. Here, it is assumed that congruent decision-making units have a two-stage serial structure. In this structure, the first stage and second stages act as the supplier and the consumer of resources respectively. Two ranking models based on the efficiency cloud and the common set of weights concepts were developed for ranking network-structured decision-making units. In the practical example presented in this study, 25 bank branches were ranked using the two-stage method.
Keywords: Data Envelopment Analysis (DEA); Two-stage; Ranking.
—————————————————————————————————–
1
Introduction
T
hmerous developments in recent years.e science of management has experienced nu-For this reason, every organization is in dire need of an assessment system since, in the absence of such a system, the organization can neither grow nor survive. Achieving this goal calls for identifica-tion and management of internal and external factors of organizations. In most organizations, the following factors are considered to affect this strategy: customer satisfaction, technology, hu-man force, long- and short-term policies, costs,∗Corresponding author. [email protected]
†Faculty of Management, UAE branch, Islamic Azad University, Dubai, UAE.
benefits, etc. As a result of these factors, organi-zations aim for long-term profitability. Customer satisfaction is the managements most important concern in any organization. Every organization needs performance assessment to become aware of the utility of its activities in todays vague and am-biguous environments. Performance assessment is always one of the important duties of managers. Hence, managers should acquire the knowledge of measurement. If we cannot measure something, we cannot control and manage it. Similar to any other organization, banks need to improve their efficiency to survive. They try to provide desir-able services through optimal use of their avail-able facilities so as to satisfy the customers con-sistently and ensure adequate profitability. As
providers of public services, banks must be as-sessed properly, or they will pose serious risks to society. Today, although banks endeavor to im-prove their performance, they do not have access to an inclusive assessment system for assessing the performance of their branches [2]. Hence, we have to use mathematical methods to assess the performance of banks.
The science of Data Envelopment Analysis [1] is one of the sub-branches of linear programming, focusing on the performance assessment of units. The objective of this subsidiary branch is to as-sess the performance of decision-making units with congener inputs and outputs. DEA is a pow-erful instrument with significantly increasing ap-plications, developed for performance assessment of multi-input and multi-output systems. Unit performance can be used as a criterion for rank-ing units. In other words, a decision-makrank-ing unit has a higher rank if it has a higher relative ef-ficiency. However, a problem arises when there are decision-making units with equal relative ef-ficiencies. This problem relates to the ranking of the equally efficient units. For this reason, to rank such units, a new technique in addition to the relative efficiency calculation models is re-quired. Ranking efficient units, i.e. units with equal efficiency scores of one, is one of the impor-tant issues in DEA. Numerous articles on rank-ing of decision-makrank-ing units have been published. One of the most important concepts proposed in these articles was the efficiency cloud [3, 4]. The model proposed by Anderson and Petersen (1993) for ranking efficient units is known as the AP model. In this method, the decision-making unit (DM Up) in question is deleted from the ob-servations set and a new production possibility set is created. Although the AP model is among the most well-known efficiency cloud models for ranking units, it has many defects. Hence, many other models have been proposed to resolve the defects of this model.
Another way of solving the above problem is us-ing models based on a common set of weights. In this method, all the decision-making units are as-sessed using a set of optimum weights. Since most of the DEA models use a multi-objective
struc-ture to calculate the common set of weights, they are theoretically strong. The model proposed by Charnes et al. (1989) and Korenbluth (1991) is among the very first common set of weights mod-els proposed in DEA. [6,10,11]
Multi-stage DEA, also known as the network DEA, measures efficiency and evaluates different phases of a multi-stage production process [8,9]. In this research, 25 bank branches were analyzed with a two-stage structure. In general, it could be stated that, at the outset, all the inputs are con-sumed in stage 1, and the outputs of this phase, namely, the intermediate values, are produced. Only these intermediate values are used as the input to the second stage. Various models with constant return to scale have been developed for the network structure. In the majority of these models, efficiency is calculated based on the rele-vant units and components. The link between ef-ficiency of components and efef-ficiency of all units is consistently considered in such models. More-over, establishing such a link has been one of the reasons for development of such models.[12] This paper is presented in the following sec-tions: Section 2 presents a brief review of net-work DEA. Next, DEA ranking models with a two-stage structure are presented in a multiple form. A practical two-stage example aimed at ranking 25 commercial bank branches with 5 in-dices is introduced in Section 3. The fourth sec-tion analyzes the results of the practical example, and the paper closes with the conclusion.
2
Ranking Two-Stage
Decision-Making Units
Assume n decision-making units (DM Us), (Xj, Yj)j = 1,2, , n,with the following input and output vectors:
Xj ̸= 0, Xj ≥0, Xj ∈Rm (inputvector)
Yj ̸= 0, Yj ≥0, Yj ∈Rs (outputvector)
intermediate products of each DM U. In other words, Zj,(j = 1, ..., n) refers to the outputs of stage 1 and inputs of stage 2.
The CCR model, which was developed by Charnes, Cooper and Rhodes (1978) for deter-mining the nature of the input forDM Up assess-ment, is as follows [5].
To assess n DMUs, Model (2.1) is solved n times. Since in Model (2.1) weights are highly flexible in efficiency calculations, if this model considers a unit inefficient, then that unit is definitely ineffi-cient. The following the serial two-stage structure was assumed for DM Us. Therefore, efficiency of
Figure 1
DM Up is calculated as follows.
max z=
s ∑ r=1 uryrp s.t. s ∑ r=1 uryrj− D ∑ d=1
wdzdj ≤0, j= 1, ..., n,
D ∑
d=1
wdzdj − m ∑
i=1
vixij ≤0, j= 1, ..., n,
m ∑
i=1
vixip= 1,
(2.1)
ur, vi, wd≥ε, r= 1, ..., s, i= 1, ..., m, d= 1, ..., D
Model (2.2) is the expanded version of Model (2.1). In this model, it is possible to calculate stage 1 and stage 2 efficiencies in addition to the overall efficiency of the system using opti-mum weights in DM Up assessment. Since the
standard DEA models are highly optimistic (i.e. they incorporate best weights in the assessment of DM Up(p= 1, , n)), in most assessments more than one DMU is introduced as the efficient unit. One of the ways of solving this problem is ranking DMUs. Since the DMUs in this research have a two-stage structure, Model (2.3), which is based on the AP model, was proposed for ranking two-stage units.
max z=
s ∑ r=1 uryrp s ∑ r=1
uryrj − D ∑
d=1
wdzdj ≤0, j= 1, ..., n, j̸=p
D ∑
d=1
wdzdj− m ∑
i=1
vixij ≤0, j = 1, ..., n, j ̸=p
m ∑
i=1
vixip= 1,
(2.2)
ur, vi, wd≥ε, r= 1, ..., s, i= 1, ..., m, d= 1, ..., D
The ranking scale for stages one and 2 and the overall system is obtained via the following rela-tions.
RankStage1 = ∑D
d=1wdzdp ∑m
i=1vixip
,
RankStage2 = ∑s
r=1uryrp
∑D
d=1wdzdp
, (2.3)
RankOveral= ∑s
r=1uryrp ∑m
i=1vixip
,
Where, ∑s
r=1uryrp ∑m
i=1vixip
= ∑D
d=1wdzdp ∑m
i=1vixip
×
∑s
r=1uryrp ∑D
d=1wdzdp (2.4)
the common set of weights was based on multi-objective programming notions.
In data envelopment analysis, the objective of each decision-making unit is to obtain the effi-ciency of 1. In other words,
∑s
r=1uryrj
∑m i=1vixij
= 1, j= 1, ..., n,
(2.5)
Hence, relation (2.7) can be written as:
gj = m ∑
i=1
vixij− s ∑
r=1
uryrj = 0, j= 1, ..., n,
(2.6)
That is to say, the aim of each gj(j = 1, ..., n) is to reach zero [7]. The n-objective problem for assessment of network-structured DM Us is ex-pressed as:
min W =|(g1, ..., gn−(0, ...,0)|q
s.t. s ∑
r=1
uryrj− D ∑
d=1
wdzdj ≤0, j = 1, ..., n,
D ∑
d=1
wdzdj− m ∑
i=1
vixij ≤0, j = 1, ..., n,
(2.7)
ur, vi, wd≥ε, r= 1, ..., s, i= 1, ..., m, d= 1, ..., D
To solve the above problem, we can use differ-ent norms (q = 1,2, ...,∞) such as the infinity
norm.
min W =θ
s.t. s ∑
r=1
uryrj − D ∑
d=1
wdzdj ≤0, j= 1, ..., n,
D ∑
d=1
wdzdj− m ∑
i=1
vixij ≤0, j = 1, ..., n,
m ∑
i=1
vixij − s ∑
r=1
uryrj ≤θ, j = 1, ..., n,
(2.8)
(2.9)
ur, vi, wd≥ε, r= 1, ..., s, i= 1, ..., m, d= 1, ..., D,
Unlike many of the common set of weights models which are nonlinear, the above model is linear.
3
Practical Example
In this research, 25 branches of an Iranian com-mercial bank were assessed. Table (2.1) presents the inputs (X), intermediate products (Z), and outputs (Y). The obtained data belong to 2011.
Figure 2
Models (2.3) and (12) were selected for ranking the first stage (resource collection), the second stage (resource allocation and profitability), and the entire unit.
4
Results Analysis
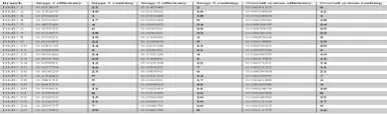
Table 2: Results of ranking bank branches with Model (2.3)
branch is inefficient and is the best branch among the inefficient branches. In the first stage, branch no. 13 is the worst branch because it has the lowest rank. In view of stage 2 rankings, branch no. 13 has the highest rank and is also efficient. Ranks 2 and 3 belong to branches no. 12 and 8 respectively. Considering the efficiency values obtained in stage 2, branch no. 12 is the best inef-ficient branch, whereas branch no. 6 is the worst inefficient branch because it has the 25th rank. These results suggest that branches 19 and 13 are the best and worst resource suppliers respec-tively. In addition, branches no. 13 and 6 are the best and worst resource consumers respectively. As seen, branch no. 13 has the lowest efficiency in stage 1, and shows the highest efficiency in stage 2. The sixth column in Table (2) indicates that relation (2.5) can be applied to each one of the DMUs. In the overall system ranking, branch no. 3 has the highest rank and branch no. 6 has the lowest rank. The average efficiencies of stages one and 2 are 0.256 and 0.222 respectively. These
values show that the overall efficiency of these 25 branches is weaker in the second stage as com-pared to the first stage.
Table (3) presents the ranks of bank branches obtained with the common set of weights model (2.9). These results were obtained using GAMS. According to Table (3), branches no. 3, 11, and
Table 3: Results of ranking bank branches with Model (2.9)
19 have the top three ranks in the first stage. On account of the efficiency values obtained in the second stage, branches no. 13, 1, and 8 have the top three ranks. These results indicate that branches no. 3 and 13 are the best and worst re-source suppliers respectively. Moreover, branches no. 13 and 6 are the best and worst resource consumers respectively. As seen, branch no. 13 has the lowest efficiency in the first stage and the highest efficiency in the second stage. In the over-all system ranking, branch no. 3 has the high-est rank and branch no. 6 has the lowhigh-est rank. The average efficiencies of stages one and 2 are 0.210 and 0.043 respectively. Hence, the over-all performance of these 25 branches is consider-ably weaker in the second stage as compared to the first stage. Moreover, the efficiency results obtained from both of these models are almost equal.
5
Conclusion
branches no. 19, 13, and 3 had the highest ranks in the first stage, second stage, and overall sys-tem stage respectively. In the second proposed model, branches no. 3, 13, and 3 had the highest ranks in the first stage, second stage, and overall system stage respectively. As seen, the ranking results obtained from the two models are simi-lar. That is to say, the ranks of some branches are completely equal while there is a slight dif-ference between the ranks of other branches. In general, it could be concluded that the supplier section had a better performance than the con-sumers section.
References
[1] Gh. Jahanshaghlou, F. Husseinzadeh Lotfi, H. Nikoomaram, Data envelopment analysis and its applications, Islamic Azad University, Sci-ence and Research Branch, (2008).
[2] M. Mehregan, Quantitative models for or-ganizational performance assessment, Tehran University, (2004).
[3] N. Adler, L. Friedman, Z. Sinuanny-Stern,
Review of ranking methods in the data envel-opment analysis, European journal of opera-tional research 140 (2002) 249-265.
[4] P. Anderson, N. C. Peterson, A procedure for ranking efficient units in data envel-opment analysis, Managemente science 39 (1993) 1261-1264.
[5] A. Charnes, W. W. Cooper, E. Rhodes, Mea-suring the efficiency of decision making units, European Journal of Operational Research 2 (1978) 429444.
[6] A. Charens, W. W. Cooper, Q. L Wei, Z. M. Huang, Cone ratio data envelopment analy-sis and multi objective programming, Int. J. System Sci. 20 (1989) 1099-1118.
[7] Y. W. Chen, M. Larbani, Y. P. Chang, Multi-objective data envelopment analysis, Journal of Operations Research Society 60 (2009) 1556-1566.
[8] G. R. Jahanshahloo, F. Hosseinzadeh Lotfi, M. Khanmohammadi, M. Kazemimanesh, V. Rezaie, Ranking of units by positive ideal DMU with common weights, Expert Systems with Applications 37 (2010) 7483-7488.
[9] F. Hosseinzadeh Lotfi, N. Nematollahi, M. H. Behzadi, M. Mirbolouki,Ranking Decision Making Units with stochastic data by using co-efficient of variation, Mathematical and Com-putational Applications 15 (2010) 148-155.
[10] G. R. Jahanshahloo, F. Hosseinzadeh Lotfi, V. Rezaie, M. Khanmohammadi, Ranking DMUs by ideal points with interval data in DEA, Applied Mathematical Modelling 35 (2011) 218-229.
[11] F. Hosseinzadeh Lotfi, R. Fallahnejad, N. Navidi, Ranking Efficient Units in DEA by Using TOPSIS Method, Applied Mathemati-cal Sciences 5 (2011) 805 815.
[12] F. Hosseinzadeh Lotfi, R. Fallahnejad, A Method For Ranking All Efficient DMUs In, Journal of Sciences 20 (2011) 101-108.