The Thirty-Third AAAI Conference on Artificial Intelligence (AAAI-19)
Embedding-Based Complex Feature Value Coupling
Learning for Detecting Outliers in Non-IID Categorical Data
Hongzuo Xu, Yongjun Wang, Zhiyue Wu,
†Yijie Wang
†∗ †Science and Technology on Parallel and Distributed Processing LaboratoryCollege of Computer, National University of Defense Technology, China {xuhongzuo13,wangyongjun,wangyijie}@nudt.edu.cn, [email protected]
Abstract
Non-IID categorical data is ubiquitous and common in real-world applications. Learning various kinds of couplings has been proved to be a reliable measure when detecting outliers in such non-IID data. However, it is a critical yet challenging problem to model, represent, and utilise high-order complex value couplings. Existing outlier detection methods normally only focus on pairwise primary value couplings and fail to uncover real relations that hide in complex couplings, result-ing in suboptimal and unstable performance. This paper intro-duces a novel unsupervised embedding-based complex value coupling learning framework EMAC and its instance SCAN to address these issues. SCAN first models primary value couplings. Then, coupling bias is defined to capture com-plex value couplings with different granularities and highlight the essence of outliers. An embedding method is performed on the value network constructed via biased value couplings, which further learns high-order complex value couplings and embeds these couplings into a value representation matrix. Bidirectional selective value coupling learning is proposed to show how to estimate value and object outlierness through value couplings. Substantial experiments show that SCAN (i) significantly outperforms five state-of-the-art outlier de-tection methods on thirteen real-world datasets; and (ii) has much better resilience to noise than its competitors.
Introduction
Outlier detection is the process of identifying rare and ex-ceptional data objects that are dramatically different from the majority of data objects, which is important in many ap-plications including intrusion detection, medical diagnose, and fraud detection. Non-independent and identically dis-tributed (Non-IID) categorical data is ubiquitous and com-mon in these real-world applications. However, it is still a challenging problem to detect outliers in such non-IID data with complex interactions and unavoidable noise.
Non-IID data poses following two major challenges: (i) Diversified frequency distributions across different features mean frequencies may have varying semantics. (ii) The so-phisticatedcouplings(Cao, Ou, and Yu 2012) (i.e., different types and hierarchies of interactions) cannot be abstracted or
∗
Corresponding author.
Copyright c2019, Association for the Advancement of Artificial Intelligence (www.aaai.org). All rights reserved.
weakened to the extent of satisfying the IIDness assumption of the most of the existing algorithms (Cao 2014).
In non-IID data, data objects and object features are not independent and identically distributed but coupled and per-sonalised (Cao 2014). For example, in the task of detecting cancer patients given various of physical signs as features, cancer is related to multiple abnormal symptoms, such as persistent lumps, unexpected weight loss, and night sweats, which means the object features in real-world data are nor-mally dependent or even exist relationships that are beyond dependency relation. On the other hand, different data ob-jects have their own characteristics and personalities in real-world data, and the assumption that all the objects are iden-tically distributed is often violated.
Besides the non-IIDness, another key complexity is the unavoidable noise in real-world data. Specifically, a dataset is often a mixture of relevant features and noisy features (i.e., features in which outliers behave normally while some normal objects are abnormal). These noisy features greatly blur the distinction between outliers and inliers. However, identification of these noisy features is non-trivial in cate-gorical data since a feature may contain not only relevant values (i.e., values that can well indicate outliers) but also infrequent noisy values (i.e., values that randomly occur in normal objects).
Most of the early attempts for outlier detection in categor-ical data is based on the IIDness assumption, e.g., pattern-based methods like (He et al. 2005; Aggarwal and Yu 2005; Das, Schneider, and Neill 2008). Note that features in non-IID data have diversified frequency distributions. The gen-erated patterns in these pattern-based methods are derived from different feature combinations, and thus the semantic and importance of pattern frequency differ significantly for different patterns (Pang, Cao, and Chen 2016). In addition, these methods are easily misled by noisy/irrelevant features because they are normally based on full space.
and reliable measure to distinguish relevant values and noisy values (Xu et al. 2018a). Nevertheless, these methods only successfully model pairwise primary value couplings and fail to uncover real relations that hide in high-order com-plex couplings. Therefore, they may perform ineffectively in complex non-IID data. It is still an extraordinarily chal-lenging problem to model, represent, and utilise high-order complex couplings.
This paper also focuses on the coupling learning to han-dle non-IID categorical data. Non-IID data is often embed-ded with complex relationships (Zhou, Sun, and Li 2009; Cao 2014). Especially in the scenario of outlier detection, outliers often demonstrates outlierness through multiple be-haviours (feature values), and thus these outlying bebe-haviours are not independent but tend to be concurrent (Pang et al. 2017a; Xu et al. 2018a). Mining these homophily outlying-to-outlying value couplings is significant to discover out-liers. However, real relations sometimes can only be discov-ered via high-order complex couplings. Note that we choose to investigate the most fine-grained value couplings rather than the couplings between data objects or features. It is be-cause high-level couplings (couplings between objects and features) can be regarded as the integration of value cou-plings. In this paper, we wield an embedding method to learn and embed high-order complex value couplings into a value representation matrix. The challenging problem is how to drive the embedding method on categorical data, and mean-while consider the essence of outliers. We construct a biased value coupling-based value network and employ a network embedding method to tackle this problem. Different kinds of relationships of the values in the network, which are origi-nally represented by edges, structure characteristics, or other high-order topological measures of network, can be captured and encoded in the embedding vectors.
Based on the above basic concepts, a novel unsupervised Embedding-based coMplex vAlue Coupling learning frame-work (EMAC for short) is proposed for detecting outliers in non-IID categorical data. We use the EMAC framework to illustrate our insight of using embedding method to learn high-order complex value couplings. The specific imple-mentation for each component of the framework can be re-placed by different techniques.
EMAC framework is further instantiated to a method that learns complex value couplings by employing an ex-tended Skip-gram architecture (i.e.,node2vec (Grover and Leskovec 2016)) on a biased value Coupling-based vAlue Network (SCAN for short). SCAN is a specific implementa-tion of EMAC framework. Specifically, SCAN models pri-mary direct value couplings via Ochiai coefficient and con-ditional probability, and obtains indirect value couplings by employing cosine similarity. Value coupling bias is defined to capture value couplings with different granularities and take the essence of outliers into consideration.node2vecis performed on the biased value coupling-based value network to obtain the value representation matrix embedded with high-order complex value couplings. After getting reliable value couplings, we further propose value subspace-based Bidirectional Selective Value Coupling (BSVC) learning to evaluate value and object outlierness, which can effectively
alleviate the interference from noise.
Accordingly, the main contributions of this paper are:
• We introduce a novel framework EMAC that employs value representation matrix to embed high-order complex value couplings, which provides a reliable insight for out-lier detection in non-IID categorical data.
• EMAC is further instantiated to SCAN. SCAN provides a specific implementation to practically tackle the problem of how to model and represent complex value couplings. In addition, SCAN further introduces how to utilise com-plex value couplings to evaluate outlierness by proposing BSVC learning.
Substantial experiments show that SCAN (i) significantly outperforms five state-of-the-art methods on thirteen real-world datasets; (ii) has better resilience to noise than its competitors; and (iii) performs stably w.r.t. its parameters.
Related Work
Traditional outlier detection algorithms are normally based on IIDness assumption and identify outliers in original data space, e.g., (He et al. 2005; He, Deng, and Xu 2005; Aggarwal and Yu 2005; Das, Schneider, and Neill 2008; Akoglu et al. 2012; Wu and Wang 2013). They may fail to obtain effective performance in widespread real-world non-IID data. In addition, the results of these methods are often considerably biased by noisy/irrelevant features which dis-tort the data by masking outliers as normal objects.
In order to handle noisy data, feature subspace-based methods, e.g., (Lazarevic and Kumar 2005; Keller, M¨uller, and Bohm 2012; Liu, Ting, and Zhou 2012; Sathe and Ag-garwal 2016), are popularly proposed because outliers are usually embedded in locally relevant subspaces (Aggarwal 2017). However, a feature may contain not only relevant val-ues but also noisy valval-ues. Comparing with value subspace-based methods, these coarse-grained methods fail to differ-entiate between relevant values and noisy values of the same feature, i.e., they may omit informative relevant values or mix noisy values when removing or retaining an entire fea-ture (Xu et al. 2018a).
iteratively performs value selection and value scoring at-tempting to jointly optimise these two phases. WOD (Xu et al. 2018b) combines value clustering and weighted value coupling learning to evaluate value outlierness. RHAC (Xu et al. 2018a) introduces hierarchical value couplings. They can avoid the aforementioned disaster for feature subspace-based methods. Nevertheless, these existing coupling-subspace-based methods only model pairwise value couplings and may fail to capture real relations that hide in high-order complex value couplings. Thus, they may obtain suboptimal and un-stable performance when they handle complex non-IID data.
EMAC for Learning Complex Value
Couplings to Detect Outliers
The EMAC framework aims to generate a representation matrix embedded with complex and reliable value couplings for detecting outliers in non-IID categorical data. LetX =
{x1,x2,· · ·,xN} be N data objects described byD
cat-egorical features F = {f1, f2,· · · , fD}.vfx is the feature
value of objectxin featuref. The full set of feature values is the union of the distinct value domains from all the fea-tures, i.e.,V = ∪f∈FVf, where Vf is the value domain of
feature f andVf ∩ Vf0 = ∅,∀f 6= f0. Leth : V → Rr
be the mapping function from values to numerical feature representations that we aim to learn for subsequent object outlierness evaluating. Hereris a parameter specifying the number of dimensions of value representation matrix.
In non-IID categorical data that exhibits abundant interac-tions between data objects, object features, and feature val-ues, exploring couplings is necessary and unavoidable in dif-ferent learning problems (Cao 2014). Especially, in outlier detection task, outliers often behaved abnormally through multiple outlying values, i.e., outlying values are concurrent and have strong interactions rather than independent (Pang et al. 2017a; Xu et al. 2018a). Thus, modeling reliable value relationships can facilitate the detecting of abnormal values. However, real value relationships sometimes can only be re-vealed through high-order complex value couplings.
It is a very challenging task to learn, represent, and utilise complex value couplings. Primary value couplings like con-ditional probability, mutual information, and various kinds of similarity measures can only evaluate pairwise value in-teractions but fail to capture high-order value couplings (e.g., deep transitive relation). Harnessing the power of em-bedding method, we propose EMAC framework to learn and represent high-order complex value couplings through newly generated numerical features for each value.
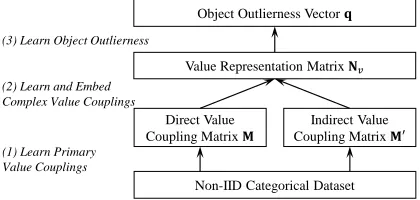
As shown in Figure 1, EMAC framework first learns pri-mary value couplings to construct direct value coupling ma-trix M and indirect value coupling matrix M0. Based on the pairwise primary value couplings, EMAC further em-ploys the embedding method to obtain high-order complex value couplings through the value representation matrixNv.
Distance notions like Euclidean distance can be utilised on the matrixNv. We expect to obtain an effective value
repre-sentation matrixNv that can well separate outlying values
from others. Object outlierness can be subsequently mea-sured based on matrixNv.
We propose EMAC framework to exhibit our insight of embedding high-order complex value couplings into value representation matrix. EMAC demonstrates good general-isability because multiple methods can be utilised to spec-ify its components. EMAC also has potential applications to other machine learning tasks, e.g., data object represen-tation. We introduce an instance of EMAC in the following section and verify its performance by empirical analysis.
(1) Learn Primary Value Couplings
Direct Value Coupling Matrix 𝐌𝐌
Indirect Value Coupling Matrix 𝐌𝐌′
(2) Learn and Embed Complex Value Couplings
Value Representation Matrix 𝐍𝐍𝑣𝑣
Non-IID Categorical Dataset Object Outlierness Vector 𝐪𝐪
(3) Learn Object Outlierness
Figure 1: The EMAC Framework.
An EMAC Instance: SCAN
SCAN instantiates EMAC framework by specifying primary value coupling learning through Ochiai coefficient and con-ditional probability and specifying complex value coupling learning by defining value coupling bias and employing an extended Skip-gram architecture designed for network, i.e., node2vec (Grover and Leskovec 2016). We propose bidi-rectional selective value coupling learning to evaluate value outlierness and further measure object outlierness.
Learning Primary Value Couplings
SCAN learns primary value couplings from two aspects, i.e., direct and indirect couplings. Ochiai coefficient and con-ditional probability are popularly-used methods to measure pairwise direct value couplings in categorical data (Pang et al. 2017b; Xu et al. 2018a; 2018b). Ochiai coefficient-based matrix and conditional probability-based matrixM1,M2∈
R|V|×|V|, are defined as follows.
M1(u, v) =
P(u, v) p
P(u)×P(v), u, v∈ V, (1)
M2(u, v) = P(u, v)
P(u) , u, v∈ V, (2)
where P(v) is the marginal probability of value v, i.e.,
P(v) = |{x ∈ X |vx
f = v}|/N, and P(u, v)is the joint
probability of valueuandv, i.e.,P(u, v) =|{x∈ X |vx
fu =
u∩vx
fv =v}|/N.
On the other hand, indirect value coupling matrixM0 ∈
R|V|×|V|is calculated by the cosine similarity between
con-ditional probability vectors.
M0(u, v) = M2(u,·)·M2(v,·)
kM2(u,·)kkM2(v,·)k, u, v∈ V, (3) whereM2(v,·)denotes row vector of valuevin matrixM2,
Learning Complex Value Couplings
In complex value coupling learning, we first calculate value coupling bias to enhance the capability of SCAN to better focus on outliers. Value coupling bias can enlarge the gap between outlying-to-outlying value couplings and others, which further facilitates complex value coupling learning to capture outlying values. Subsequently, a network embedding method is performed on the value network constructed by biased value couplings to represent each value by a newly generated numerical feature vector.
Value coupling bias is calculated via the integration of value clustering results and initial value outlierness. We use statistic results of clustering to acquire complex value cou-plings with different granularities which can demonstrate different semantics and well reflect the data characteristics. Initial value outlierness is scored through the bidirectional value coupling (BSVC)-based function.
Spectral clustering is performed on matrixM2with
set-ting different cluster number k, i.e., Dk = SC(M2, k),
whereDk ∈R|V|×|V|,Dk(u, v) = 1if valueuandv are
grouped into same cluster, andDk(u, v) = 0if they are
sep-arated. In spectral clustering, we use default RBF kernel to obtain affinity matrix and apply discretisation to assign la-bels. Instead of setting a fixed value of k, we increase k
from initial value2 and stop increasing when appearing a cluster with only one member. Note that the dynamic set-ting of cluster number can capture different granularities of value couplings. MatrixD∈R|V|×|V|is calculated based on the clustering results.
D= 1 kmax−1
kmax X
i=2
Di, (4)
wherekmax is the cluster number when appearing a
one-member cluster. Spectral clustering is chosen since it is effi-cient and is useful in hard non-convex clustering problems.
We first define BSVC-based value outlierness scoring function, and then introduce how to use it to calculate ini-tial value outlierness.
Definition 1 (BSVC-based Value Scoring). BSVC-based value outlierness scoring functionφ(C,So,Sn, α)is defined
to get value outlierness vectorη∈R|V|.
η=φ(C,So,Sn, α) =
1
2α|V|
X
v∈So
C(v,·) +e−X
v∈Sn
C(v,·)
,
(5) whereSoandSnare value subsets containing outlying
val-ues and normal valval-ues with size α|V|, C ∈R|V|×|V| is a value coupling matrix, ande=P|V|
i=1eiis all-ones vector.
In order to get initial value outlierness vectorη0through function φ, we rank values by rough value scoring func-tion δ to obtain value subset Sδ
o and Snδ, i.e, δ(v) = P(m)−P(v)
P(m) , where m is the mode value of the same
fea-ture of v. Symmetric direct value coupling matrix M1 is
employed as input matrix C. α is set as a parameter of SCAN. Thus, initial value outlierness vector is obtained as
η0=φ(M1,Sδ
o,Snδ, α).
After getting clustering statistics matrix and value outlier-ness vector, we generate a non-zero value coupling bias ma-trixB∈R|V|×|V|as follows.
B(u, v) = (1 +η0(u) +η0(v)
2 )×(1 +D(u, v)), u, v∈ V.
(6) SCAN constructs an undirected weighted value network
G =< V, E >to further learn complex value couplings through network embedding. Each node in network is a fea-ture value and edge weight represents the biased value cou-plings. The adjacency matrix of the networkA ∈R|V|×|V|
is defined as follows.
A=M1◦M0◦B, (7)
where◦denotes entrywise product.
Various embedding methods are powerful to represent dif-ferent kinds of data. In this scenario, network embedding can be employed to embed high-order complex value couplings into value representation matrix. Different kinds of relation-ships among the values in networkG, which are originally represented by edges or other high-order topological mea-sures of network, are captured by the distances between val-ues in the newly generated vector space. The topological and structural characteristics of a value can also be encoded into its embedding vector.node2vecis performed on value net-workGto represent each value with ar-dimensional vector, i.e., generate a value representation matrixNv ∈ R|V|×r.
Note thatnode2veceffectively preserves community struc-ture as well as high-order proximity between nodes. Thus, it can yield value couplings between any two different values, i.e., the problem of capturing couplings of values from the same feature can also be addressed.
Evaluating Value and Object Outlierness
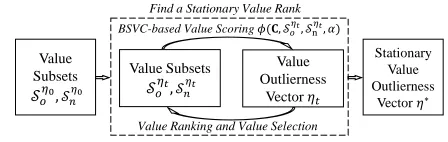
After getting value representation matrix Nv, we propose
Bidirectional Selective Value Coupling (BSVC) learning to evaluate value outlierness, which is shown in Figure 2. Final value outlierness vector η∗ is subsequently used to obtain object outlier scores. BSVC learning iteratively performs BSVC-based value outlierness scoring and ranking-based value selection until finding a stationary value rank, and a stationary value outlierness vector is finally generated.
BSVC-based Value Scoring 𝜙𝜙(𝐂𝐂,𝒮𝒮𝑜𝑜𝜂𝜂𝑡𝑡,𝒮𝒮n𝜂𝜂𝑡𝑡,𝛼𝛼)
Value Subsets 𝒮𝒮𝑜𝑜𝜂𝜂𝑡𝑡,𝒮𝒮𝑛𝑛𝜂𝜂𝑡𝑡
Value Outlierness
Vector 𝜂𝜂𝑡𝑡 Value
Subsets 𝒮𝒮𝑜𝑜𝜂𝜂0,𝒮𝒮𝑛𝑛𝜂𝜂0
Value Ranking and Value Selection
Stationary Value Outlierness
Vector 𝜂𝜂∗
Find a Stationary Value Rank
Figure 2: BSVC Learning to Evaluate Value Outlierness
The input value subsetsSη0
o andSnη0are the topαand
bot-tomαvalues of the value rank sorted by initial value outlier-nessη0. A value similarity matrixMc∈R|V|×|V|calculated
from matrixNv, i.e.,Mc(u, v) =
Nv(u,·)·Nv(v,·)
kNv(u,·)kkNv(v,·)k, u, v∈
Note that BSVC learning is an optimisation of Selective Value Coupling learning framework (SelectVC) proposed in (Pang et al. 2017b). They are different in that: (i) BSVC learning evaluates value outlierness through value couplings from not only outlying values but normal values, while Se-lectVC only considers couplings from outlying values. (ii) BSVC learning stops iteration until the whole value rank is stationary, while SelectVC stops learning when the top-ranked outlying values being not changed. Thus, BSVC learning has fewer iteration times and severer convergence criterion to yield more precise value outlierness estimation.
After evaluating value outlierness, data object outlier score can be calculated through the summation of value out-lierness, i.e.,τ(x) =P
f∈Fη∗(vfx),x∈ X.
The Algorithm of SCAN
Algorithm 1 presents the procedure of SCAN. The input of SCAN is a set of data objectsX, subset size factorα, and representation dimensionalityr. Step 1 learns direct and in-direct primary value couplings. Steps 2-8 are performed to obtain value coupling bias matrixB.node2vecis processed on networkGon Step 10 to generate value representation matrixNv. Final value outlierness vectorη∗and object
out-lierness vectorτare calculated through Steps 11-13. An ob-ject outlierness rankRis finally returned in Step 15.
Algorithm 1SCAN
Input: X - data objects,α- subset size factor,r- represen-tation dimensionality
Output: R- outlier rank
1: GenerateM1,M2, andM0using Equation (1)(2)(3) 2: repeat
3: Dk=SC(M2, k) 4: k=k+ 1
5: untilAppear a cluster with only one member
6: D← 1
n
Pn
i=2Di
7: η0←φ(M1,Sδ o,Snδ, α)
8: B(u, v)←(1 +η0(u)+η0(v)
2 )×(1 +D(u, v)), u, v∈ V 9: Construct value networkGasA←M1◦M0◦B 10: Runnode2veconGto obtain matrixNv∈R|V|×r 11: Mc(u, v)←kNNv(u,·)·Nv(v,·)
v(u,·)kkNv(v,·)k, u, v∈ V
12: η∗←Φ(M
c,Soη0,Snη0, α)
13: τ(x)←P
f∈Fη∗(vxf),x∈ X
14: R←SortX w.r.t.τin descending order
15: return R
Step 1 requires one scanning over the data objects, which hasO(|X ||V|2). Clustering process incurs the complexity of O(kmax|V|)in Steps 2-5. Constructing value network has
O(|V||V|). The time complexity of node2vec is O(|V|r). Steps 11-12 takes O(|V||V|). The object scoring and sort-ing takeO(|X ||V|)in Steps 13-14. Approximately, SCAN has linear time complexity w.r.t. number of data objects and is quadratic w.r.t. the number of features.
Experiments and Evaluation
Datasets
Thirteen publicly available real-world datasets are used, which cover diverse domains. Nine of these datasets are transformed from highly imbalanced data, where the small-est class is treated as outliers and the rsmall-est of classes or the largest class is normal. For the other four datasets,Adaand MGare transformed from balanced data by randomly sam-pling a small subset of the smallest class as outliers and keeping the largest class as normal class (imbalanced rate is controlled as 2%). The performance of these downsampled datasets is taken average over 10 times sampling;StMand StPare derived from a survey of math and Portuguese lan-guage courses in secondary school (Cortez and Silva 2008). In these two datasets, students with course grade less than 10 are treated as outliers, while students with course grade greater than 40 are normal objects (Xu et al. 2018a).
Performance Evaluation Methods
All the outlier detection methods in our experiments fi-nally produce an object rank. Top-ranked data objects are the most likely outliers. Following (Pang et al. 2018b; Campos et al. 2016; Zimek et al. 2013), the quality of rank is evaluated by the area under ROC curve (AUC). AUC in-herently takes the class-imbalance nature into consideration, making it comparable across different datasets in outlier de-tection (Campos et al. 2016). Higher AUC indicates better performance. The AUC would be around 0.5 given a ran-dom rank. We also employ the Wilcoxonsigned rank test to examine the significance of AUC performance of SCAN against its competitors.
Following (Pang et al. 2017b; Jian et al. 2018; Xu et al. 2018a), threedata indicators, i.e., average Mutual Informa-tion (MI), maximum feature efficiency (mfe) and average value relevance (avr), are defined to quantitatively measure the inherent characteristics of datasets, which are correlated with the performance of the outlier detectors.
MI is the average mutual information of all the features in a dataset. Mutual information measures how much knowing a feature reduces uncertainty about the other, which can be used to partially assess the non-IIDness of a dataset. Small
MI indicates that the features demonstrate diversified infor-mation.mfeandavrare two indicators to measure the dif-ficulties of a dataset.mfeis a feature-level indicator which is reported as the maximum AUC result of using frequency histogram of each feature to detect outliers.avris a value-level indicator to evaluate the value correlation with outlier class label. All the values are sorted in descending order w.r.t. their conditional probability with outliers and the aver-age conditional probability of top20%values is calculated as avr. A dataset with lowmfe andavr indicates that the dataset is very difficult.
Experiment Environment
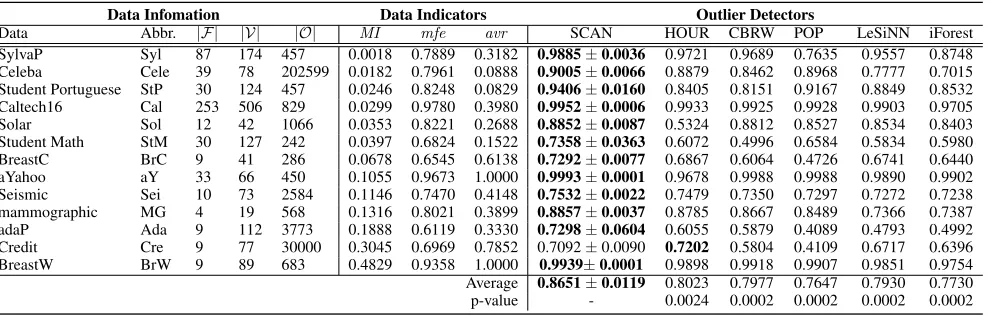
Table 1: A Summary of Datasets Used, Data Indicator Quantization Results and AUC Performance of SCAN and its Five Competitors. Data is ranked by indicatorMI. The best performance for each dataset is boldfaced.
Data Infomation Data Indicators Outlier Detectors
Data Abbr. |F | |V| |O| MI mfe avr SCAN HOUR CBRW POP LeSiNN iForest
SylvaP Syl 87 174 457 0.0018 0.7889 0.3182 0.9885±0.0036 0.9721 0.9689 0.7635 0.9557 0.8748
Celeba Cele 39 78 202599 0.0182 0.7961 0.0888 0.9005±0.0066 0.8879 0.8462 0.8968 0.7777 0.7015
Student Portuguese StP 30 124 457 0.0246 0.8248 0.0829 0.9406±0.0160 0.8405 0.8151 0.9167 0.8849 0.8532
Caltech16 Cal 253 506 829 0.0299 0.9780 0.3980 0.9952±0.0006 0.9933 0.9925 0.9928 0.9903 0.9705
Solar Sol 12 42 1066 0.0353 0.8221 0.2688 0.8852±0.0087 0.5324 0.8812 0.8527 0.8534 0.8403
Student Math StM 30 127 242 0.0397 0.6824 0.1522 0.7358±0.0363 0.6072 0.4996 0.6584 0.5834 0.5980
BreastC BrC 9 41 286 0.0678 0.6545 0.6138 0.7292±0.0077 0.6867 0.6064 0.4726 0.6741 0.6440
aYahoo aY 33 66 450 0.1055 0.9673 1.0000 0.9993±0.0001 0.9678 0.9988 0.9988 0.9890 0.9902
Seismic Sei 10 73 2584 0.1146 0.7470 0.4148 0.7532±0.0022 0.7479 0.7350 0.7297 0.7272 0.7238
mammographic MG 4 19 568 0.1316 0.8021 0.3899 0.8857±0.0037 0.8785 0.8667 0.8489 0.7366 0.7387
adaP Ada 9 112 3773 0.1888 0.6119 0.3330 0.7298±0.0604 0.6055 0.5879 0.4089 0.4793 0.4992
Credit Cre 9 77 30000 0.3045 0.6969 0.7852 0.7092±0.0090 0.7202 0.5804 0.4109 0.6717 0.6396
BreastW BrW 9 89 683 0.4829 0.9358 1.0000 0.9939±0.0001 0.9898 0.9918 0.9907 0.9851 0.9754
Average 0.8651±0.0119 0.8023 0.7977 0.7647 0.7930 0.7730
p-value - 0.0024 0.0002 0.0002 0.0002 0.0002
HOUR, CBRW, and POP are in JAVA. iForest and LeSiNN are in MATLAB.1
Effectiveness of SCAN in Real-world Data
Experiment Settings. SCAN is compared with five state-of-the-art outlier detection methods, i.e., HOUR (Pang et al. 2017a), CBRW (Pang, Cao, and Chen 2016), POP (Pang et al. 2017b), LeSiNN (Pang, Ting, and Albrecht 2015), and iForest (Liu, Ting, and Zhou 2012) on the thirteen real-world datasets to examine its effectiveness2. SCAN usesα= 0.15 andr = 128 by default. Its contenders use recommended parameter settings. HOUR, CBRW, and POP are closely re-lated methods. They also model feature value couplings to detect outliers in categorical data, and they are chosen to ex-amine the significance of complex value coupling learning of SCAN. LeSiNN is based on least similar nearest neigh-bours, and iForest is a feature subspace-based method. Note that both of them work on numerical data. We use one-hot transformation method to convert categorical features to bi-nary features to allow them to process on the same datasets (Xu et al. 2018a; Campos et al. 2016). SCAN, LeSiNN and iForest are non-deterministic methods (i.e., their perfor-mance may have slight difference between two runs), hence we report the average AUC result over 10 independent runs.
Findings: SCAN Significantly Outperforming Five State-of-the-art Outlier Detectors. The AUC performance of
1Our experiments show that POP runs comparably fast than
LeSiNN and iForest, and runs one to two orders of magnitude faster than CBRW and HOUR. Thus, We reimplement POP in Python and compare the efficiency of SCAN and POP. Our method SCAN runs approximately one to two orders of magnitude slower than POP. Due to space limitations, the detailed efficiency results are omitted.
2Two classical outlier detection algorithms, i.e., CompreX
(Akoglu et al. 2012) and LSA (He, Deng, and Xu 2005), are also performed. The results show that SCAN significantly outperform them at the 95% confidence level. Also, the empirical results in (Pang, Cao, and Chen 2016; Pang et al. 2017a) show that CBRW and HOUR significantly outperforms them. Therefore, we focus on the comparison with latest and closely-related outlier detectors.
SCAN and its five competitors is reported in Table 1. The standard deviation of SCAN is also reported. Our method SCAN achieves the best performance on twelve datasets and significantly outperforms its five contenders at the 99% con-fidence level. Averagely, our method obtains 8%, 8%, 13%, 9%, and 12% AUC improvement over HOUR, CBRW, POP, LeSiNN, and iForest, respectively.
The superiority of SCAN is mainly because it success-fully model, represent and utilise high-order complex value couplings to better capture the non-IIDness nature of data, which substantially improves its performance on the datasets with low MI, e.g., StP and StM. Note that other three coupling-based methods HOUR, CBRW and POP may ob-tain comparably good performance with SCAN and outper-forms LesiNN and iForest on some datasets, e.g.,Celeand MG. However, their performance is suboptimal and unsta-ble because they only focus on the pairwise primary value couplings and fails to capture reliable value relationships that hide in high-order complex value couplings. In partic-ular, SCAN impressively obtains over 66%, 47% and 54% AUC improvement over HOUR, CBRW and POP onSolar, StM andBrC, respectively. It is interesting that all the out-lier detectors can perform very well on datasetsSyl,Cal,aY, andBrW. This may be due to highmfeand/oravr of these datasets, i.e., they have at least one highly relevant feature and/or a small group of values that can well indicate outliers. On the contrary, it is very challenging for outlier detectors to obtain good performance on datasets with low mfe and/or
avr, e.g.,SeiandAda. Nevertheless, SCAN also exhibits its superiority compared with existing methods on these com-plex datasets.
Resilience of SCAN to Noise
probability with outliers (0.5is set in the experiments). All the data objects obey Gaussian distributions in other irrele-vant features. Equal width discretisation is employed to con-vert these numerical features to categorical features. All the six outlier detectors are examined on the datasets with dif-ferent percentage of relevant features. In order to have more reliable results, we generate 10 datasets for each noise level and the average AUC over them is reported.
20% 25% 30% 35% 40%
Percentage of Relevant Features 0.4
0.6 0.8 1
AUC
SCAN HOUR CBRW
POP LeSiNN iForest
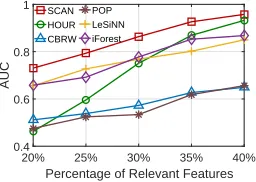
Figure 3: AUC Performance of SCAN and its Competitors on Datasets with Different Percentage of Relevant Features.
Findings: SCAN has Good Resilience to Noise. The AUC performance of SCAN and its five competitors on the synthetic datasets are shown in Figure 3. The AUC results of SCAN are very close to 1 when the percentage of relevant features is more than 40%. All the outlier detectors cannot obtain effective results when the datasets contain less than 20% relevant features, i.e., their AUC performance is around 0.5. Therefore, we focus on the noisy datasets with 20%-40% relevant features. SCAN performs consistently better than HOUR, CBRW, POP, LeSiNN, and iForest on these datasets, which further validates the effectiveness of mod-eling complex value couplings to alleviate the interference from noise. Note that HOUR is specially designed for noisy data, it gradually exhibits its superiority with the increas-ing of percentage of relevant features, and obtains compa-rably good result with SCAN on dataset with40%relevant features. However, it performs very poorly on the datasets with overwhelming noise level. The performance of CBRW and POP are considerably downgraded by the noise, since CBRW is a full space-based method and POP only models pairwise value couplings through conditional probability. It is interesting that LeSiNN and iForest can obtain quite good performance on these datasets. It is may because LeSiNN and iForest are based on subsampling, and they are less sensitive to noise. However, they are still markedly outper-formed by SCAN.
Sensitivity Test
Experiment Settings: We examine the sensitivity of SCAN w.r.t. its parametersrandαon all the datasets.
Findings: SCAN Performing Stably w.r.t. its Parameters.
The AUC results and standard deviation (SD) of SCAN with varyingαandrare reported in Figure 4. SCAN shows stable performance on all the datasets. Here we selectively demon-strate the AUC performance w.r.t.αandron five datasets, i.e., Stp, Cele,Sol,aY, and BrW, due to the space limits.
Note that the parameters can be tuned based on the specific prior knowledge when the SCAN is applied in different do-mains. Parameter αis related to multiple factors, e.g., the outlier proportion, noise rate, and the number of outlying values contained per outlier (Pang et al. 2017b).2α|V|is the subspace size that is used in the value outlierness evaluation of SCAN. Too largeαnormally makes value subspace lose its meaning. As for Parameterr, it partially determines the efficiency of SCAN. In general,α= 0.15andr= 128are recommended in practice.
8 16 32 64 128 256 512 r
0 0.02 0.04
SD
StP Cele 0.1 0.15 0.2 0.25 0.3 0.35 0.4
α 0.8
0.9 1
AUC
StP Cele
Sol aY
BrW
8 16 32 64 128 256 512 r
0.8 0.9 1
AUC
StP Cele
Sol aY
BrW
0.1 0.15 0.2 0.25 0.3 0.35 0.4 α
0 0.02 0.04
SD
StP Cele
Sol aY
BrW Sol
aY BrW
Figure 4: Sensitivity Test Results of SCAN w.r.t.αandr.
Conclusions
This paper introduces EMAC framework to propose an in-sight of using embedding method to learn complex value couplings for detecting outliers in non-IID categorical data. We further propose SCAN as an instance of EMAC. SCAN first models primary value couplings, and then defines cou-pling bias to capture complex coucou-plings with different gran-ularities. High-order complex value couplings can be further learnt and embedded in the value representation matrix by performing the network embedding method on the biased value coupling-based value network. In addition, a value subspace-based value outlierness evaluation method (i.e., BSVC learning) is proposed to show how to utilise obtained value couplings to detect outliers. Our extensive experiments show that SCAN significantly outperforms five state-of-the-art outlier detectors on thirteen real-world datasets, and has much better resilience to datasets with different level of noise. Besides, SCAN performs stably w.r.t. its parameters. In future, in order to practically use SCAN to detect outliers in multi-source data, we plan to implement SCAN in dis-tributed system JointCloud (Wang, Shi, and Zhang 2017).
Acknowledgements
This work is supported by the National Key Research and Development Program of China (2016YFB1000101), and by the National Natural Science Foundation of China (No.61472439 and No.61379052).
References
Aggarwal, C. C. 2017. Outlier analysis. Springer.
Akoglu, L.; Tong, H.; Vreeken, J.; and Faloutsos, C. 2012. Fast and reliable anomaly detection in categorical data. In CIKM, 415–424. ACM.
Campos, G. O.; Zimek, A.; Sander, J.; Campello, R. J.; Mi-cenkov´a, B.; Schubert, E.; Assent, I.; and Houle, M. E. 2016. On the evaluation of unsupervised outlier detection: mea-sures, datasets, and an empirical study. Data Mining and Knowledge Discovery30(4):891–927.
Cao, L., and Yu, P. S. 2016. Non-iid recommendation theo-ries and systems.IEEE Intelligent Systems31(2):81–4.
Cao, L.; Ou, Y.; and Yu, P. S. 2012. Coupled behavior analy-sis with applications.IEEE Transactions on Knowledge and Data Engineering24(8):1378–1392.
Cao, L. 2014. Non-iidness learning in behavioral and social data.The Computer Journal57(9):1358–1370.
Chen, T.; Tang, L.-A.; Sun, Y.; Chen, Z.; and Zhang, K. 2016. Entity embedding-based anomaly detection for het-erogeneous categorical events. InIJCAI, 1396–1403. AAAI Press.
Cinbis, R. G.; Verbeek, J.; and Schmid, C. 2016. Approx-imate fisher kernels of non-iid image models for image cat-egorization.IEEE transactions on pattern analysis and ma-chine intelligence38(6):1084–1098.
Cortez, P., and Silva, A. M. G. 2008. Using data min-ing to predict secondary school student performance. In FUBUTEC, 5–12. EUROSIS.
Das, K.; Schneider, J.; and Neill, D. B. 2008. Anomaly pattern detection in categorical datasets. InSIGKDD, 169– 176. ACM.
Grover, A., and Leskovec, J. 2016. node2vec: Scalable fea-ture learning for networks. InSIGKDD, 855–864. ACM. He, Z.; Xu, X.; Huang, Z. J.; and Deng, S. 2005. FP-outlier: Frequent pattern based outlier detection. Computer Science and Information Systems2(1):103–118.
He, Z.; Deng, S.; and Xu, X. 2005. An optimization model for outlier detection in categorical data. InAdvances in In-telligent Computing. Springer. 400–409.
Jian, S.; Pang, G.; Cao, L.; Lu, K.; and Gao, H. 2018. Cure: Flexible categorical data representation by hierarchical cou-pling learning. IEEE Transactions on Knowledge and Data Engineering.
Keller, F.; M¨uller, E.; and Bohm, K. 2012. HiCS: High con-trast subspaces for density-based outlier ranking. InICDE, 1037–1048. IEEE.
Lazarevic, A., and Kumar, V. 2005. Feature bagging for outlier detection. InSIGKDD, 157–166. ACM.
Liu, F. T.; Ting, K. M.; and Zhou, Z.-H. 2012. Isolation-based anomaly detection. ACM Transactions on Knowledge Discovery from Data6(1):1–39.
Pang, G.; Cao, L.; Chen, L.; and Liu, H. 2017a. Learning homophily couplings from non-iid data for joint feature se-lection and noise-resilient outlier detection. InIJCAI, 2585– 2591. AAAI Press.
Pang, G.; Xu, H.; Cao, L.; and Zhao, W. 2017b. Selec-tive value coupling learning for detecting outliers in high-dimensional categorical data. InCIKM, 807–816. ACM. Pang, G.; Cao, L.; Chen, L.; Lian, D.; and Liu, H. 2018a. Sparse modeling-based sequential ensemble learning for ef-fective outlier detection in high-dimensional numeric data. InAAAI, 3892–3899.
Pang, G.; Cao, L.; Chen, L.; and Liu, H. 2018b. Learn-ing representations of ultrahigh-dimensional data for ran-dom distance-based outlier detection. In SIGKDD, 2041– 2050. ACM.
Pang, G.; Cao, L.; and Chen, L. 2016. Outlier detection in complex categorical data by modelling the feature value couplings. InIJCAI, 1902–1908. AAAI Press.
Pang, G.; Ting, K. M.; and Albrecht, D. 2015. LeSiNN: De-tecting anomalies by identifying least similar nearest neigh-bours. InICDM Workshop, 623–630. IEEE.
Sathe, S., and Aggarwal, C. C. 2016. Subspace outlier de-tection in linear time with randomized hashing. InICDM, 459–468. IEEE.
Wang, H.; Shi, P.; and Zhang, Y. 2017. Jointcloud: A cross-cloud cooperation architecture for integrated internet service customization. InICDCS, 1846–1855. IEEE.
Wu, S., and Wang, S. 2013. Information-theoretic outlier detection for large-scale categorical data.IEEE Transactions on Knowledge and Data Engineering25(3):589–602. Xu, H.; Wang, Y.; Cheng, L.; Wang, Y.; and Ma, X. 2018a. Exploring a high-quality outlying feature value set for noise-resilient outlier detection in categorical data. InCIKM, 17– 26. ACM.
Xu, H.; Wang, Y.; Wu, Z.; Ma, X.; and Qin, Z. 2018b. Com-bine value clustering and weighted value coupling learning for outlier detection in categorical data. InDEXA, 439–449. Springer.
Zhao, W.; Li, Q.; Zhu, C.; Song, J.; Liu, X.; and Yin, J. 2018. Model-aware categorical data embedding: a data-driven ap-proach. Soft Computing22(11):3603–3619.
Zhou, Z.-H.; Sun, Y.-Y.; and Li, Y.-F. 2009. Multi-instance learning by treating instances as non-iid samples. In Pro-ceedings of the 26th annual international conference on ma-chine learning, 1249–1256. ACM.
Zhu, C.; Cao, L.; Liu, Q.; Yin, J.; and Kumar, V. 2018. Heterogeneous metric learning of categorical data with hi-erarchical couplings. IEEE Transactions on Knowledge and Data Engineering30(7):1254–1267.
Zimek, A.; Gaudet, M.; Campello, R. J.; and Sander, J. 2013. Subsampling for efficient and effective unsupervised outlier detection ensembles. InSIGKDD, 428–436. ACM.