Abstract — Evaluation tools are significant from the Agent Oriented Software Engineering (AOSE) point of view. Defective designs of communications in Multi-agent Systems (MAS) may overload one or several agents, causing a bullying effect on them. Bullying communications have avoidable consequences, as high response times and low quality of service (QoS). Architectures that perform evaluation functionality must include features to measure the bullying activity and QoS, but it is also recommendable that they have reusability and scalability features. Evaluation tools with these features can be applied to a wide range of MAS, while minimizing designer’s effort. This work describes the design of an architecture for communication analysis, and its evolution to a modular version, that can be applied to different types of MAS. Experimentation of both versions shows differences between its executions.
Keywords — Analysis, architecture, bullying, communications, multi-agent systems.
I. INTRODUCTION
OMMUNICATIONS become complex to design in huge systems which interact frequently. In MAS, interactions among agents must be designed correctly to avoid behaviors that may collapse communications. The overall result of these behaviors is high response times, among other problems. Within this context, communication analysis techniques become relevant to evaluate the correct performance of the MAS. These techniques inspect the communications among agents in executions, to detect undesirable patterns of communications, like agents that are overloaded with the reception of too many messages. Once the undesirable situation is detected, the re-design the MAS communications is a straightforward task [1]. Other non desirable situations appear when there are not expected sequences of agents that interact in a conversation [2].
The effect of overloading can be compared to bullying, as explained in [3]. There are agents that play the bully role, when they send too many messages; other agents play the mistreated role when they received too many messages; other agents that play both roles, mistreated and bully; other ones that are considered as isolated because they neither send nor receive messages; and there are regular agents that behave correctly because they send and receive messages in a balanced way. There are metrics to measure the proportion of sent and received messages; these metrics are the values to classify agents into the mentioned patterns. The detection of
non desired patterns in certain conversations can help the designer to modify the interactions, obtaining better response times and higher QoS results, [1], [3].
Previous frameworks for the analysis of these behaviors have been designed embedding the evaluation and debug tools within the execution of the MAS. Results can be inspected after the execution, and in consequence a straightforward re-design can be made.
Despite the satisfactory results obtained with this approach, reusability for other types of MAS becomes a difficult task, that involves re-codification of the evaluation and debug functionality. An efficient architecture is basic for the designer/tester, not only to obtain satisfactory results, but also to reuse the analysis tool in other type of MAS.
This work represents one step forward in architectures for MAS analysis. We provide a new framework for the MAS execution and evaluation in order to reach complete independence of both tasks. The result is a new architecture with two modules: one for the execution and another for the evaluation and debugging.
This research is presented in the following order: Section 2 describes the related work. The description of the new architecture is within Section 3. The results of the execution of the new architecture are included in Section 4. Finally, conclusions and future work can be found in Section 5.
II.RELATED WORK
Literature regarding load balancing in MAS is relevant and plentiful. This problem has been focused using different strategies. [4] apply learning techniques in MAS load balancing. The task of the agent is to choose the correct resource using local information. Its objective is to optimize the resource usage. Unlike our work objective, they are not concerned in the scalability and adaptability of their solution to other problems or platforms.
The work in [5] resembles ours because they also use classification techniques and metrics to analyze the organization of MAS. They also relate their metrics and the response time, which is used as indicator of QoS. But it differs our work in the use of their metrics, which are used just to evaluate architectures; instead, we present an architecture to evaluate the communications in MAS.
AntNet [6], Challenger [7], and DIET (Decentralised Information Ecosystem Technologies) [8] use mobile agents to use their respective resources equitably, but they do not identify the cause of the overloading/bullying problem. DIET
An Analysis Architecture for Communications
in Multi-agent Systems
C
Celia Gutiérrez
-66- overcomes multi-agent platforms limitations in terms of adaptability and scalability, providing a foundation for an open, adaptive and scalable agent organization. In this way, they share the same interests as we do, but they are focused on supporting basic mobile agent capabilities.
Messor [9] uses adaptive system approach. It uses an algorithm that emulates the ant behavior to distribute workload among distributed nodes. In this case, they are specially focused in peer-to-peer systems.
Other work, the Anticipate Agent Assistance (AAA) [10] also uses an agent-based metric for testing and managing the resource information of the wireless points, choosing the less overloaded access points. They are also concerned in achieving high QoS indicators of communications. However, they have confined their solution to the wireless networks.
Finally, [11] perform debugging process on recorded data of the MAS execution, like in the current work. Their analysis helps understand the behavior of the system and can reveal undesirable social behaviors. So their testing and debugging of complex MAS remains just at social level.
In summary, there are works that are concerned in achieving equitable behaviors of agents in MAS executions. All of them differ in the way they make the analysis, design, or evaluation, and their purpose: ones are focused on load balancing in general, others on load balancing in communications, and others in social behaviors. But neither of them has the purpose of building a scalable architecture of MAS to evaluate its communications. This architecture can integrate the elements which are present in MAS communications, as the following section describes.
III. DESIGN OF THE NEW ARCHITECTURE
The new architecture, called IDKAnalysis 2.0, is based on a previous version, IDKAnalysis 1.0.
Both architectures follow the Ingenias methodology [12] and have been executed on Ingenias Development Kit (IDK) case studies, although they use different versions of IDK (IDKAnalysis 1.0 uses IDK 2.7, whereas IDKAnalysis 2.0 uses IDK 2.8). IDK versions use a template (build.xml) to detail the agent deployment of the case study one wants to run. At the same time, user inputs can be necessary to start the case study activity, although these inputs vary on each case study. Further details on this framework can be seen at [13]. Both versions of IDK are available at http://sourceforge.net/projects/ingenias/files/INGENIAS%20D evelopment%20Kit/Aranjuez/, on their corresponding option.
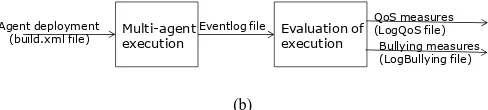
Fig. 1 shows the differences of both versions of the architectures:
Multi-agent Execution and evaluation Agent deployment
(build.xml file)
QoS measures, bullying measures (standard output)
Initiation of activity (standard input)
(a)
Eventlog file Multi-agent
execution Evaluation of execution Agent deployment
(build.xml file)
QoS measures (LogQoS file)
Bullying measures (LogBullying file)
(b)
Fig. 1. Block diagram of the IDKAnalysis, version 1.0 (a) and 2.0 (b).
The first version performs the MAS execution and evaluation at the same time. The outputs only refer to the analysis, and extract the analysis measures and QoS measures. The second version is based on an architecture with a front-end that executes the main functionality of the MAS, and a back-end that analyzes the communications generated by the front-end.
There are also differences in the inputs and outputs of both architectures:
In the first one, apart from the agent configuration, it is necessary human interaction to start the activity, whereas in the second one, the execution starts automatically (without the user input).
The outputs of the first version are shown at the same time. In the second version, the front-end outputs a log file with the events recorded; the back-end receives as input the event log file, and produces the two outputs physically separated in two files.
Inputs and outputs of the back-end are described and analyzed in the following subsections.
A. Event log file
The event log file registers the main events of the MAS execution with certain format that corresponds to the main features of these events. The generation of this file is a characteristic functionality of IDK2.8.
The standard format of a line is as follows:
Timestap(hours:minutes:seconds:milesecond) ;Name of the event;Additional fields
Additional fields depend on the type of event it represents. Below there is an example of the event that represents A new entity is added to the agent mental state:
23:53:47:187;MEAddedToMentalState;BuyerAge nt_0multipleBuyers@viriato:60000/JADE!Curr entAssistedAgent!ME0
where the content of the additional fields are:
involved agent ->
BuyerAgent_0multipleBuyers@viriato:60000/J ADE
kind of entity -> CurrentAssistedAgent entity id -> ME0
events of this version include message shipping and reception events, and others that are necessary to measure response times. Even more, with the intention of using the event log file for other purposes than communication analysis, a wide range of types of events is included:
1) A new entity is added to the mental state. 2) An agent was initialized completely. 3) A task was scheduled within the agent. 4) A task was executed.
5) An agent is starting collaboration as initiator. 6) An agent has accepted to participate in an interaction
as collaborator.
7) An agent has received a request to participate in collaboration.
8) A mental entity has been removed from the conversation.
9) An agent received a message. 10) An agent sent a message.
11) An entity was added to a conversation.
In IDK 2.8 the name of the event log file is generated in such a way that it contains the day, month, year, hour and minute of its creation.
An excerpt of an event log file can be found in the Appendix section.
B. Outputs of the Evaluation Module
As Fig. 1 (b) shows, the outputs of the second module are the QoS measures (in this case response times) and the bullying measures. This module is coded in Java, JDK1.7.0_04. For this purpose, there are two types of events selected from the event log file.
The first output depends on each case study and basically is the time elapsed since a service is requested until an offer of that service is proposed. For MAS with a lot of service responses (as a consequence of having many agents offering services), it is may be useful to establish a number of iterations or responses until a response time is recorded.
It is necessary to choose the task when the time measuring process initiates and the task when it finishes. The response time is the elapsed time between them. This depends on each case. In the experimentation of Section 4, the initiating task is ChooseMovie, and the finishing task is ChooseCinema. The type of event that records the executed task is TaskExecuted. In the example below, the log refers to the starting time of execution of ChooseMovie task.
18:22:02:355;TaskExecuted;InterfaceAg ent_3expInterfaceAgentwithprofile!ChooseMo vie!ME103705
where the additional fields mean:
involved agent ->
InterfaceAgent_3expInterfaceAgentwithprofi le
task type -> TaskExecuted
task name -> ChooseMovie task id -> ME103705
The second output is the bullying measures, which are described in detail in a previous work [3]. In this case, MessageReceived event is used each time a message is received by an agent, as in the following example:
23:53:48:885;MessageReceived;BuyerAssignme nt!0.InterfaceAgent_9multipleInterfaceAgen tsvir1225148028355!RejectBecomingAssistant !BuyerAgent_4multipleBuyers!InterfaceAgent _9multipleInterfaceAgents
where the additional fields are:
protocol -> BuyerAssignment conversation id ->
0.InterfaceAgent_9multipleInterfaceAgentsv ir1225148028355
protocol state from which the message is sent -> RejectBecomingAssistant
sender -> BuyerAgent_4multipleBuyers receiver ->
InterfaceAgent_9multipleInterfaceAgents
In this way, information about senders and receivers is enough to compute the measures of [3] and start the evaluation process.
Although the measures are standard for any type of MAS with agents playing different roles, the designer must also specify which the role is going to be analyzed as bully, and which one as the mistreated. Besides, he must tune a threshold. As explained in [3], the computed measures are compared with the indicated values for each pattern, although a margin between both values is established as threshold.
Considering that all these features must be customizable for executions of other types of MAS, this module contains the following parameters:
1) Path of the Eventlog file, LogBullying file, QoS file. 2) Name of the LogBullying file
3) Name of the Qos file.
4) Role that is suspected to be the Bully in the conversations.
5) Role of that is suspected to be the Mistreated in the conversations.
6) Threshold for the bullying metrics.
7) Number of iterations that a task must be executed to calculate the response time.
8) The initial task that must be executed to start the response time counting.
-68- C. Advantages of IDKAnalysis 2.0 over IDKAnalysis 1.0 Case studies built under IDKAnalysis 2.0 offer several aspects of the executions that make it applicable to other case studies. These features appear on each module:
1) The event log file generated by the first module does not only record communication related to events, but also other events that can be analyzed for different purposes.
2) The second module produces two different files, so bullying measures and response times can be analyzed separately. Besides, this module contains some parameters that can be tuned, so it can be adapted to other methodology case studies.
Figs. 4 and 5 (in the Appendix section) show the running architectures of both versions using the experimentation described in Section 4. Fig. 4 (a) shows the architecture of the first version, where the distinction between the front-end and the back-end does not exist. The second version in Fig. 4 (b) contains the srceclipse package, which is the back-end, whereas the rest of the packages compose the front-end. The srceclipse package, which does not appear in Fig. 4 (a), is also composed of the bullying package and the logs package, as Fig. 5 shows. The first one contains the source and binary files for the evaluation process, and the second one is the directory where the log files (inputs and outputs) are placed. As explained in the previous subsection, this directory is the first parameter the designer/tester can customize.
IV. EXPERIMENTATION RESULTS
Executions of both versions have been carried out using the Cinema case study, pursuing the objective of acquiring cinema tickets according to certain user’s preferences. The participant roles are the following:
Interface agent, which represents the customer. Seller agent, which represents the cinema.
Buyer agent, which represents the intermediary between the Seller and the Interface.
The hardware of the experimentation has been a machine with 2 GHz and 2GB RAM, using 32-bit Windows 7
Professional.
The Cinema case study uses Java Agent DEvelopment (JADE) platform. JADE framework uses the Foundation for Intelligent Physical Agents (FIPA) standard for communications among agents.
As table 1 shows, configurations with different numbers of agents for each role have been run:
TABLEI
CONFIGURATIONS FOR CINEMA CASE STUDY
Configuration Number of Interface Agents
Number of Seller Agents
Number of Buyer Agents
Serious 10 5 10
Simple 20 4 20
FullSystem 100 8 100
The following subsections include examples of executions on both versions of the tool.
A. Execution using IDKAnalysis 1.0
The Cinema case study begins with two possible options for the use, as Fig. 2 shows.
Fig. 2. Initial GUI of the Cinema case study built with IDKAnalysis 1.0
It is necessary to start running by selecting Start monthly activity. This will produce the conversations between the agents, in order to get the proposed tickets. As this is not the relevant part of this work, no output has been extracted. Then, Bullying Measures can be selected, to obtain the values for the bullying metrics and response times from the generated communications.
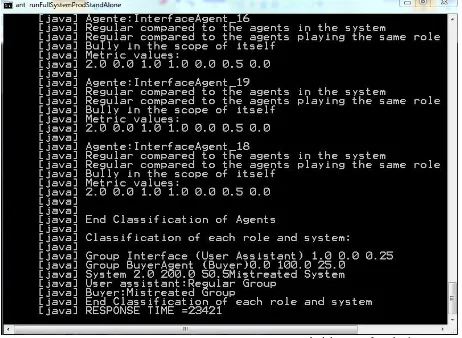
A snapshot of this execution on console can be seen in Fig. 3, where the metrics and classification for IntergaceAgent_16, IntergaceAgent_19, IntergaceAgent_18 agents, and the corresponding values for the roles and the system, can be seen alongside the extraction of a response time.
B. Execution using IDKAnalysis 2.0
Mentioned parameters in subsection 3.B, numbered from 4 to 9, have been tuned as follows:
Role that is suspected to be the Bully in the conversations: Interface
Role of that is suspected to be the Mistreated in the conversations: Buyer
Threshold for the bullying metrics: 1.0
Number of iterations that a task must be executed to calculate the response time: 10
The initial task that must be executed to start the response time counting: ChooseMovie
The final task that must be executed to end the response time counting: ChooseCinema
In this way, the response time which is recorded, is the elapsed time between the ChooseMovie task and the tenth occurrence of the ChooseCinema task.
Fig. 3 Output of the IDKAnalysis 1.0 for a FullSystem configuration.
V. FUTURE WORK AND CONCLUSIONS
In this work we have presented a new framework which separates the multi-agent system execution and the evaluation of the communication among agents.
This perspective provides several advantages from the Software Engineering point of view:
To work on the functionality or the evaluation process directly, by introducing changes in the front-end (for the first purpose), or the back-end (for the second purpose).
To inspect bullying behaviors and QoS measures separately, by the analysis of the LogBullying file (in the first case), or the QoS file (in the second case). To reuse the evaluation module in other case studies, by
tuning some parameters accordingly to each multi-agent system circumstances. The range of events generated by
IDK8.0 (and IDKAnalysis2.0 in consequence) offers different possibilities to record QoS, which does not necessarily use the TaskExecuted event, but other ones.
This architecture offer several possibilities of future work. It is thought to use the evaluation module in MAS with different purposes and frameworks:
ADELFE methodology [14] for Adaptive MAS. ICARO-T framework [15] for agent organizations.
Available at http://icaro.morfeo-project.org/ Agent Based Social Simulation frameworks.
The combination of IDKAnalysis 2.0 with the above methodologies will provide experimentation outputs with two purposes:
1)Validate and enlarge the evaluation framework with the experimentation results. In particular, it is necessary a previous extraction of the event logs. These logs must accomplish the basic format of the log file mentioned in subsection 3.A. Even more, as log extraction is used for other purposes, an ontology may be parsed to get the correct parameters for each purpose. This new component and other ones will be incorporated in a new version of the tool, IDKAnalysis 3.0.
2)Enlarge the mentioned methodologies and frameworks from the AOSE point of view, with a complete module that provides testing and debugging tools.
ACKNOWLEDGMENT
-70- (a)
APPENDIX
This section contains two types of information:
1) Snapshots of the running architecture of the Cinema case study using IDKAnalysis1.0 and IDKAnalysis2.0. In the first snapshot, belonging to IDKAnalysis1.0, the package deployment does not show the distinction between the front-end and the back-end. This fact is reflected in the second snapshot, belonging to IDKAnalysis2.0. The third snapshot shows the content of the back-end. Further explanations are provided in subsection 3.C.
2) Samples of the input and outputs of the evaluation module for the execution of the Cinema case study, using the parameter configuration in subsection 4.B.
(b)
Fig. 4 A snapshot of the running architecture top level in IDKAnalysis1.0 (a) and IDKAnalysis2.0 (b).
This is an excerpt of an event log file. Each line contains the information of an event, according to the syntax described in subsection 3.A:
18:21:26:770;TaskExecuted;InterfaceAgent_6 5expInterfaceAgentwithprofile!Look_for_an_ assistant!ME1044
18:21:26:770;MessageSent;BuyerAssignment!0 .InterfaceAgent_67expInterfaceAgentwithpro
filePC-1227028885694!enable!InterfaceAgent_67expI nterfaceAgentwithprofile!BuyerAgent_6expBu
yerAgentWithProfile@PC-sheilacg:60000/JADE,
18:21:26:770;TaskScheduled;InterfaceAgent_ 7expInterfaceAgentwithprofile!Look_for_an_ assistant!ME1167![ME19:GetAssignments] 18:21:26:770;MessageSent;BuyerAssignment!0 .InterfaceAgent_67expInterfaceAgentwithpro
filePC-1227028885694!RequestBeingAssistant!Interf aceAgent_67expInterfaceAgentwithprofile!Bu yerAgent_6expBuyerAgentWithProfile@PC-sheilacg:60000/JADE,
18:21:26:786;MessageSent;BuyerAssignment!0 .InterfaceAgent_1expInterfaceAgentwithprof
This is an excerpt of the LogBullying file. It reflects the classification values and measures for one of the Interface agents, both roles and the whole system:
Fig. 5 A snapshot of the running architecture second level (back-end) in IDKAnalysis2.0.
Agente:InterfaceAgent_7expInterfaceAgentwi thprofile
numOutputAgent =26.0 NumAgent =40
numOutput = 514.0 Bully proportionally to the bully agents in the system
Regular compared to the agents playing the same role
Bully in the scope of itself Metric values:
2.0233462 0.0 1.0116731 0.50583655 0.0 0.25291827 0.0
End Classification of Agents
Classification of each role and system:
Group CoordA 0.0 0.0 0.0
Group NetworkA 0.28266892 4.5903044 1.2182432
System 2.2613513 36.722435 9.745946Mistreated System Bully System
CoordA:Regular Group NetworkA:Mistreated Group
End Classification of each role and system
This is an exerpt of the LogQoS file. Each line contains the response times (in milliseconds) obtained with a frequency of 10 iterations:
10 iterations 6755 20 iterations 8106 30 iterations 8994 40 iterations 9511
REFERENCES
[1] C. Gutiérrez, I. García-Magariño, and R. Fuentes-Fernández, “Detection of undesirable communication patterns in multi-agent systems,” Engineering Applications of Artificial Intelligence, vol. 24, no. 1, pp. 103-116, 2011.
[2] C. Gutierrez and I. García-Magariño, “Extraction of execution patterns in multi-agent systems,” IEEE Latin America Transactions, vol. 8, no. 3, pp. 311-317, 2010.
[3] C. Gutiérrez and I. García-Magariño, “Revealing bullying patterns in multi-agent systems,” Journal of Systems and Software, vol. 84, no. 9, pp. 1563-1575, 2011.
[4] S. Andrea, Y. Shoham, and M. Tennenholtz, “Adaptive Load Balancing: A Study in Multi-Agent Learning,” Journal of Artificial Intelligence Research, vol. 2, no. 1, pp. 475-500, 1994.
[5] S. K. Lee and C. S. Hwang, “Architecture modeling and evaluation for design of agent-based system,” Journal of Systems and Software, vol. 72, no. 2, pp. 195-208, 2004.
[6] R. Schoonderwoerd, O. Holl, J. Bruten, and L. Rothkrantz, “Ant-based load balancing in telecommunications networks,”
Adaptive Behavior, vol. 5, no. 2, pp. 169-207, 1996.
[7] A. Chavez, R. Moukas, and P. Maes, “Challenger: A Multiagent System for Distributed Resource Allocation,” Autonomous Agents, vol. 97, pp. 323-331, 1997.
[8] C. Hoile, F. Wang, E. Bonsma, and P. Marrow, “Core Specification and Experiments in DIET: A Decentralised Ecosystem-inspired Mobile Agent System,” in Proc. 1st Int. Conf. Autonomous Agents and Multi-Agent Systems, Bologna, 2002, pp. 623-630
[9] A. Montresor and H. Meling, “Messor: Load-Balancing through
a Swarm of Autonomous Agents,” in Proc. 1st Workshop on Agent and Peer-to-Peer Syst., Bologna, 2002, pp. 125–137.
[10] Y. C. Chen and W. Y. Chen, “An agent-based metric for quality
of services over wireless networks,” Journal of Systems and Software, vol. 81, no. 10, pp. 1625-1639, 2008.
[11] E. Serrano, A. Quirin, J. Botia, and O. Cordón, “Debugging complex software systems by means of path finder networks,”
Information Sciences, vol. 180, no. 5, pp. 561-583, 2010.
[12] J. Pavón and J.J. Gomez-Sanz, “Agent Oriented Software Engineering with INGENIAS,” in Proc. 3rd Int. Central and
Eastern European Conf. on Multi-Agent Systems, vol. 2691, Prague, pp. 394-403, 2003.
[13] J. J. Gomez-Sanz, R. Fuentes-Fernández, J. Pavón, and I. García-Magariño, “INGENIAS Development Kit: a visual multi-agent system development environment,” in Proc. 7th Int. Conf. Autonomous Agents and Multiagent Systems, 2008, pp. 1675-1676.
[14] G. Picard and M-P. Gleizes, “The ADELFE Methodology,”
-72- [15] J. M. Gascueña, A. Fernández-Caballero, and F. J. Garijo, “
Programming Reactive Agent-based Mobile Robots using ICARO-T Framework,” in 2010 Proc. ICAART Conf., vol. 2, pp. 287-291.