All Rights Reserved © 2014 IJDCN
Performance Evolution of Enhanced DDoS in Networking
G. ERAPPA
RESEARCH SCHOLAR, BUNDELKHAND UNIVERSITY,JHANSI Dr.M.K.AGARWAL
Professor,BUNDELKHAND UNIVERSITY,JHANSI
Abstract
Ad hoc networks have a wide array of military and commercial applications. They are ideal in situations where installing an infrastructure network is not possible or when the purpose of the network is too transient or even for the reason that the previous infrastructure network was destroyed.
Security in mobile ad hoc networks is a hard to achieve due to dynamically changing and fully decentralized topology as well as the vulnerabilities and limitations of wireless data transmissions. Existing solutions that are applied in wired networks can be used to obtain a certain level of security. Nonetheless, these solutions are not always be suitable to wireless networks. Therefore ad hoc networks have their own vulnerabilities that cannot be always tackled by these wired network security solutions.
One of the very distinct characteristics of MNs is that all participating nodes have to be involved in the routing process. Traditional routing protocols designed for infrastructure
networks cannot be applied in ad hoc networks, thus ad hoc routing protocols were designed to satisfy the needs of infrastructureless networks. Due to the different characteristics of wired and wireless media the task of providing seamless environments for wired and wireless networks is very complicated. One of the major factors is that the wireless medium is inherently less secure than their wired counterpart. Most traditional applications do not provide user level security schemes based on the fact that physical network wiring provides some level of security. The routing protocol sets the upper limit to security in any packet network. If routing can be misdirected, the entire network can be paralyzed. This problem is enlarged in ad hoc networks since routing usually needs to rely on the trustworthiness of all nodes that are participating in the routing process. An additional difficulty is that it is hard to distinguish compromised nodes from nodes that are suffering from broken links.
Introduction
This section describes the scenario, the movement model and the communication model used in this study. Moreover, it presents the parameters used in the simulations. The performance simulation environment used is based on GloMoSim, a network simulator that provides support for simulating multi-hop wireless networks complete with physical and IEEE 802.11 MAC layer models.
The simulated environment consists of 50
wireless mobile nodes roaming in 1200 meters
1200 meters as shown in Table 7.1. The radio
transmission range is 250 meters. A free space
propagation channel is assumed. Group scenario
files determine which nodes are sources or
receivers and when they join or leave a group.
A multicast member node joins the multicast group at the beginning of the simulation and remains as a member throughout the whole simulation. Hence, the simulation experiments do not account for the overhead reduced when a multicast member leaves a group. Multicast sources start and stop sending packets in the same fashion
(four packets per second, each packet has a
constant size of 512 bytes). Nodes in the network
are placed uniformly. For fairness, identical
mobility and traffic scenarios are used for different
attack mechanisms. Only one multicast group was
used for all the experiments.
Each mobile node moves randomly at a
preset average speed according to a “random
waypoint model”. Here, each node starts its
journey from a random location to a random
destination with a randomly chosen speed
(uniformly distributed between 0 – some maximum
speed). Once the destination is reached, another
random destination is targeted after a pause. By
varying the pause time, the relative speeds of the
mobiles are affected. In our experiments the pause
time was always set to zero to create a harsher
mobility environment. The maximum speeds used
were chosen from between 0 m/s to 20 m/s.
. Network Parameters
Simulation time
Mobility
All Rights Reserved © 2014 IJDCN No. of multicasting group members
Mobility Model
The input to each simulation run is a Node
movement scenario file that describes the motion
of each node. We pre-generate different Node
movement scenario files with various movement
patterns according to the “random waypoint”
model. Each node begins simulations by remaining
stationary for pause time seconds. It then selects a
random destination from the 1200m 1200m space
and moves to the destination at a speed distributed
uniformly between 0 and a maximum speed (20
meter / second in our simulations). Upon reaching
the destination, the node pauses again for pause
time seconds, selects another destination, and
proceeds there as previously described, repeating
this behavior for the duration of simulation.
7.1.2. Traffic Model
The traffic source in our simulation has constant
bit rate. Each data packet has a fixed size payload
of 512bytes. In additional to the traffic that a
sender and its receivers generate to interact with
each other, we add CBR background traffic among
other mobile nodes in order to simulate a real
network environment.
7.1.3. Movement Model
The mobile nodes move according to the “random waypoint” model. Each mobile node begins the simulation by remaining stationary for pause time seconds. It then selects a random destination in the defined topology area and moves to that destination at a random speed. The random speed is distributed uniformly between zero (zero not included) and some maximum speed. Upon reaching the destination, the mobile node pauses again for pause time seconds, selects another destination, and proceeds there as previously described. This
movement pattern is repeated for the duration of
the simulation.
7.2. PERFORMANCE METRICS
The goal of this dissertation was to “Detect &
Prevent DDoS attack inMN”. Implementation,
detection and comparison of the different
prevention techniques for DDoS attack is done by
simulating them and examining their behavior. In
the simulations in the following section, the effect
different mechanisms are evaluated. The following
quantitative metrics are to be used to evaluate the
performance of DDoS attacks and their prevention
techniques under different combinations in the
fixed mobile ad hoc network.
Packet Delivery Ratio (PDR): It is the
ratio of the number of packets actually
delivered without duplicates to the
destinations versus the number of data
packets supposed to be received. This
number represents the effectiveness and
throughput of a protocol in delivering
data to the intended receivers within the
network. Number of successfully delivered legitimate packets as a ratio of number of generated legitimate packets.
Total Number of packets Sent
PDR=
Total Number of packets
Received
Number of Collisions: In a network,
when two or more nodes attempt to
transmit a packet across the network at
the same time, a packet collision occurs.
When a packet collision occurs, the
packets are either discarded or sent back
All Rights Reserved © 2014 IJDCN avoid further collision. Packet collisions
can result in the loss of packet integrity
or can impede the performance of a
network. This metric is used to measure
such collisions in the network.
Energy Consumption: Total energy
consumed in the network is energy consumption. It is measured in mWhr.
In our simulations, we will study the effect of
DDoS attacks under the following conditions: Different number of attackers; and
Different node mobility
7.3.IMPLEMENTATION DETAILS
7.3.1.Simulation Procedure in GloMoSim
First, we need to specify the necessary input
parameters in the Config.in file as said above. For
our simulation procedure, we have been specific
about certain parameters as mentioned below in
Table 7.2 to enable hassle free simulation.
These parameters were adhered to for the
whole process of experimentation with the new
protocol. A copy of the config.in file used for the
simulation is given below for reference.
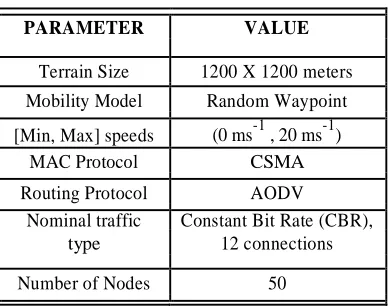
Table 7.2: Specific Parameters for Experiment.
PARAMETER VALUE
Terrain Size 1200 X 1200 meters
Mobility Model Random Waypoint
[Min, Max] speeds (0 ms-1 , 20 ms-1)
MAC Protocol CSMA
Routing Protocol AODV
Nominal traffic Constant Bit Rate (CBR),
type 12 connections
Number of Nodes 50
To simulate any network we have to
specify parameters in config.in file. After
specifying the configuration parameters, we need
to define the Source, destination and other details
in the application.config file. We have used the
CBR (constant bit rate) traffic generator. The other
traffic generators could be used as well. After
specifying these two input files, if we mention that
the node placement should be according to a
placement file, then we need to mention the co
ordinates in a separate file called nodes.input. We
have chosen uniform node placement. So, no need
to specify this file.
[root@localhost ~]# cd
Desktop/glomosim-2.03/glomosim/main
[root@localhost main]# make
This is a batch file. This contains appropriate calls
to the parsec compiler. This results in creation of
the GloMoSim.exe file, which is to be used for
simulation.
[root@localhost ~]# cd
Desktop/glomosim-2.03/glomosim/bin
[root@localhost bin]# ./glomosim config.in
This is to start the process of simulation. The exe
file takes in input from the config.in file. When the
above command is executed, the process of
simulation starts. Execution file is enclosed in
appendix.
This file indicates the end of the simulation
run. GloMoSim internally writes the statistics
required (as specified in the finalize function of the
protocol.pc file). The statistics file generated is
stored in glomo.stat file.
7.4. RESULTS
Two types of DDoS attacks mechanisms are
implemented; first we measure the effect of Packet
All Rights Reserved © 2014 IJDCN performance. Then, we compare these two attack
mechanisms and analyze their effects. In next
section, we analyze the effect of different
prevention techniques and shows that our proposed
technique is better than existing prevention
technique.
7.4.1. Effect of Packet Dropping Based DDoS
Attack Mechanism
7.4.1.1. With Different Number of Attackers
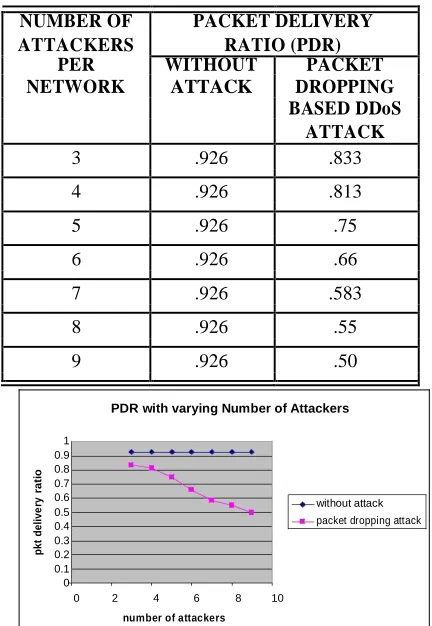
Figure 7.1 show the effects of Packet Dropping
attack mechanism on PDR with different numbers
of attacking slave nodes, which models the
distributed behavior of DDoS attacks and its
corresponding table is Table 7.3. The number of
attackers per network is varied from 3 to 9. The
PDR of the network decreases rapidly when it is
subject to attacks. When the number of attacker is
0, the network performance does not seem to
deteriorate significantly as traffic has not reached
saturation point. However, as the number of
attackers increases, there are more packets (both
legitimate and illegitimate) which compete for
channel access in the shared wireless medium.
This leads to a drop in the packet delivery ratio.
Table 7.3: Effect of Packet Dropping on Packet
Delivery Ratio with varying number of
attackers.
NUMBER OF PACKET DELIVERY
ATTACKERS RATIO (PDR)
PER WITHOUT PACKET
NETWORK ATTACK DROPPING
BASED DDoS ATTACK
3 .926 .833
4 .926 .813
5 .926 .75
6 .926 .66
7 .926 .583
8 .926 .55
9 .926 .50
PDR with varying Number of Attackers
1
0.9
ra
ti
o 0.8
0.7 0.6
d
e
li
v
e
ry without attack
0.5
packet dropping attack 0.4
0.3
p
k
t
0.2 0.1 0
0 2 4 6 8 10
number of attackers
Figure 7.1: Effect of Packet Dropping on PDR
with varying no. of attackers.
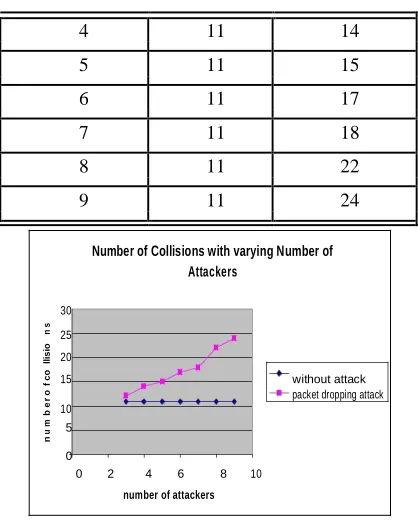
Table 7.4 and Figure 7.2 shows the effect
of packet dropping attack on number of collisions
per network with varying number of attackers. As
the number of attackers increases, it causes
increase in number of collisions i.e. packets are
unable to reach at their destination. Thus, we can
predict that as the number of attackers increases,
the performance of the network will deteriorate
even further.
Table 7.4: Effect of Packet Dropping on Number
All Rights Reserved © 2014 IJDCN
4 11 14
5 11 15
6 11 17
7 11 18
8 11 22
9 11 24
Number of Collisions with varying Number of
Attackers
30
n
s
25
ll
is
io
20
f
c
o
15 without attack
r
o packet dropping attack
b
e 10
u
m 5
n
0
0 2 4 6 8 10
number of attackers
Figure 7.2: Effect of Packet Dropping on
Number of Collisions with varying number of
attackers.
Table 7.5 and Figure 7.3 shows the effect
of packet dropping attack on energy consumption
with varying number of attackers. As the number
of attackers increases energy consumption
decreases because node behaving as selfish node
because in packet dropping attack node drops the
packets send to it for further forwarding even
when no congestion occur. Selfish node does not
send packet to the destination node in order to save
energy i.e. why energy decreases.
Table 7.5: Effect of Packet Dropping on Energy
Consumption with varying number of attackers.
NUMBER OF ENERGY CONSUMPTION
ATTACKERS (MWHR)
PER WITHOUT PACKET
NETWORK ATTACK DROPPING
BASED DDoS ATTACK
3 5.010 5.009
4 5.010 5.008
5 5.010 5.0075
6 5.010 5.007
7 5.010 5.0065
8 5.010 5.006
9 5.010 5.005
Energy Consumption with varying Number of Attackers
r
)
5.011
h
W
5.01
n(m5.009
ptio5.008
without attack
m
5.007 packet dropping attack
u
s
n
5.006
o
c
gy5.005 r
Figure 7.3: Effect of Packet n Dropping on Energy
5. 004
e
0 2 4 6 8 10
Consumption with varying number of attackers.
number of attackers
7.4.1.2. With Varying Node Mobility
In this set of experiment, we evaluate the effect of
Packet Dropping Based DDoS attacks when the
nodes in the network move at different speeds. We
use the Random Waypoint mobility model with a
pause time of 0s, which emulates continuous
random motion. There are maximum 9 slave
attackers in the network.
All Rights Reserved © 2014 IJDCN affected by DDoS attacks (especially if traffic rate
is low).
Table 7.6: Effect of Packet Dropping on Packet
Delivery Ratio with varying node mobility.
PACKET DELIVERY RATIO
MOBILI (PDR)
TY WITHO WITH 3 WITH 8
UT ATTACK ATTACK
ATTAC ERS ERS
K
0-5 .926 .833 .55
5-10 .916 .825 .526
10-15 .905 .797 .506
15-20 .898 .727 .491
PDR with varying Node Mobility
1
0.9 0.8
t i o
a0.7
r
without attack y0.6
r
e
with 3 attackers
v0.5
i
l
e0.4
with 8 attackers
d
t
0. 3
k
p
0.2
0.1
0
0 5 10 15 20 25
speed (m/s)
Figure 7.4: Effect of Packet Dropping on Packet
Delivery Ratio with varying node mobility.
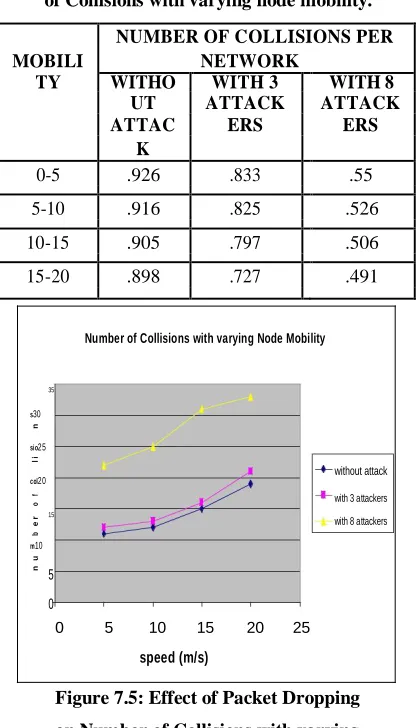
Figure 7.5 and Table 7.7 shows the effect
of Packet dropping on number of collisions when
speeds of nodes are increased. As the node
mobility increases, link breakage occurs more
frequently and this leads to the more collisions in
the network. So, as the node mobility increases
number of collisions also increases.
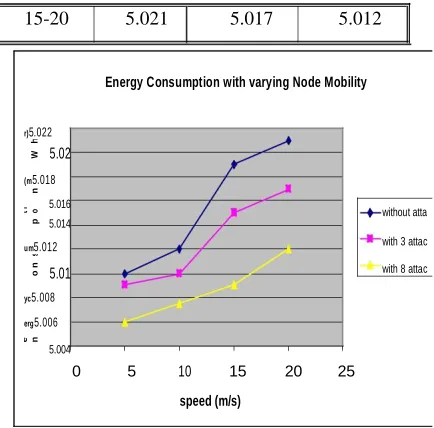
Figure 7.6 and Table 7.8 shows the effect of Packet dropping on Energy Consumption when speeds of nodes are increased. As the node mobility
increases, link breakage occurs more frequently, this leads to the more route repair and maintenance. So, more energy is consumed in route repair or to establish new path. Hence, as the node mobility increases energy consumption also increases.
Table 7.7: Effect of Packet Dropping on Number
of Collisions with varying node mobility.
NUMBER OF COLLISIONS PER
MOBILI NETWORK
TY WITHO WITH 3 WITH 8
UT ATTACK ATTACK
ATTAC ERS ERS
K
0-5 .926 .833 .55
5-10 .916 .825 .526
10-15 .905 .797 .506
15-20 .898 .727 .491
Number of Collisions with varying Node Mobility
35
s30
n
sio25
l i
without attack
col20
with 3 attackers
f
o
15
e
r with 8 attackers
b
m10
u
n
5
0
0 5 10 15 20 25
speed (m/s)
Figure 7.5: Effect of Packet Dropping
on Number of Collisions with varying
node mobility.
Table 7.8: Effect of Packet Dropping on Energy
Consumption with varying node mobility.
ENERGY CONSUMPTION
MOBILI (MWHR)
TY WITHO WITH 3 WITH 8
UT ATTACK ATTACK
ATTAC ERS ERS
K
0-5 5.010 5.009 5.006
5-10 5.012 5.010 5.0075
All Rights Reserved © 2014 IJDCN
15-20 5.021 5.017 5.012
Energy Consumption with varying Node Mobility
r)5.022
h
5.02
W
(m5.018
n
5.016
t
i o
without atta 5.014
p
with 3 attac
um5.012 s
with 8 attac
o
n
5.01
yc5.008
erg5.006 e n
5.004
0 5 10 15 20 25
speed (m/s)
Figure 7.6: Effect of Packet Dropping on Energy
Consumption with varying node mobility.
7.4.2. Effect of Flooding Based DDoS Attack
Mechanism
7.4.2.1. With Different Number of Attackers
Figure 7.7 show the effects of flooding attack mechanism on PDR with different numbers of attacking slave nodes, which models the distributed behavior of DDoS attacks and its corresponding table is Table 7.9. The number of attackers is varied from 3 to 9. The PDR of the network decreases rapidly when it is subject to attacks because large number of RREQs is initiated in the network and network is flooded with these route requests and no bandwidth is available to transfer data packets successfully. When the number of attacker is 0, the network performance does not seem to deteriorate significantly as traffic has not reached saturation point. However, as the number of attackers increases, there are more packets (both legitimate and illegitimate) which compete for channel access in the shared wireless medium. This leads to a drop in the packet delivery ratio.
Table 7.10 and Figure 7.8 shows the effect of flooding attack on number of collisions with varying number of attackers. As the number of
attackers increases, it causes increase in number of
collisions both at sender and receiver end i.e.
packets are unable to reach at their destination,
they are discarded. Thus, we can predict that as the
number of attackers increases, the performance of
the network will deteriorate even further.
Table 7.9: Effect of Flooding on Packet Delivery
Ratio with varying number of attackers.
NUMBER OF PACKET DELIVERY
ATTACKERS RATIO (PDR)
PER WITHOUT FLOODING
NETWORK ATTACK BASED DDoS
ATTACK
3 .926 .32
4 .926 .31
5 .926 .22
6 .926 .20
7 .926 .175
8 .926 .15
9 .926 .12
PDR with varying Number of Attackers
1
0.9
a
t
i
o 0.8
0.7
y
r 0.6
without attack
v
e
r
0.5
flooding attack
e
l
i
0.4
d
0.3
t
p
k
0.2
0.1
0
0 2 4 6 8 10
number of attackers
Figure 7.7: Effect of Flooding on Packet
Delivery Ratio with varying number of
All Rights Reserved © 2014 IJDCN Table 7.10: Effect of Flooding on Number of
Collisions with varying number of attackers.
NUMBER OF NUMBER OF COLLISIONS
ATTACKERS PER NETWORK
PER WITHOUT FLOODING
NETWORK ATTACK BASED DDoS
ATTACK
3 11 8543
4 11 8571
5 11 8685
6 11 8741
7 11 8756
8 11 8897
9 11 8918
Number of Collisions with varying Number of
Attackers
10000
8000
6000
without attack
4000
flood attack
2000
0
0 2 4 6 8 10
number of attackers
Figure 7.8: Effect of Flooding on Number of
Collisions with varying number of attackers.
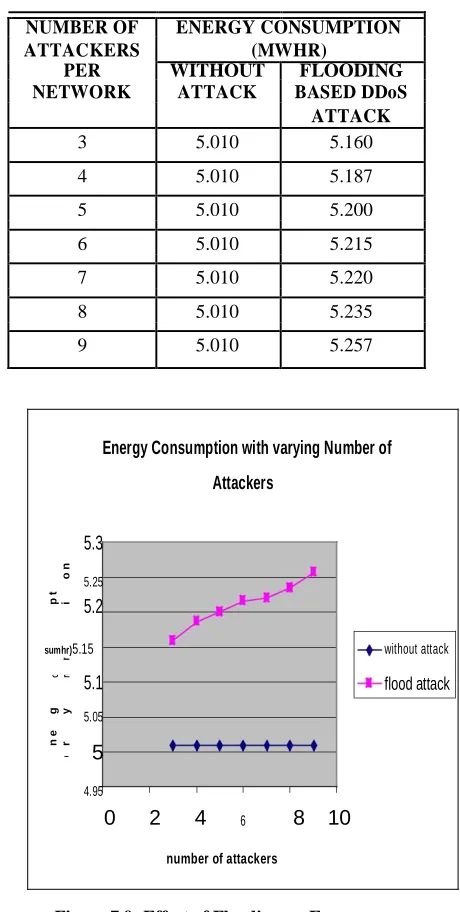
Table 7.11 and Figure 7.9 shows the effect of flooding attack on energy consumption with varying number of attackers. As the number of attackers increases energy consumption increases because flood attack involves attacker sending large volumes of traffic to a victim node, to congest the victim node’s network bandwidth and route does established. To establish the routes in the network requires lots of energy. Thus, we can
predict that as the number of attacker increases
energy consumption also increases.
Table 7.11: Effect of Flooding on Energy
Consumption with varying number of attackers.
NUMBER OF ENERGY CONSUMPTION
ATTACKERS (MWHR)
PER WITHOUT FLOODING
NETWORK ATTACK BASED DDoS
ATTACK
3 5.010 5.160
4 5.010 5.187
5 5.010 5.200
6 5.010 5.215
7 5.010 5.220
8 5.010 5.235
9 5.010 5.257
Energy Consumption with varying Number of
Attackers
5.3
o
n
5.25
p
t
i 5.2
sumhr)5.15 without attack
nW
5.1 flood attack
c o m
(
g y
5.05
n
e
r
5
e
4.95
0 2 4 6 8 10
number of attackers
Figure 7.9: Effect of Flooding on Energy
Consumption with varying number of attackers.
7.4.2.2. With Varying Node Mobility
In this set of experiment, we evaluate the effect of
Flooding Based DDoS attacks when the nodes in
the network move at different speeds. We use the
All Rights Reserved © 2014 IJDCN time of 0s, which emulates continuous random
motion. There are maximum 9 slave attackers in
the network. Figure 7.10 and Table 7.12 shows the
effect of flooding attacks on PDR, when the speeds
of the nodes are increased. As node mobility
increases, link breakages occur more frequently
and lead to route repairs and maintenance. This
increases the overhead in the network, thus
causing the network performance to deteriorate
and packet delivery ratio (i.e. number of packets
successfully transmitted) decreases.
Table 7.12: Effect of Flooding on PDR with
varying node mobility.
PACKET DELIVERY RATIO
MOBILI (PDR)
TY WITHO WITH 3 WITH 8
UT ATTACK ATTACK
ATTAC ERS ERS
K
0-5 .926 .32 .15
5-10 .916 .254 .135
10-15 .905 .204 .110
15-20 .898 .13 .083
PDR with varying Node Mobility
1
0.9 0.8
atio0.7
yr0.6 without attack
ver0.5 with 3 attacker
eli0.4
with 8 attacker
d
kt0.3
p
0.2
0.1
0
0 5 10 15 20 25
speed (m/s)
Figure 7.10: Effect of Flooding on PDR with varying node mobility
Figure 7.11 and Table 7.13 shows the effect of flooding on number of collisions when speeds of nodes are increased. As the node mobility
increases, link breakage occurs more frequently
and this leads to the more collisions in the network.
So, as the node mobility increases number of
collisions also increases. Figure and Table shows
that nodes speeds increases the number of
collisions but in case of flood attack this increase is
very less as compare to number of attackers.
Table 7.13: Effect of Flooding on Number of
Collisions with varying node mobility.
NUMBER OF COLLISIONS
MOBILITY PER NETWORK
WITHOUT FLOODING
ATTACK BASED DDoS
ATTACK (3 ATTACKERS)
0-5 11 8543
5-10 12 8900
10-15 15 8957
15-20 19 9010
Number of Collisions with varying Node Mobility
10000
n s
9000 8000
i
s
i
o
7000
l l
6000
c
o without attack
5000
f
o
with 3 attackers
4000
r
b e
3000
u m 2000
n
1000 0
0 5 10 15 20 25
speed (m/s)
Figure 7.11: Effect of Flooding on Number of
Collisions with varying node mobility.
All Rights Reserved © 2014 IJDCN establish new path. Hence, as the node mobility
increases energy consumption also increases.
Table 7.14: Effect of Flooding on Energy
Consumption with varying node mobility.
ENERGY CONSUMPTION
MOBILI (MWHR)
TY WITHO WITH 3 WITH 8
UT ATTACK ATTACK
ATTAC ERS ERS
K
0-5 5.010 5.160 5.230
5-10 5.012 5.169 5.235
10-15 5.019 5.177 5.240
15-20 5.021 5.188 5.250
Energy Consumption with varying Node Mobility
r
) 5.3
Wh5.25
n
(
m
5.2
ti
o
5.15
without attack
m
p
with 3 attack ers 5.1
n
s
u
with 8 attack ers
co5.05
r
g
y
5
e
n
e
4.95
0 5 10 15 20 25
speed (m/s)
Figure 7.12: Effect of Flooding on Energy
Consumption with varying node mobility.
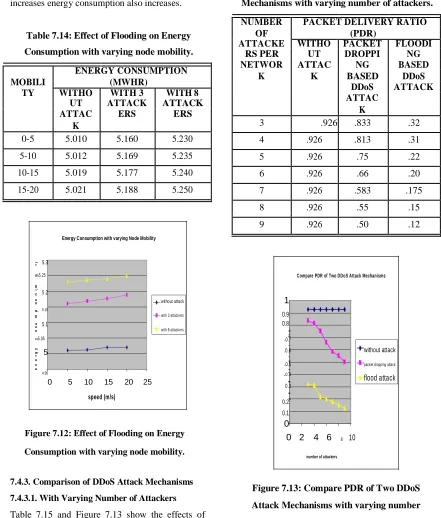
7.4.3. Comparison of DDoS Attack Mechanisms
7.4.3.1. With Varying Number of Attackers
Table 7.15 and Figure 7.13 show the effects of
different attack mechanism on packet delivery
ratio. From the table it is clear that flooding based
DDoS attack has greater effect on PDR. As shown
in the table PDR of Flooding is very less as
compare to Packet Dropping. But it is easy to
prevent than packet dropping.
Table 7.15: Compare PDR of Two DDoS Attack
Mechanisms with varying number of attackers.
NUMBER PACKET DELIVERY RATIO
OF (PDR)
ATTACKE WITHO PACKET FLOODI
RS PER UT DROPPI NG
NETWOR ATTAC NG BASED
K K BASED DDoS
DDoS ATTACK
ATTAC K
3 .926 .833 .32
4 .926 .813 .31
5 .926 .75 .22
6 .926 .66 .20
7 .926 .583 .175
8 .926 .55 .15
9 .926 .50 .12
Compare PDR of Two DDoS Attack Mechanisms
1
0.9
0.8
o
t
i
a0.7
r
without attack
y0.6
r
e
packet dropping attack
v0.5
i
l
e0.4
flood attack
d
t
0.3
k
p
0.2
0.1
0
0 2 4 6 8 10
number of attackers
Figure 7.13: Compare PDR of Two DDoS
Attack Mechanisms with varying number
of attackers.
7.4.3.2. With Varying Node Mobility
Table 7.16 and Figure 7.14 show the effects of
different attack mechanism on packet delivery ratio
with varying node mobility. From the table it is
All Rights Reserved © 2014 IJDCN effect on PDR. As shown in the table PDR of
Flooding is very less as compare to Packet
Dropping for 3 attackers.
Table 7.16: Compare PDR of Two DDoS Attack
Mechanisms with varying node mobility.
PACKET DELIVERY RATIO
MOBILI
(PDR)
WITHO PACKET FLOODI
TY UT DROPPI NG
ATTAC NG BASED
K BASED DDoS
DDoS ATTACK
ATTACK
0-5 .926 .833 .32
5-10 .926 .825 .254
10-15 .926 .797 .204
15-20 .926 .727 .13
Compare PDR of Two DDoS Attack Mechanisms
1
0.9
0.8
atio0.7
yr0.6 without attack
ver0.5 packet dropping attack
eli0.4
flood attack
d
0.3
t
k
p
0.2
0.1 0
0 5 10 15 20 25
speed (m/s)
Figure 7.14: Compare PDR of Two DDoS
Attack Mechanisms with varying node mobility.
7.4.4. Prevention Technique for Flooding
Attack 7.4.4.1. Existing Prevention Scheme
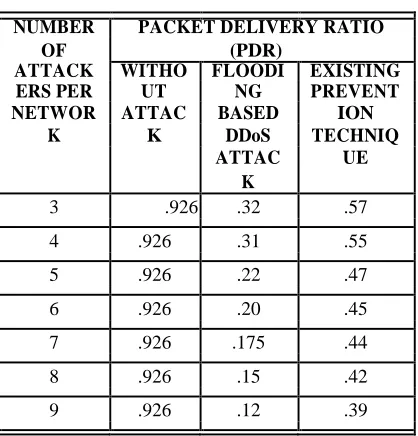
7.4.4.1.1. With Different Number of Attackers
Table 7.17 and Figure 7.15 show the effect of existing prevention technique on PDR with different number of attackers per network. Existing Prevention Technique uses the function Handle RREQ & Retry RREQ to prevent flood based DDoS attack. Figure shows that existing prevention technique mitigates the effect of flooding based DDoS attack to some extent and compares the results of flood attack and existing technique. By using this technique PDR increases up to 45 % as compare to the PDR of flooding based attack.
Table 7.17: Effect on PDR of Existing
Prevention Technique with varying number of
attackers.
NUMBER PACKET DELIVERY RATIO
OF (PDR)
ATTACK WITHO FLOODI EXISTING
ERS PER UT NG PREVENT
NETWOR ATTAC BASED ION
K K DDoS TECHNIQ
ATTAC UE
K
3 .926 .32 .57
4 .926 .31 .55
5 .926 .22 .47
6 .926 .20 .45
7 .926 .175 .44
8 .926 .15 .42
9 .926 .12 .39
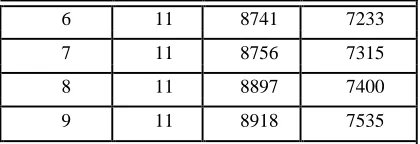
Table 7.18 and Figure 7.16 show the
effect of existing prevention technique on Number
of Collisions with different number of attackers.
This figure shows that existing prevention
technique (use of function Handle RREQ & Retry
RREQ) mitigate the effect of flooding based DDoS
attack to some extent. By using this technique
Number of Collisions decreases up to 20 % as
All Rights Reserved © 2014 IJDCN
Prevention of Flood Attack using Existing
Prevention Technique
c
o
ll
is
io
n
s
10000
8000 without attack
6000 with attack
of
4000
n
u
m
b
e
r
existing prevention
2000 technique
0
0 2 4 6 8 10
number of attackers
Prevention of Flood Attack using Existing
Prevention Technique
1
io0.8 t without attack
a
r
ry0.6
with attack
e
l i v
e0.4 d
existing prevention
t
k
technique
p0.20
0 2
4
6
810
number of attackers
Figure 7.15: Effect on PDR of Existing
Prevention Technique with varying number
of attackers.
Table 7.18: Effect on Number of Collisions
of Existing Prevention Technique with
varying number of attackers.
NUMBER NUMBER OF COLLISIONS PER
OF NETWORK
ATTACK WITHO FLOODI EXISTING
ERS PER UT NG PREVENT
NETWOR ATTAC BASED ION
K K DDoS TECHNIQ
ATTAC UE
K
3 11 8543 7055
4 11 8571 7091
5 11 8685 7175
6 11 8741 7233
7 11 8756 7315
8 11 8897 7400
9 11 8918 7535
Figure 7.16: Effect on Number of collisions of
Existing Prevention Technique with varying
number of attackers.
Table 7.19 and Figure 7.17 show the
effect of existing prevention technique on Energy
Consumption with different number of attackers.
This figure shows that existing prevention
technique (use of function Handle RREQ & Retry
RREQ) mitigate the effect of flooding based DDoS
attack to some extent.
Table 7.19: Effect on Energy consumption of
Existing Prevention Technique with varying
number of attackers.
NUMBER ENERGY CONSUMPTION
OF (MWHR)
ATTACK WITHO FLOODI EXISTING
ERS PER UT NG PREVENT
NETWOR ATTAC BASED ION
K K DDoS TECHNIQ
ATTAC UE
K
3 5.010 5.16 5.15
4 5.010 5.187 5.162
5 5.010 5.200 5.179
6 5.010 5.215 5.188
7 5.010 5.22 5.197
8 5.010 5.235 5.205
9 5.010 5.257 5.210
All Rights Reserved © 2014 IJDCN
Prevention of Flood Attack using Existing
Prevention Technique
5.3
n
5.25
t
i
o without attack
5.2
p
m )
r
with attack suh5.15 nW
5.1
c o m
(
existing prevention g y
5.05
r
technique
n e 5
e
4.95
0 2 4 6 8 10
number of attackers
Figure 7.17: Effect on Energy consumption
of Existing Prevention Technique with
varying number of attackers.
7.4.4.1.2. With Varying Node Mobility
Table 7.20 and Figure 7.18 show the effect of
existing prevention technique on PDR with
increase in nodes speeds and number of attackers
are 8. This figure shows that existing prevention
technique (use of function Handle RREQ & Retry
RREQ) mitigate the effect of flooding based DDoS
attack to some extent. By using this technique
PDR increases up to 65% as compare to the PDR
of flooding based attack.
Table 7.20: Effect on PDR of Existing
Prevention Technique with varying node
mobility.
PACKET DELIVERY RATIO
MOBILI
(PDR)
WITHO FLOODI EXISTING
TY UT NG PREVENTI
ATTAC BASED ON
K DDoS TECHNIQ
ATTACK UE
0-5 .926 .15 .42
5-10 .916 .135 .38
10-15 .905 .110 .36
15-20 .898 .083 .24
Prevention of Flood Attack using Existing
Prevention Technique
1
io0.8 without attack
r a t
ry0.6 e with attack
eliv0.4
existing prevention
d
pkt0.2 technique
0
0 5 10 15 20 25
speed (m/s)
Figure 7.18: Effect on PDR of Existing
Prevention Technique with varying node
mobility.
Table 7.21 and Figure 7.19 show the
effect of existing prevention technique on Number
of Collisions with different node mobility and
number of attackers are 8. This figure shows that
existing prevention technique (use of function
Handle RREQ & Retry RREQ) mitigate the effect
of flooding based DDoS attack to some extent. By
using this technique Number of Collisions
decreases up to 20% as compare to the collisions
of flood attack
Table 7.21: Effect on Number of Collisions of
Existing Prevention Technique with varying
node mobility.
NUMBER OF COLLISIONS PER
MOBILI
NETWORK
WITHO FLOODI EXISTING
TY UT NG PREVENTI
ATTAC BASED ON
K DDoS TECHNIQ
ATTACK UE
0-5 11 8897 7400
All Rights Reserved © 2014 IJDCN
10-15 15 9117 7615
15-20 19 9273 7725
Prevention of Flood Attack using Existing
Prevention Technique
10000
s
i
o
n
8000 without attack
l l i s
6000
c
o with attack
f
o
4000
b
e
r
existing prevention
m
2000 technique
u
n
0
0 5 10 15 20 25
speed (m/s)
Figure 7.19: Effect on Number of Collisions of
Existing Prevention Technique with varying
node mobility.
Table 7.22 and Figure 7.20 show the
effect of existing prevention technique on Energy
Consumption with varying node mobility and
number of attackers are 8. This figure shows that
existing prevention technique (use of function
Handle RREQ & Retry RREQ) mitigate the effect
of flooding based DDoS attack to some extent.
Table 7.22: Effect on Energy Consumption of
Existing Prevention Technique with varying
node mobility.
ENERGY CONSUMPTION
MOBILI
(MWHR)
WITHO FLOODI EXISTING
TY UT NG PREVENTI
ATTAC BASED ON
K DDoS TECHNIQ
ATTACK UE
0-5 5.010 5.230 5.205
5-10 5.012 5.235 5.210
10-15 5.019 5.240 5.222
15-20 5.021 5.250 5.230
Prevention of Flood Attack using Existing Prevention Technique
5.3
n
5.25
t
i
o
without attack 5.2
p
sumhr)5.15 nW with attack
5.1
c o m
(
existing prevention
y
5.05
e
r g
5 technique
n
e
4.95
0 5 10 15 20 25
speed (m/s)
Figure 7.20: Effect on Energy Consumption
of Existing Prevention Technique with
varying node mobility.
7.4.4.2. Proposed Prevention Scheme
7.4.4.2.1. With Different Number of Attackers
Table 7.23 and Figure 7.21 show the effect of
proposed prevention technique on PDR with
different number of attackers and it also shows
comparison with the existing prevention scheme.
This figure shows that proposed prevention
technique (By disabling IP Broadcast) mitigate the
effect of flooding based DDoS attack with larger
extent. By using this technique PDR increases up
to 31% as compared to the PDR of existing
prevention scheme and 69% as compared to flood
attack.
All Rights Reserved © 2014 IJDCN mitigate the effect of flooding based DDoS attack
with larger extent. By using this technique number
of collisions decreases up to 41% as compared to
the collisions of existing prevention scheme and
51.5% as compared to flood based DDoS attack.
Table 7.23: Effect of Proposed Prevention
Technique on PDR with varying number of
attackers.
NUMB PACKET DELIVERY RATIO (PDR)
ER OF FLOO EXISTI PROPO
ATTA WIT DING NG SED
CKER HOU BASE PREVE PREVE
S PER T D NTION NTION
NETW ATT DDoS TECHN TECHN
ORK ACK ATTA IQUE IQUE
CK
3 .92 .32 .57 .83
4 .926 .31 .55 .82
5 .926 .22 .47 .72
6 .926 .20 .45 .69
7 .926 .175 .44 .58
8 .926 .15 .42 .57
9 .926 .12 .39 .56
Compare PDR of two Prevention Techniques with
varying Number of Attackers
1
o0.8
a
t i
without attack
r
ry0.6 e
with flood attack
liv0.4
existing technique
t
d
e
proposed technique
k
p0.2
0
0 2 4 6
810
number of attackers
Figure 7.21: Effect of Proposed Prevention
Technique on PDR with varying number
of attackers.
Table 7.24: Effect of Proposed Prevention
Technique on Number of Collisions with
varying number of attackers.
NUMB NUMBER OF COLLISIONS PER
ER OF NETWORK
ATTA FLOO EXISTI PROPO
CKER WIT DING NG SED
S PER HOU BASE PREVE PREVE
NETW T D NTION NTION
ORK ATT DDoS TECHN TECHN
ACK ATTA IQUE IQUE
CK
3 11 8543 7055 3955
4 11 8571 7091 4018
5 11 8685 7175 4175
6 11 8741 7233 4210
7 11 8756 7315 4315
8 11 8897 7400 4400
9 11 8918 7535 4535
Compare Number of Collisions of two Prevention
Techniques with varying Number of Attackers
10000
i
o
n
s
8000
without attack
l i
s
c
o
l
6000
with flood attack
r
o
f
4000
existing technique
b
e proposed technique
m 2000
n
u
0
0 2 4 6 8 10
number of attackers
Figure 7.22: Effect of Proposed Prevention
Technique on Number of Collisions with varying
All Rights Reserved © 2014 IJDCN Table 7.25 and Figure 7.23 show the
effect of proposed prevention technique on Energy
Consumption with different number of attackers
and it also shows comparison with the existing
prevention scheme. This figure shows that
proposed prevention technique (By disabling IP
Broadcast) mitigate the effect of flooding based
DDoS attack with larger extent.
Table 7.25: Effect of Proposed Prevention
Technique on Energy Consumption with
varying number of attackers.
NUMB ENERGY CONSUMPTION
ER OF (MWHR)
ATTA FLOO EXISTI PROPO
CKER WIT DING NG SED
S PER HOU BASE PREVE PREVE
NETW T D NTION NTION
ORK ATT DDoS TECHN TECHN
ACK ATTA IQUE IQUE
CK
3 5.010 5.16 5.15 5.080
4 5.010 5.187 5.162 5.090
5 5.010 5.200 5.179 5.114
6 5.010 5.215 5.188 5.119
7 5.010 5.22 5.197 5.139
8 5.010 5.235 5.205 5.146
9 5.010 5.257 5.210 5.180
Compare Energy Consumption of two Prevention
Techniques with varying Number of Attackers
5.3
o
n
5.25
p
t
i
5.2 without attack
s
u
m
hr
)
5.15 with flood attack
n W
5.1 existing technique
c o ( m
g y 5.05 proposed technique
n
e
r
5
e
4.95
0 2 4 6 8 10 number of attackers
Figure 7.23: Effect of Proposed Prevention
Technique on Energy Consumption with
varying number of attackers.
7.4.4.2.2. With Varying Node Mobility
Table 7.26 and Figure 7.24 show the effect of
proposed prevention technique on PDR with
varying node mobility and number of attackers are
8. It also shows comparison with the existing
prevention scheme. This figure shows that
proposed prevention technique (By disabling IP
Broadcast) mitigate the effect of flooding based
DDoS attack with larger extent. By using this
technique PDR increases up to 47% as compared
to the PDR of existing prevention scheme.
Table 7.26: Effect of Proposed Prevention
Technique on PDR with varying node mobility.
PACKET DELIVERY RATIO (PDR)
MOBI
FLOO EXISTI PROPO
WITH DING NG SED
LITY OUT BASE PREVE PREVE
ATTA D NTION NTION
CK DDoS TECHN TECHN
ATTA IQUE IQUE
CK
0-5 .926 .15 .42 .57
5-10 .916 .135 .38 .53
All Rights Reserved © 2014 IJDCN
15-20 .898 .083 .24 .47
Compare PDR of two Prevention Techniques with varying Node Mobility
1
io0.8 r a t
without attack
ry0.6 with flood attack
live0.4 existing technique
t d e
proposed technique
pk0.2
0
0 5 10 15 20 25
speed (m/s)
Figure 7.24: Effect of Proposed Prevention Technique on PDR with varying node mobility.
Table 7.27 and Figure 7.25 show the
effect of proposed prevention technique on
Number of Collisions with varying node
mobility and number of attackers are 8. It also
shows comparison with the existing prevention
scheme. This figure shows that proposed
prevention technique (By disabling IP
Broadcast) mitigate the effect of flooding based
DDoS attack with larger extent. By using this
technique number of collisions decreases up to
39.5% as compared to collisions of existing
prevention scheme.
Table 7.27: Effect of Proposed Prevention
Technique on Number of Collisions with varying
node mobility.
NUMBER OF COLLISIONS PER
MOBI
NETWORK
FLOO EXISTI PROPO
LITY WITH DING NG SED
OUT BASE PREVE PREVE
ATTA D NTION NTION
CK DDoS TECHN TECHN
ATTA IQUE IQUE
CK
0-5 11 8897 7400 4400
5-10 12 9013 7535 4515
Compare Number of Collisions of two Prevention
Techniques with varying Node Mobility
10000
o
n
s
8000
l i
s
i
without attack
c
o
l
6000 with flood attack
r o
f
4000 existing technique
b
e proposed technique
m 2000
n
u
0
0 5 10 15 20 25
speed (m/s)
Figure 7.25: Effect of Proposed Prevention
Technique on Number of Collisions with varying
node mobility.
Table 7.28 and Figure 7.26
show the effect of proposed prevention
technique on Energy Consumption with
varying node mobility and number of
attackers are 8. It also shows
comparison with the existing
prevention scheme. This figure shows
that proposed prevention technique (By
All Rights Reserved © 2014 IJDCN effect of flooding based DDoS attack
with larger extent.
Table 7.28: Effect of Proposed Prevention
Technique on Energy Consumption with
varying node mobility.
Compare Energy Consumption of two Prevention
Techniques with varying Node Mobility
5.3
o
n
5.25
t i
5.2 without attack
p
m )
r
with flood attack suh5.15 nW
5.1 existing technique
o
c m
(
g y
5.05 proposed technique
r
e
5
n
e
4.95
0 5 10 15 20 25
speed (m/s)
Figure 7.26: Effect of Proposed Prevention
Technique on Energy Consumption
with varying node mobility.
7.5. SUMMARY
This chapter presents DDoS based attack
mechanisms. Two types of DDoS attack
mechanisms are analyzed. They are: Packet
Dropping Based DDoS Attack and Flooding
Based DDoS Attack. Their effects on Packet
Delivery Ratio (PDR), on Number of
Collisions and on Energy Consumption are
analyzed under different number of attackers
and with varying node mobility are analyzed.
Then, comparison between Flooding and
Packet Dropping based DDoS attack is
analyzed, which shows that flooding attack has
greater impact on network performance, but
study of different papers shows that it is easy to
prevent than packet dropping attack. Next,
Prevention techniques for flood attack are
analyzed. Figure from 7.21 to 7.26 show that
proposed prevention scheme is better than
existing prevention scheme and mitigate the
effect of flooding attack to greater extent.
Different results analyzed are:
By using existing prevention technique Packet Delivery Ratio increases up to 45
%as compared to Packet Delivery Ratio of
flooding based attack with varying number of
attackers and by using proposed prevention
technique Packet Delivery Ratio increases up
to 31% as compared to the Packet Delivery
Ratio of existing prevention scheme and 69%
as compared to flood attack.
By using existing prevention technique Number of Collisions decreases up to 20
%as compared to collisions of flooding based
attack with varying number of attackers and by
using proposed prevention technique Number
of collisions decreases up to 41% as compared
to the collisions of existing prevention scheme
and 51.5% as compared to flood based DDoS
attack.
By using existing prevention technique Packet Delivery Ratio increases up to 65% ascompared to Packet Delivery Ratio of flooding
based attack with varying node mobility and
by using Proposed Prevention Technique
Packet Delivery Ratio increases up to 47% as
compared to the Packet Delivery Ratio of
existing prevention scheme.
By using existing prevention technique Number of Collisions decreases up to 20
%as compared to collisions of flooding based
attack with varying node mobility and by
All Rights Reserved © 2014 IJDCN of collisions decreases up to 39.5% as
compared to the collisions of existing
prevention scheme.
All these results show that proposed prevention
technique is better than existing technique.
8.1. CONCLUSION
Detection & Prevention of DDoS attacks is a part
of an overall risk management strategy for an
organization. Each organization must identify the
most important DDoS risks, and implement a
cost-effective set of defense mechanisms against those
attack types causing the highest risk for business
continuity. Studies and news about real-life DDoS
attacks indicate that these attacks are not only
among the most prevalent network security risks,
but that these attacks can also block whole
organizations out of the Internet for the duration of
an attack. The risk from DDoS attacks should not
thus be underestimated, but not overestimated,
either.
In the future the problem from DDoS
attacks will most probably increase because the
number of hosts connected in the Internet
increases, access lines get faster, software products
get more complex, and security continues to be
difficult for an ordinary home user and even many
organizations. The more there are hosts in the
Internet, the more of them can potentially be used
for DDoS purposes. The intensity of DDoS attacks
can also increase, as a higher number of hosts can
produce more traffic over faster Internet access
lines. As software gets more complex, more
vulnerability will reside in them to be used for
compromising hosts. The fast pace of new
revisions does not make the situation easier.
Finally, it will continue to be difficult to evaluate
security risks in existing computer systems,
especially by ordinary people.
detect attack type and malicious node were also
studied. Defense mechanisms for Flooding based
DDoS attack were described and analyzed. The
main contributions of this thesis are the following:
First, we have implemented the DDoS attack mechanisms. Two different attack mechanisms are: Ad Hoc Packet Dropping Attack and Ad Hoc Flooding Attack.
Effect of different attack mechanisms on network performance is analyzed and wefind that flooding based DDoS attack have
greater impact on network performance
i.e. network performance decreases more
in case of flooding attack as compare to
packet dropping based DDoS attack their
effectiveness has been demonstrated by
experiments.
Detection mechanisms to detect DDoS attack type and victim node are studiedand a detection scheme is implemented
which help in finding victim/malicious
node. Effectiveness of detection scheme
has been demonstrated by tables and
figures. So that prevention technique is
implemented on that particular node.
Next, two techniques to prevent flooding based DDoS attack are implemented andsimulation results shows that proposed
prevention technique is better than
existing technique. Packet delivery ratio
becomes doubles, number of collisions
and energy consumption decreases or
becomes half by using proposed
prevention technique under different
number of attackers and different node