109
Copyright © 2011-15. Vandana Publications. All Rights Reserved.
Volume-5, Issue-3, June-2015
International Journal of Engineering and Management Research
Page Number: 109-115
Mass Transfer Enhancement Due to the Presence of Double Stage 6 -
Blade Flat Turbine in an Open Electrolytic Cell
P. Mallika Rani1, Prof. N. Chitti Babu2
1
Department of Chemical Engineering, ANITS, Sangivalasa, INDIA
2
Department of Chemical Engineering, Andhra University, Visakhapatnam, INDIA
ABSTRACT
Mass transfer data was obtained by rotating the double stage 6-blade flat turbine in an open electrolytic cell using the LCDT (Limiting Current Density Technique). Data was taken at the microelectrodes fixed on both electrode support and the cell wall. Equimolal concentrations of Potassium Ferri-Ferro cyanide couple (0.01N) with 0.5N (excess) Sodium Hydroxide was taken as an electrolyte. Diffusion controlled cathodic reduction of potassium ferricyanide ion was studied. Variables of interest are rotational speed of the turbine, diameter of the turbine and width of the blade. Regression analysis yielded the following correlations on both the electrode support and cell wall.
Electrode Support: jD =318 Rer-0.9298 (d/de)0.1157 Cell Wall: jD = 191.2 Rer
-0.9617 (d/de
Keywords— LCDT, flat turbine, electrode support,
Response Surface Methodology (RSM).
)0.05332
I.
INTRODUCTION
Different techniques are extensively used for the measurement of mass transfer rates. Dissolution, sublimation, adsorption and electrochemical methods are mostly opted. Several authors have studied dissolution, sublimation and adsorption. However, in last few decades, continuous research activity is undertaken on the enhancement of mass transfer rates using electrochemical method. In an electrochemical process, high mass transfer rates can be achieved by operating the cell at higher flow rates, but the same advantage can be obtained at low flow rates using augmentation techniques since it enhances the mass transfer rates between an electrode and a flowing electrolyte. This work includes the mass transfer enhancement with the insertion of rotating turbines.
6-blade flat turbine comes under the radial flow impeller category. The impellers have good potential to augment the mass transfer rates. The effects of various operating parameters on mass transfer data are optimized using response surface methodology (RSM).
RSM is a combination of mathematical and statistical techniques used for developing, improving and optimizing the processes. It usually contain 3 steps: (1) design and experiments; (2) response surface modeling through regression; (3) optimization. Box Behnken Design (BBD) is used in the present investigation. The mathematical model is given as
2 0
1 1
k k
i i ii i ij i j
i i i j
y
β
β
x
β
x
β
x x
= = <
=
+
∑
+
∑
+
∑∑
+ ∈
- - - - (1) Where y is the response, β0 is the constant, βi is the
linear effect of the input factor xi, βii is the quadratic effect
of input factor xi, βij is the linear interaction effect between
the input factor xiand є is the residual term. Here are some
of the authors included in this paper as reference for experimental, comparision and documentation works. Sedahmed et al [1] obtained mass transfer data by rotating various turbines in a cylindrical vessel. They proposed the following correlations:
ShL = 1.727 Sc0.33 Re0.5 3,350 < Re < 33,500 for
4- blade flat turbine ShL = Sc0.33 Re0.6 3,000 < Re < 60,000 for
4- blade 45º pitched turbine ShL = 0.22 Sc0.33 Re0. 75
Mass transfer augmentation by vibrating the vertical disc electrode in a rectangular electrolytic cell was experimented by Venkata Rao and Venkateswarlu[2]. Results showed that the mass transfer coefficients
110
Copyright © 2011-15. Vandana Publications. All Rights Reserved.
increased with increase in amplitude, frequency of vibration and with decrease in the electrode diameter. Bharathi et al [3] studied the individual and synergetic effects of vibration and rotation of spheres on mass transfer in an open electrolytic cell. The mass transfer data were correlated as follows.
Shv/ Sc1/3 = 0.97 Rev0.49 for vibration
ShL/ Sc1/3 = 0.97 Rer0.68 for rotation
Shv,r/ Sc1/3 = 0.052 (RevRer)0.4 for both rotation and
vibration
Ionic mass transfer at nickel electrodes rotating about their own axes in the center of stationary electrolyte was studied by Eisenberg et al [4]. They proposed the following correlation:
Jdr = 0.0791 Rer-0.3 (1000 < Rer <100000).
Subba Rao and Venkateswarlu [5]obtained mass transfer data using circular cylindrical promoters inserted at the bottom of the cell. Circular cylindrical promoter is found to be more effective than the right angle triangular promoter. The correlation fitted for the data was: jD =
16.6Re-0.55(d/s)0.045. Subbaiah et al [6] obtained limiting current data using a diffusion controlled electrode reaction at point copper electrodes fixed on the electrolytic cell wall in the presence of rectangular turbulence promoters. Correlation developed was: JD = 390Re-0.88(S/H)-0.12.
Better performance was achieved by rotating concave-blade and comb-concave-blade impellers than the standard Rushton impellers and pitched-blade impellers, studied by Chen and Chen [7]. Vaka Ravi et al [8]measured the limiting current data on an electrode support vibrating horizontally in an electro winning cell. El-Shazly et al [9]studied the diffusion controlled corrosion of the base of agitated vessels with flat and conical bottom. From the experimental data, the correlations obtained were:
Sh = 0.586 Sc0.33 Re0.658 (for flat bottom) Sh = 0.204 Sc0.33 Re0.7 (L/r)-0.33 (for conical bottom) Grau and Bisang [10] obtained mass transfer data at a rotating cylindrical electrode of woven-wire meshes for the reduction of ferri-cyanide in an undivided batch reactor. The mass-transfer coefficients for rotating cylinder electrode were approximately three times higher than those obtained with smooth electrodes. Gopala Krishna et al [11]investigated ionic mass transfer in a circular conduit in the presence of a ring promoter. Shrikanth [12] studied combined effect of radial flow 2-blade flat turbine on mass transfer performance in an electrolytic cell. By regression analysis: Shf/Sc1/3 = 0.019 Rer0.12 Ref-0.1 (w/de)0.125.
Swethasri [13] conducted experiments to study the variation in mass transfer coefficient using double stage 2-blade flat turbine in a rectangular electrolytic cell. Proposed correlation for electrode support and cell wall are:
jD = 210.5 Rer-0.906 (d/de)0.0902
jD = 141 Rer-0.952 (d/de
Padma Priya [14] measured mass transfer coefficient using double stage 4-blade flat turbine in a rectangular electrolytic cell. Correlations for electrode support, cell wall are given below:
)0.055
jD = 250.1 Rer-0.915 (d/de)0.124
jD = 153.5 Rer-0.958 (d/de
A 2 mm thick steel sheet is cut into blades of required lengths and widths. The lengths of the blades are 2, 3 and 4 cm and the widths are 0.5, 1 and 1.5 cm. Six blades of same length and width are attached to the bottom of a 0.01 m diameter steel rod at 60
)0.064
Based on the literature survey, the present investigation is undertaken to obtain the mass transfer data on electrode support and cell wall in an open electrolytic cell in the presence of rotating double stage 6-blade flat turbine. Though the mass transfer equations obtained in this case cannot be extended to other types of turbines, this experimentation gives insight into the effectiveness of the double stage 6-blade flat turbine in enhancing mass transfer coefficients in electrolytic cells.
II.
METHODOLOGY
Methodology includes the experimental set-up, preparation of the turbine and experimentation.
Experimental set-up:
The experimental set-up is shown in figure.1. It has an electrolytic cell, a double stage 6-blade flat turbine and a motor. The turbine is rotated by the motor at desired speed. The electrolytic cell is rectangular in shape and has dimensions of: L = 0.6 m, W = 0.2 m, H = 0.22 m. These dimensions are nearly equal to one sixth of an industrial electrochemical cell used in HCL, Ghatsila, Bihar. The cell contains an electrode support(C) and a copper anode(A) as shown in figure.1 they are assembled.16 microelectrodes(M) are fixed in a regular pattern on the electrode support. Copper wires are drawn out through the grooves cut behind surface of the electrode support and soldered to the microelectrodes or point electrodes. Copper wires laden grooves are then covered with araldite. In order to measure the limiting current at the required microelectrode on the electrode support, the other ends of the wires are connected to a selector switch. All the microelectrodes are with the same dimensions. The positions of the microelectrodes on the electrode support are shown in figure.2.
Preparation of the turbine:
0
111
Copyright © 2011-15. Vandana Publications. All Rights Reserved.
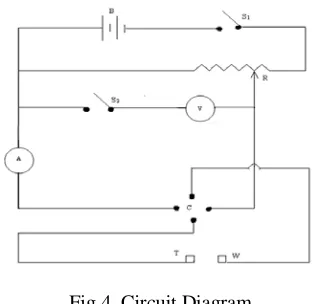
circuit diagram as shown in figure.4. It consists of one voltmeter, one ammeter, a 6V battery, a rheostat, a key, a Commutator and a selector switch which facilitates the measurement of limiting current at desired electrode.
Experimentation:
The electrolyte containing 0.01N potassium ferricyanide and 0.01N potassium ferrocyanide and 0.5N NaOH is prepared in the cell. The turbine is rotated in the stagnant electrolyte at the desired speed. The limiting current data was obtained at all the microelectrodes on the electrode support and cell wall. The limiting current represents the maximum rate of ion discharge. When potential is applied across the microelectrode and copper anode, negligible change in current for considerable increase in voltage indicates the limiting current. The electrochemical reaction occurring at the surface of the electrode is:
Fe(CN)6-3 + e-1 → Fe(CN)6-4 - (2)
The limiting current data is measured for different heights of the turbine from the cell bottom to identify the optimum turbine height for mass transfer coefficient. From the experimental observations, the optimum turbine height is 0.075m. At this optimum height, the experiments are repeated varying the rotational speed, turbine diameter and blade width. 25 L of electrolyte is prepared in the storage tank and transferred to the rectangular open electrolytic cell. The effects of N, d and W are investigated for different electrolyte flow rates. The mass transfer coefficient is calculated from the relation:
kL= I/(nAFCi) - (3)
Range of variables investigated are compiled in Table-1.
III.
RESULTS AND DISCUSSION
The present investigation is undertaken to assess the mass transfer enhancement in the presence of rotation of double stage 6-blade flat turbine in an open electrolytic cell. The enhancement of mass transfer coefficient depends on the flow patterns in the cell. The rotating turbine produces strong rapid currents, high turbulence and intense shear near the turbine surroundings depending on the type of the turbine.
Response Surface Methodology (RSM):
STATISTICA 6.0, a statistical software package was used for regression analysis of the data obtained and Analysis of variance (ANOVA), was utilized to know the goodness of fit of the regression model obtained. Average limiting current density (Y) is function of the H (X1), N
(X2), W (X3), and d (X4). Multiple regression analysis of
the experimental data resulted in the following equation: Y = –1.34 + 10.21 X1 + X2 + 65 X3 + 25.62 X4 – 54.07
X12 –X22 – 2500 X32 – 156.25 X42 -
A positive sign of the coefficient represents an interactive effect which steps up with increase in effect, whereas a negative sign implies that the response lowers with an increase in effect. The optimal set of conditions for
maximum average limiting current density is turbine height from cell bottom (H) = 0.0786 m, turbine rotational speed (N) =1050 rpm, turbine blade width (W) = 0.013 m and turbine diameter (d) = 0.082 m. The extent of augmentation of average limiting current density calculated at these optimum conditions is 0.52 mA. Comparison of optimum values was shown in Table-2. In our study, R
(4)
2
= 0.99826 suggests that 0.17% of the total variations are not adequately explained by the model. 16 micro electrodes were fixed on the electrode support in 4 columns and 4 rows as shown in figure. 2. Each column comprises of 4 electrodes similarly like the row wise electrodes. The limiting current data are measured at all the 16 electrodes on the electrode support likely for the cell wall electrodes too. The average mass transfer coefficient (kLav) is obtained by simple arithmetic average
of all the local mass transfer coefficients. The mass transfer data was obtained at different heights of the 6-blade flat turbine from the cell bottom by keeping other variables constant. The kLav is higher at a turbine height
of 0.075m over kLav values at other heights of the turbine
from cell bottom, shown in figure.5. Hence all other parameters were studied at this turbine height (0.075m) to achieve higher mass transfer coefficients.
Effect of rotation on mass transfer coefficient in stagnant electrolyte
Data on electrode support:
The average mass transfer coefficient is increased with an increase in the rotational speed of the turbine and is proportional to N0.07. Also, kLav increases with an
increase in ‘d’ and is given by d0.116. The kLav is drawn
against vr for different’ and ‘w’ values and the
proportionality is given by vr0.07. The augmentation of
mass transfer coefficient due to rotation is expressed as (kLav/kLo)-1 is shown in figure.6. The analysis of the data
indicates 4.7 to 9.2 fold enhancement in mass transfer coefficient due to rotation of the turbines at the dimensions of w= 0.005 m, d = 0.05 m, N = 250 rpm and w= 0.015 m, d = 0.09 m, N = 1250 rpm. The higher coefficients are due to the turbulence generated by the turbine and the overall flow pattern in the cell section as the turbine induces axial flow along with radial and swirl flows. The data are presented in terms of jD and Rer to account for changes in
physical properties of the electrolyte. The data was correlated by the following equation using regression analysis.
jD = 318 Rer-0.93 (d/de) 0.116
The average deviation is 1.76% and the standard deviation is 2.225%. The correlation plot was given in figure.7. The mass transfer data of Sedahmed et al [1] obtained in a cylindrical agitated vessel and Shrikanth [12] are compared with the present data and shown in the figure.8. The % increase of 6-blade flat turbine over [12] is found to be around 99.99%. It is revealed that present data is higher at lower Reynolds numbers, but the data of Sedahmed is higher at higher Reynolds number. The reason can be
112
Copyright © 2011-15. Vandana Publications. All Rights Reserved.
attributed to the open cell used in the present investigation instead of closed vessel used by Sedahmed et al. The open cell alters the hydrodynamics in the cell and the turbulence generated by the turbine will be generally lessened. Double stage 2[13], 4[14], 6- blade turbines are mutually compared and are shown in the figure.9. The mass transfer data obtained with double stage 6-blade flat turbine is consistently higher than 2-blade and 4-blade flat turbines. From figure.9, net increase in mass transfer rates of double stage 6-blade flat turbine over [13] is 53.5% and with [14] is 52.7%.
Data on cell wall:
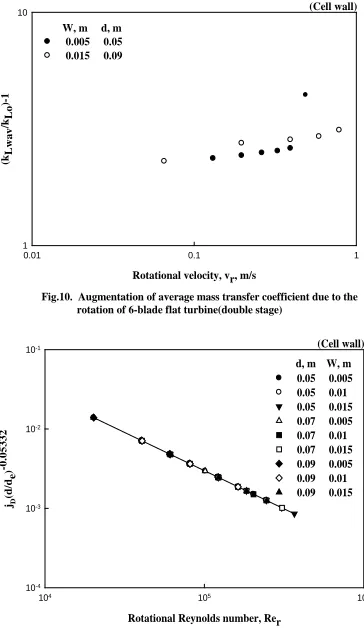
The mass transfer data obtained on cell wall are also analyzed in the above lines. The kLav increases with
increases in vr, d and w. The mass transfer coefficients on
the cell wall are enhanced from 2.67 to 5.3 fold due to the rotation over the value in stagnant electrolyte and this augmentation was given in the figure.10. The following equation is found to be the best fit for the mass transfer data obtained on cell wall.
jD = 191.9 Rer -0.96 (d/de)0.053
i) Maximum value of mass transfer coefficient is obtained at a turbine height of 0.075 m from cell bottom.
-(6)
Average deviation is 0.88% and standard deviation is 1.1%. The correlation plot resembling the above correlation was given in figure.11. Figure.12 compares the present data obtained on the electrode support (line A) with the data obtained on cell wall (line B).
IV.
CONCLUSION
The following conclusions are drawn from the experimental mass transfer data obtained on both electrode support and cell wall in an open electrolytic cell when a double stage 6-blade flat turbine is rotated using limiting current density technique.
For the Mass transfer data obtained on electrode support:
ii) Increased rotational speed results in higher mass transfer coefficients.
iii) Higher the diameter of the turbine, the mass transfer coefficient is increased.
iv) Mass transfer data increases with increase in width of the turbine blade.
v) The enhancement in mass transfer coefficient due to rotation of the turbine is 4.7 to 9.2 fold in the range of variables studied where as the power requirement is increased from 9 to 51.5 watts.
vi) The data are correlated by the equation: jD =318 Rer-0.93 (d/de)
vii) Mass transfer coefficient is increased with increase in rotational speed of the turbine.
0.116
Mass transfer data obtained on cell wall:
viii) As the turbine diameter of the blade is increased, the mass transfer coefficient increases.
ix) Larger the blade width of the turbine higher is the mass transfer coefficients.
x) The enhancement in mass transfer coefficient due to rotation of the turbine is 2.67 to 5.3 fold in the range of variables studied.
xi) The data are correlated by the equation:
jD = 191.2 Rer-0.962 (d/de)0.053
V.
NOMENCLATURE
A Surface area of microelectrode (m2) Ci Concentration of the ferricyanide ion
(kg mole/m3) Co Concentration of the ferrocyanide ion
(kg mole/m3) d, D Diameter of the test electrode/circular cylindrical promoter/turbine (m) de, De Equivalent diameter of the electrolytic cell (m)
F Faradays constant (Coulombs/equivalent) H Height of turbine from cell bottom (m) I Limiting current (mA) KL Overall mass transfer coefficient (m/s)
L Distance between apex and horizontal base of the
conical bottom (m)
LC Length of the conduit (m)
n No. of electrons involved in the reduction of ferricyanide ion
N Rotational speed of the impeller (rpm) S Spacing between the rings/promoters/baffles (m) w Width of the electrolytic cell (m) W Width of the 6-blade flat turbine (m)
DIMENSIONLESS PARAMETERS
jD , jDr Mass transfer factor, (kLav / vr) Sc2/3
jDv Mass transfer factor, (kL / vv) Sc2/3
JD Mass transfer factor, (kLav / vn) Sc2/3
Re,Red Reynolds number, ((ω r2dh)/μ)
Ref Flow Reynolds number, ((de vfρ)/μ)
Rer Reynolds number based on rotational velocity
(vr),((de vr ρ)/ μ)
Rev Reynolds number based on vibrational velocity
(vv), ((ρ v dv)/ μ)
Sc Schmidt number, (μL/ ρL DL)
Sh,ShL Sherwood number, (km dh/ DL)
Shd Sherwood number based on Red
Sho,Shf Sherwood number for fully developed flow
Shr Sherwood number based on rotation, (kLav
113
Copyright © 2011-15. Vandana Publications. All Rights Reserved.
Shv Sherwood number based on vibration, (kLav
de/DL
[13] K.Swethasri, “Ionic mass transfer studies in an open electrolytic cell- effect of double stage 2 - blade flat
turbine”, M.Tech Thesis, Department of Chemical Engineering, Andhra University, 2012.
)
REFERENCES
[1] G.H.Sedahmed, H.A.Farag, A.M.Kayar and I.M.El-Nashar, “Mass transfer at the impellers of agitated vessels in relation to their flow-induced corrosion”, Chemical Engineering Journal, vol.71, 1998, pp. 57-60.
[2] P.Venkat Rao and P.Venkateswarlu, “Effect of vibrating disc electrode on ionic mass transfer in an electrolytic cell”, Int. Comm. In Heat and Mass Transfer, vol.37, 2010, pp. 1261-1265.
[3] B Bharati, P. Venkateswarlu,, S. Kiran Appaji, B. Sanyasi Rao, G. J. V. Raju , “Ionic mass transfer for vibrating and rotating spheres”,Chemical Engineering and Processing, vol.36, 1997,pp. 59-65.
[4] M.Eisenberg, C.W.Tobias and C.R.Wilke, “Ionic mass transfer concentric polarization at rotating electrodes”, J. Electrochem. Soc, vol. 101,1954, pp. 306-319.
[5] D.Subba Rao and P.Venkateswarlu, “Ionic mass transfer studies in an open cell in the presence of circular cylindrical promoters”, Chemical Engineering and Processing, vol.43, 2004, pp. 35-41.
[6] T.Subbaiah, P.Venkateswarlu, R.P.Das and G.J.V.J.Raju, “Improved ionic mass transfer in an electrolytic cell in presence of turbulence promoters”, Hydrometallurgy, vol. 42, 1996, pp. 93-102.
[7] Z.D.Chen and J.J.J.Chen, “Comparision of mass transfer performance for various single and twin impellers”, Chemical Engineering Research and Design, vol.77, 1999, pp. 104-109.
[8] P.Ravi, N.Pavan, P.Gopala Krishna and P.Venkateswarlu, “Ionic mass transfer at a vibrating electrode support in an electrowinning cell”, Hydrometallurgy, vol.60, 2001, pp. 69-79.
[9] Y. M. El-Shazly, R. R. Zahran, H. A. Farag and G. H. Sedahmed, “Mass transfer in relation to flow induced corrosion of the bottom of cylindrical agitated vessels”, Chemical Engineering and Processing, vol.43, 2004, pp. 745-751.
[10] J.M.Grau and J.M.Bisang, “Mass transfer studies at packed bed rotating cylinder electrodes of woven-wire meshes”, J. Appl. Electrochem., vol.36, 2006, pp. 759-763. [11] P.Gopala Krishna, K.Chakravarthy, G.Ramabrahmam,D.Subba Rao and P.Venkateswarlu, “Ionic mass transfer in presence of turbulence promoters in a circular conduit”, Int. Comm. Heat Mass Transfer, vol.28, 2001, pp. 499-508.
[12] G. Shrikanth, “Combined effect of radial flow 2-blade flat turbine and electrolyte flow on mass transfer performance in an electrolytic cell”, M.Tech Thesis, Department of Chemical Engineering, Andhra University, 2008.
[14] G.Padma priya, “Augmentation of mass transfer coefficients due to the presence of double stage 4- blade flat turbine in an open electrolytic cell”, M.Tech Thesis, Department of Chemical Engineering, Andhra University, 2012.
Fig.1. Schematic diagram of the electrochemica cell (dimensions in ‘m’)
A-Copper electrode, C-Electrode support, M-Microelectrode, R- Rotor, S-Stand, SR-Shaft rod, T-Turbine
Fig.2. Details of the electrode support M – Microelectrode, w – Blade width, L – Length of the blade, d – Diameter of the turbine
0.2 0.14
114
Copyright © 2011-15. Vandana Publications. All Rights Reserved.
Fig .3. Details of 6-blade flat turbine
d- diameter of the turbine, L- blade length, w-blade width
Fig.4. Circuit Diagram
A – Ammeter, B – Battery, C – Commutator, R – Rheostat, S1, S2
Fig. 5 Effect of turbine height from cell bottom on average mass transfer coefficient
Height of the 6-blade flat turbine from cell bottom, H, m
0.03 0.04 0.05 0.06 0.07 0.08 0.09 0.10
A
v
era
g
e
ma
ss
t
ra
n
sf
er
co
ef
fi
ci
en
t,
kL
av
x
10
5, m
/s
1.6 1.7 1.8 1.9 2.0 2.1
250 500 750 1000 1250
N, rpm d, m W, m 0.07 0.01
(Electrode Support)
– Switches, T – Test electrode, V – Voltmeter, W – Wall electrode
Fig.6. Augmentation of average mass transfer coefficient due to the rotation of 6-blade flat turbine(double stage)
Rotational velocity, vr, m/s
0.01 0.1 1
(kL
av
/kLo
)-1
1
0.005 0.05 0.015 0.09 W, m d, m
(Electrode Support)
10
-Rotational Reynolds number, Rer
104 105 106
jD
(d
/de)
-0.
116
10-3
10-2
10-1
0.05 0.005 0.05 0.01 0.05 0.015 0.07 0.005 0.07 0.01 0.07 0.015 0.09 0.005 0.09 0.01 0.09 0.015 d, m W, m (Electrode Support)
Fig.7. Correlation plot for the mass transfer data obtained with rotation of 6-blade flat turbine(double stage)
Fig.8. Comparision of present data with earlier investigations Rotational Reynolds number,Rer
104 105 106
M
a
ss
t
ra
n
sf
er
fa
ct
o
r,
jD
10-8
10-7
10-6
10-5
10-4
10-3
10-2
10-1
CC- Double stage 6-blade flat turbine (present) BB-2-blade flat turbine with flow(shrikanth[12] AA-6-blade disc shaped turbine (sedahmed[1]) A
A
B
B C
C
Fig.9. Comparision between double stage 2,4,6- blade flat turbines Rotational Reynolds number, Rer
104 105 106
M
a
ss
t
ra
n
sf
er
fa
ct
o
r,
jD
10-3
10-2
AA-Double stage 2-blade flat turbine BB-Double stage 4-blade flat turbine
CC-Double stage 6-blade flat turbine(Present study) C
C B A B
115
Copyright © 2011-15. Vandana Publications. All Rights Reserved.
Rotational velocity, vr, m/s
0.01 0.1 1
(k
L
w
av
/kLo
)-1
1
0.005 0.05 0.015 0.09 W, m d, m
(Cell wall)
Fig.10. Augmentation of average mass transfer coefficient due to the rotation of 6-blade flat turbine(double stage)
10
Fig.11. Correlation plot for the mass transfer data obtained with rotation of 6-blade flat turbine(double stage)
Rotational Reynolds number, Rer
104 105 106
jD
(d
/de
)
-0.
05332
10-4
10-3
10-2
10-1
0.05 0.005 0.05 0.01 0.05 0.015 0.07 0.005 0.07 0.01 0.07 0.015 0.09 0.005 0.09 0.01 0.09 0.015 d, m W, m (Cell wall)
TABLE 1
Range of variables studied
Variable Minimum Maximum Turbine diameter, d, m 0.05 0.09 Turbine blade length, L, m 0.02 0.04 Turbine blade width, W, m 0.005 0.015 Rotational speed, N, rpm 250 1500 Rotational Reynolds number,
Re
20,187.2
r
2,46,599
Mass transfer factor, Jd 0.0265 0.00282
TABLE - 2
Comparision between optimum values from BBD and experimentation
Variable BBD Experimental value
Turbine height, H, m 0.0786 0.075 Rotational speed, N, rpm 1050 1250 Turbine blade width, W, m 0.013 0.015 Turbine diameter, d, m 0.082 0.09 Average limiting current
density , iav
0.52 , mA