DOI: 10.9781/ijimai.2016.421
Improved Shape Parameter Estimation in Pareto
Distributed Clutter with Neural Networks
José Raúl Machado Fernández, Jesús de la Concepción Bacallao Vidal
Telecommunications and Electronics Faculty, Technologic University “José Antonio Echeverría”, La Habana, Cuba
Abstract — The main problem faced by naval radars is the elimination of the clutter input which is a distortion signal appearing mixed with target reflections. Recently, the Pareto distribution has been related to sea clutter measurements suggesting that it may provide a better fit than other traditional distributions. The authors propose a new method for estimating the Pareto shape parameter based on artificial neural networks. The solution achieves a precise estimation of the parameter, having a low computational cost, and outperforming the classic method which uses Maximum Likelihood Estimates (MLE). The presented scheme contributes to the development of the NATE detector for Pareto clutter, which uses the knowledge of clutter statistics for improving the stability of the detection, among other applications.
Keywords — Sea Clutter, Artificial Neural Networks, Pareto Distribution, Distribution Parameter Estimation.
I. I
nTRoducTIonA
RAdARscans the surrounding area emitting electromagnetic waves that produce echoes after being reflected on nearby objects. Echoes are then received back in the transceiver containing the objects’ information [1]. Depending on the type of application, radars must ignore certain reflections and focus on others [2].In the specific case of coastal and ocean exploration, the reflective properties of the sea surface result in the generation of unwanted echoes that may reach high magnitudes. The elimination of these echoes, known as sea clutter, is one of the main problems faced by naval radars whose objective is to detect targets like ships or low altitude aircraft [3].
The representation of clutter is one of the topics most discussed in the literature [4-10]. Clutter modeling, as it’s also called, facilitates the simulation of radars’ performance before site implementation. As the clutter is a random signal, its modeling falls in the field of probability distributions.
Many distributions have been used in the modeling of sea clutter. The Weibull [11], K [12], Log-Normal [13], WW [14] and KK [15] are among the most commonly employed alternatives. However, in recent years evidence have been provided suggesting that the Pareto distribution may achieve a better modeling of the phenomenon than its traditional counterparts, while having a simple mathematical formulation [16]. Consequently, a significant amount of papers have been presented in a short period of time including the Pareto distribution in radar related solutions [17-22].
Among the different components of clutter modeling, the estimation of the distribution parameters has occupied a prominent place in multiple studies [23-26]. In the specific case of the Pareto distribution, various estimators have been proposed for the shape parameter that has a remarkable influence in the quality of the detection [21, 27, 28].
Nevertheless, the Maximum Likelihood Estimator (MLE) is commonly regarded as the classical estimator [29].
The Radar Research Team from the Instituto Superior Politécnico Jose Antonio Echeverria (ISPJAE-CUJAE) has developed improved parameter estimation techniques for the Weibull and K distributions using artificial neural networks (ANN) [30, 31]. Given the similarity of the above distributions and the Pareto alternative, the authors aimed at creating a new method for estimating the Pareto shape parameter using ANN.
The neural network, which was finally designed, achieves a precise and low computational cost estimation of the Pareto shape parameter in a wide range of possible values. Its design contributes to the development of the NATE (Neural Adaptive Threshold Estimation) detector for Pareto clutter, which uses the statistical knowledge of the clutter to improve the stability of detection in different scenarios. Similarly, the precise estimation of the clutter has application in the DRACEC scheme and in identifying anomalous sea surface conditions such as fish gatherings, oil spills or shipwrecks.
The paper is structured as follows. The second section introduces the fundamentals of the Pareto distribution, and the third one presents the method used in the design and training of the neural network. The four section entitled “Results and Discussion” characterizes the performance of the solution and compares it with the classical MLE alternative. Finally, in “Conclusions and Future Research” the contributions of the paper are summarized and recommendations are given for future research lines.
II. P
AReTod
IsTRIbuTIonThe Pareto distribution has been used in modeling the income of a population [32] and in several fields of engineering [27, 28, 33], including sonar [34] and radar [16, 35, 36] applications. Particularly in [16], the application of the Pareto distribution in the representation of high-resolution X-band sea clutter, observed at low grazing angles, was examined. The investigation compared the Pareto fit with the popular Log-Normal, Weibull, K, KK and WW intensity models. As a result, it was found that the Pareto distribution achieved a better fit than these traditional models.
It was also reported that the closest competitor to Pareto was the KK distribution. As the Pareto distribution is characterized by a simple PDF (Probability Density Function), the results are very promising. It is suggested that the Pareto distribution will become a natural replacement for the KK which uses between 4 and 5 parameters with a complicated PDF that includes Bessel functions.
The PDF of the Pareto distribution is given below.
)
Where α is the shape parameter and β is the scale parameter [29], also referred to as location parameter or x – minimun value [37]. The
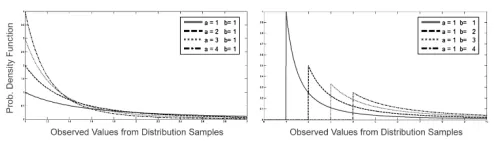
β parameter specifies the region where the distribution have positives values which always covers the interval [β, ∞); whereas the shape parameter controls how fast the tail of the distribution drops. Figure 1 ilustrates the effect on the Pareto PDF of the parameters variation.
Consulting the investigations of [21, 22, 38], the authors concluded that the interval of 2 < α < 10 is the more suitable for the Pareto clutter modeling. Additional simulations verified that samples generated with
α < 2 produce high magnitude values too often and those corresponding to α > 10 have a too short PDF tail.
III. d
esIgnAndT
RAInIngofThen
euRAln
eTwoRkFor the design of the neural network, the authors took as a start point the solutions given in [26, 30, 39-41] for different situations. Consequently, the initial configuration of the network internal variables was the one presented in Table 1. For the full understanding of the meaning of these parameters, the reader is referred to specialized literature [42, 43].
The configuration displayed in Table 1 was enough to achieve the desired results. Several parameters were modified looking for a better performance without obtaining virtually any gain. The only exception to this rule was the training algorithm. The best results were obtained after applying Bayesian Regularization [44] instead of Levenberg-Marquardt.
TAble I
confIguRATIonofThe InTeRnAl neuRAl neTwoRk VARIAbles
Network Variables Choice
Network Type Feed Forward Network (Multilayer Perceptron) Training Function BackPropagation (Levenberg-Marquardt) Number of Layers 3 (Input Layer – Hidden Layer – Output Layer)
Transference or
Activation Function Hyperbolic Tangent Sigmoid (Hidden Layer), Lineal Transference Function (Output Layer) Activation Order Topological (Asynchronous Activation)
Error Measurement Mean Square Error
Training Set Division 70% Training - 15% Validation - 15% Test Samples’ Presentation Batch Training
A. Preparation of the Training Set
An essential element in the design of a neuronal estimator is the preparation of the training set. In order to execute the supervised training, a set of 16000 groups of 3000 Pareto samples each was computer-generated by changing the value of the shape parameter (α) every 10 groups. Therefore, the first group was generated with α = 2, the group number 11 with α = 2,005, the group number 21 with α = 2,010, and so on until α = 10. The Pareto scale parameter was maintained at
β= 0.001 in all simulations.
The task of the neural network is to estimate the shape parameter for
each of the 3000 samples groups. To present samples to the network, histograms were prepared from each group. The histograms reduced the 3000 intensity values to 50, performing therefore the feature extraction from sea clutter. The number of values in the histograms was chosen imitating what was applied in [30, 31].
So, the network had 50 inputs designed to read histograms and an output conceived to estimate the value of the α parameter. The number of neurons in the hidden layer was left to optimize by successive trials.
IV. R
esulTsAndd
IscussIonAfter executing multiple trainings with ANNs, whose hidden layers contained between 5 and 50 neurons, it was concluded that the improvement by increasing the number of neurons was very low, as can be seen in Figure 2. In fact, the gain was less than a 5% in the mean absolute error when a 5 neurons ANN was replaced by a 50 neurons ANN. The mean absolute error was measured by averaging the absolute magnitude of the deviation of each parameter estimation from the exact value known a priori.
Each value from Figure 2 resulted from choosing the best network after performing 50 training with schemes containing the specified number of neurons in the hidden layer. Afterwards, the network performance was measured with a new dataset independent from the one used in the training.
Consequently, the authors selected a network with five neurons as the final proposal. It exhibited a mean absolute error of 0,0897 and a maximum error of 0,5748. These values represent only a 1,12% and a 7,2% respectively of the search interval.
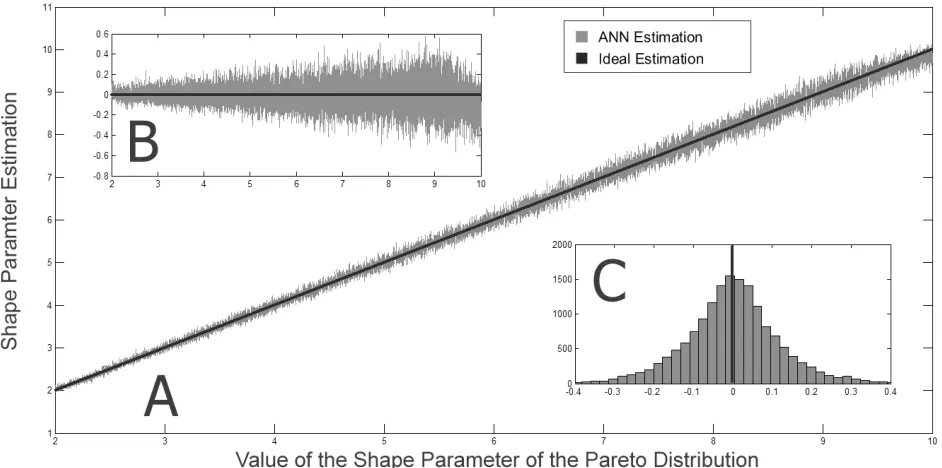
Figure 3 presents 3 graphs corresponding to the ANN’s performance. Graph A shows the shape parameter estimation performed by the ANN together with the ideal estimate. Graph B shows the committed error obtained by subtracting both quantities. As can be seen, the deviation is greater for high values of the shape parameter. This is a result of the saturation of the parameter’s influence in the heavy tail property of the Pareto distribution and it verifies what it was observed in [30] for the Weibull distribution. As α increases, the PDF curves will become more and more similar to each other, making more difficult the accurate estimation of the parameter.
Finally, graph C from Figure 3 presents a histogram of the committed error. As it’s shown, the error exhibits a Gaussian-like behavior which is a positive feature for an estimator.
A. Comparison with the MLE Estimator
Generally, the shape parameter of clutter related distributions such as Weibull, K and Log-Normal is estimated by one of two methods: the Method of Moments (MoM) and the MLE method. In the case of the Pareto distribution, the MoM does not provide good estimates due to the long tails of the distribution and to limitations in the definition of Fig. 1. Effect of the parameters variation in the Pareto PDF.
the moments that require a certain value of β as a condition of existence [29]. In fact, the use of this estimator is strongly unadvised. So, the most widely employed estimator is the MLE that uses the following expressions [29, 45]:
= min
∑ log − log
(2)
Where is the estimate of the scale parameter, is the estimate of the shape parameter and is the sample number of a given set.
The authors compared the performance of the new neuronal proposed estimator with the MLE. After evaluating both schemes with a new set of 16000 groups of 3000 samples, it was concluded that the neuronal method performs the estimation with a deviation 50% inferior to the one exhibited by the MLE, both regarding the mean absolute error and the maximum error. The mean absolute error committed by the MLE was of 0,1689 and the maximum error of 1,1077.
Additionally, it was observed that the behavior of the estimators changed in the different estimation intervals as it’s shown in Tables 2 and 3. Note that both estimators exhibit a similar performance in the 2 < α < 3 interval, where only a small gain of less than a 3% is achieved by replacing the MLE with the neuronal solution. However, as the magnitude of α increases, the gain starts to be significant, reaching a figure of 200% for the 9 < α < 10 region.
Moreover, the speed of both the MLE method and the neural solution were tested using a personal computer with an Intel Core i5-4460 CPU (3.20GHz) and 4 GBs of RAM memory. The MLE took 5,5425 seconds to complete the estimation on a set containing 16000 groups of 3000 Pareto samples, whereas the ANN consumed 1,8721 seconds (almost 3 times faster). Nevertheless, the ANN processing time can be reduced even more by placing the solution on a FPGA kit which will provide parallel processing features. Also, the time elapsed in the gathering of the histograms (94% of the 1,8721 seconds) can be further reduced by establishing a memory aware system which will only replace the older sample when receiving a new one.
In conclusion, it’s safe to say that the neuronal method outperforms the MLE in the region of high magnitudes of the shape parameter; while it’s able to maintain an equal or superior performance in the remainder
of the estimation interval. The proposed ANN achieves an accurate and low computational cost estimation of the Pareto shape parameter. Therefore, it contributes to the design of radar detectors that guarantee a constant false alarm probability when processing clutter with statistical variations. Indeed, the neural estimation solution presented in [30] for the Weibull distribution led, together with the contribution of [46], to the creation of the W-NATE-CA-CFAR adaptive detector [47]. So, the current paper is expected to lead to the creation of the P-NATE-CA-CFAR (Pareto-Neural Adaptive Threshold Estimation-Cell Averaging-Constant False Alarm Rate) detector.
TAble II
MeAn AbsoluTe eRRoRInThe esTIMATIonofThe PAReTo shAPe PARAMeTeRfoR
dIffeRenT InTeRVAls.
Interval MLE ANN Gain
2 < α < 3 0,0380 0,0371 2,42% 3 < α < 4 0,0542 0,0512 5,86% 4 < α < 5 0,0777 0,0669 16%
5 < α < 6 0,1087 0,0840 35% 6 < α < 7 0,1594 0,0977 63% 7 < α < 8 0,2134 0,1157 84% 8 < α < 9 0,2990 0,1325 125% 9 < α < 10 0,4008 0,1343 200%
TAble III
MAxIMuM AbsoluTe eRRoRInThe esTIMATIonofThe PAReTo shAPe PARAMeTeR foR dIffeRenT InTeRVAls.
Interval MLE ANN Gain
At the same time, the new neural method helps improving the identification of anomalous sea surface conditions such as fish gatherings [48], oil spills [49, 50] or shipwrecks [51, 52]. These conditions cause deviations in the clutter statistics, which may be identified with a precise estimator of the shape parameter such as the one proposed.
Lastly, the presented results contribute to the development of the DRACEC method [53] that proposes an alternative detection scheme based on the moments domain. One of the major disadvantages of DRACEC is the need for the accumulation of a large number of samples for further processing. The accurate estimation of distribution parameters allows making inferences on the properties of the samples, reducing thus the volume of data to be stored.
V. c
onclusIonsAndf
uTuReR
eseARchA new estimation technique for the Pareto shape parameter, based on artificial neural networks, was proposed. The neural method proved to be better than the classic alternative based on Maximum Likelihood Estimates mainly in the region of high magnitudes of the parameter. The neural solution provides an accurate and low computational cost estimation that can be used to improve the stability of radar detectors, in the identification of clutter anomalies and in the detection in the moments’ domain.
The authors will focus next on the development of the P-NATE-CA-CFAR detector and in the FPGA implementation of the presented solution to profit from the parallel processing advantages of this platform. Additionally, the design of similar solutions applied to clutter distributions such as the KK, WW and Compound Gaussian is recommended.
R
efeRences[1] H. Meikle, Modern Radar Systems, 2nd Edition ed.: Artech House 2008. [2] W. L. Melvin and J. A. Scheer, Principles of Modern Radar, Vol III Radar
Applications: Scitech Publishing, 2014.
[3] K. Ward, R. Tough, and S. Watts, Sea Clutter Scattering, the K Distribution and Radar Performance, 2nd ed. London, United Kingdom: The Institution of Engineering and Technology, 2013.
[4] L. Rosenberg, “The effect of temporal correlation with K and KK distributed Sea-Clutter”, presented at the IEEE Radarcon Conference, 2012.
[5] E. Ollila, E. Tayler, D. E. Koivumen, and V. Poor, “Compound-Gaussian Clutter Modeling with an Inverse Gaussian texture distribution”, IEEE Transactions on Signal Processing Letter, vol. 19(12), pp. 876-879, 2012. [6] L. Rosenberg, D. J. Crisp, and N. J. Stacy, “Analysis of the KK distribution with Medium Grazing Angle Sea-clutter”, in IET Proceedings of Radar Sonar and Navigation, vol. 4, pp. 209-222, 2010.
[7] D. J. Crisp, L. Rosenberg, and N. J. Stacy, “Modelling X-band Sea-Clutter with the K distribution: Shape Parameter Variation”, presented at the Radar International Conference “Surveillance for a Safer World, 2009. [8] M. Sekine, M. P. S. Musha, Y. Yomita, T. Hagisawa, T. Iraby, and E.
Kiuchi, “Log-Weibull Distributed Sea Clutter”, IEE Proceedings, vol. 127(3), 1980.
[9] H. C. Chan, “Radar Sea-Clutter at Low Grazing Angles”, IEE Proceedings, vol. 137(2), 1990.
[10] T. J. Nohara and S. Haykin, “Canadian East Coast Radar Trials and the K-Distribution”, in IEE Proceedings on Radar and Signal Processing, vol. 131(2), pp. 80-88, 1991.
[11] Q. Ping, “Analysis of Ocean Clutter for Wide-Band Radar Based on Real Data”, in Proceedings of the 2011 International Conference on Innovative Computing and Cloud Computing, Wuhan, China, 2011, pp. 121-124. [12] Z. Chen, X. Liu, Z. Wu, and X. Wang, “The Analysis of Sea Clutter
Statistics Characteristics Based on the Observed Sea Clutter of Ku-Band Radar”, in IEEE Proceedings of the International Symposium on Antennas & Propagation, vol. 2, pp. 1183-1186, 2013.
[13] S. Ishii, S. Sayama, and K. Mizutani, “Effect of Changes in Sea-Surface State on Statistical Characteristics of Sea Clutter with X-band Radar”, Wireless Engineering and Technology, vol. 2(3), pp. 175-183, 2011. [14] Y. Dong, “Distribution of X-Band High Resolution and High Grazing
Angle Sea Clutter, Technical Report DSTO-RR-0316,” Electronic Warfare and Radar Division, Defence Science and Technology Organization, Edinburgh, South Australia, 2006.
[15] S. Watts and L. Rosenberg, “A Review of High Grazing Angle Sea Clutter”, presented at the IEEE 2013 International Conference on Radar, pp. 240-245, 2013.
[16] M. Farshchian and F. L. Posner, “The Pareto Distribution for Low Grazing Angle and High Resolution X-Band Sea Clutter”, in IEEE Radar Conference Proceedings, pp. 789-793, 2010.
[17] G. V. Weinberg, “Coherent Multilook Radar Detection for Targets in Pareto Distributed Clutter, Technical Report DSTO-TR-2646”, Electronic Warfare and Radar Division, Defence Science and Technology Organisation, Edinburgh, South Australia, 2012.
[18] G. V. Weinberg and D. Finch, “Analysis of a Pareto Mixture Distribution for Maritime Surveillance Radar”, Journal of Electrical and Computer Engineering, 2012.
[19] G. V. Weinberg, “Assessing Detector Performance, with Application to Pareto Coherent Multilook Radar Detection”, IET Radar, Sonar and Navigation, vol. 7, pp. 401-412, 2013.
[20] G. V. Weinberg, “Constant False Alarm Rate Detectors for Pareto Clutter Models”, IET Radar, Sonar and Navigation, vol. 7, pp. 153-163, 2013. [21] G. V. Weinberg, “Estimation of Pareto clutter parameters using order
statistics and linear regression”, IET Electronics Letters 20th, vol. 49(13), pp. 845- 846, 2013.
[22] G. V. Weinberg, “Constant False Alarm Rate Detection in Pareto Distributed Clutter: Further Results and Optimality Issues”, Contemporary Engineering Sciences, vol. 7(6), pp. 231-261, 2014.
[23] P. J. Chung, W. J. J. Roberts, and J. F. Bohme, “Recursive K distribution parameter estimation”, IEEE Transactions on Signal Processing, vol. 53(2), pp. 397-402, 2005.
[24] A. Dogandzic, A. Nehorai, and J. Wang, “Maximum likelihood estimation of compound-Gaussian clutter and target parameters”, in Proceedings of 12th Annual Workshop Adaptive Sensor, Array Processing(ASAP ’04), Lincoln Laboratory,, Lexington, MA, 2004.
[25] A. Mezache, M. Sahed, T. Laroussi, and D. Chicouche, “Two novel methods for estimating the compound K clutter parameters in presence of thermal noise”, IET Radar Sonar Navig., vol. 5(9), pp. 934-942, 2011. [26] A. Mezache and M. Sahed, “Parameter Estimation in K-Distributed
Clutter with Noise using Nonlinear Networks”, Université de Constantine, Faculté des Sciences de l’Ingénieur, 2010.
[27] I. B. Aban, M. M. Meerschaert, and A. K. Panorska, “Parameter estimation for the truncated pareto distribution”, Journal of the American Statistical Association, vol. 101(473), pp. 270–277, 2006.
[28] E. Chlebus and R. Ohri, “Estimating parameters of the pareto distribution by means of zipf’s law: application to internet research”, in IEEE Globecom, 2005, pp. 1039–1043.
[29] G. V. Weinberg, “An Investigation of the Pareto Distribution as a Model for High Grazing Angle Clutter, DSTO-TR-2525”, Electronic Warfare and Radar Division, Defence Science and Technology Organisation, Edinburgh, South Australia, 2011.
[30] J. R. Machado Fernández, J. C. Bacallao Vidal, and N. Chávez Ferry, “A Neural Network Approach to Weibull Distributed Sea Clutter Parameter’s Estimation”, Inteligencia Artificial vol. 18(56), pp. 3-13, 2015.
[31] J. R. Machado Fernández and J. C. Bacallao Vidal, “Improved Shape Parameter Estimation in K Clutter with Neural Networks (accepted)”, International Journal of Interactive Multimedia and Artificial Intelligence, 2016.
[32] A. V. Asimit, E. Furman, and R. Vernic, “On a multivariate pareto distribution”, Insurance, vol. 46(2), pp. 308–316, 2010.
[33] M. Rytgaard, “Estimation in the pareto distribution”, ASTIN Bulletin, vol. 20(2), pp. 201–216, 1990.
[34] J. M. Gelb, R. E. Heath, and G. L. Tipple, “Statistics of Distinct Clutter Classes in Midfrequency Active Sonar”, IEEE Oceanic Eng, vol. 35, pp. 220-229, 2010.
Computers., pp. 594-598, 1991.
[36] M. Piotrkowski, “Some Preliminary Experiments with Distribution-Independednt EVT-CFAR based on Recorded Radar Data”, presented at the IEEE Radar Conference 08, 2008.
[37] A. N. O’Connor, Probability Distributions Used in Reliability Engineering: University of Maryland, 2011.
[38] J. Metcalf, S. D. Blunt, and B. Himed, “A Machine Learning Approach to Cognitive Radar Detection”, 2015 IEEE Radar Conference (RadarCon), pp. 1405-1411, 2015.
[39] D. Ling and W. Pingjun, “A Method for Determining Scale Factor of CFAR Detector Based on BP Neural Networks”, presented at the The 2nd International Conference on Computer Application and System Modeling, 2012.
[40] J. A. Garzón Guerrero, “Clasificación de blancos de radar en ambientes de ruido arbitrario mediante resonancias naturales y técnicas de componentes principales”, Doctor en Ciencias, Universidad de Granada, 2012. [41] N. B. Gálvez and J. E. Cousseau, “Improved Neural Network Based
CFAR Detection for non Homogeneous Background and Multiple Target Situations”, Latin American Applied Research, vol. 42, pp. 343-350, 2012. [42] D. Kriesel, A Brief Introduction to Neural Networks: Springer, 2005. [43] M. H. Beale, M. T. Hagan, and H. B. Demuth, Neural Network Toolbox™
User’s Guide: Mathworks, 2010.
[44] J. L. Ticknor, “A Bayesian regularized artificial neural network for stock market forecasting”, Expert Systems with Applications, vol. 40(14), pp. 5501–5506, 2013.
[45] C. Forbes, M. Evans, N. Hastings, and B. Peacok, Statistical Distributions, 4th ed.: Wiley, 2011.
[46] J. R. Machado Fernández, “Estimation of the Relation between Weibull Distributed Sea clutter and the CA-CFAR Scale Factor”, Journal of Tropical Engineering, vol. 25(2), pp. 19-28, 2015.
[47] J. R. Machado Fernández, “Weibull Clutter Assumption Neural Adaptive Threshold Estimation Cell Averaging Constant False Alarm Rate (W-NATE-CA-CFAR) Detector (under revision)”, Ingeniare, 2015. [48] J. M. Fialkowski, R. C. Gauss, and D. M. Drumheller, “Measurements and
Modeling of Low-Frequency Near-Surface Scattering Statistics”, IEEE Journal of Oceanic Engineering, vol. 29(2), pp. 197-214, 2004. [49] M. Fingas, Handbook of Oil Spill Science and Technology: WILEY, 2015. [50] C.-h. Qi and Z.-q. Zhao, “Electromagnetic Scattering and Statistic Analysis of Clutter from Oil Contaminated Sea Surface”, Radioengineering, vol. 24(1), 2015.
[51] D. Abraham, A. and J. R. Preston, “Statistical Analysis of Monostatic and Bistatic Echoes from ShipWreck”, IEEE Journal of Oceanic Engineering, vol. 25(1), 2010.
[52] J. R. Preston and D. A. Abraham, “Statistical Analysis of Multistatic Echoes From a Shipwreck in the Malta Plateau”, IEEE Journal of Oceanic Engineering, vol. 40(3), pp. 643-656, 2015.
[53] J. C. Bacallao Vidal, “Un modelo Teórico de la Técnica DRACEC. Metodología del Proceso de Adaptación al Fondo”, Doctor en Ciencias Técnicas, Instituto Técnico Militar “José Martí”, La Habana, Cuba, 2003.
José Raúl Machado Fernández received his Telecommunications and Electronics Engineering Degree from the Instituto Superior José Antonio Echeverría (ISPJAE-CUJAE) in 2012. He is currently a Ph.D. student at the same institution. His research topics include teledetection, digital signal processing, sea clutter modeling and the application of artificial intelligence for solving diverse engineering problems.