www.ann-geophys.net/27/861/2009/
© Author(s) 2009. This work is distributed under the Creative Commons Attribution 3.0 License.
Annales
Geophysicae
Low frequency eigenmodes of thin anisotropic current sheets and
Cluster observations
L. M. Zelenyi1, A. V. Artemyev1, A. A. Petrukovich1, R. Nakamura4, H. V. Malova1,2, and V. Y. Popov1,3 1Space Research Institute, Russian Academy of Sciences, Moscow, Russia
2Nuclear Physics Institute, Moscow State University, Russia 3Faculty of Physics, Moscow State University, Russia
4Space Research Institute, Austrian Academy of Sciences, Graz, Austria
Received: 14 August 2008 – Revised: 2 December 2008 – Accepted: 9 December 2008 – Published: 19 February 2009
Abstract. The eigenmodes of low frequency perturbations of thin anisotropic current sheets with a finite value of the nor-mal magnetic field, are investigated in this paper. It is shown that two possible polarizations of symmetric and asymmet-ric modes (sausage and kink) exist where the growth rate of instabilities is positive. In addition, we demonstrate that a tearing instability might have a positive growth rate in thin anisotropic current sheets. The class of relatively fast wavy flapping oscillations observed by Cluster is described. The main direction of wave motion coincides with the direction of the current and the typical velocity of this motion is compa-rable with the plasma drift velocity in the current sheet. The comparison of these characteristics with theoretical predic-tions of the model of anisotropic thin current sheets, demon-strates that, in principle, the theory adequately describes the observations.
Keywords. Magnetospheric physics (Magnetotail) – Space plasma physics (Numerical simulation)
1 Introduction
The numerous attempts to describe current sheets (CSs) in the Earth’s magnetosphere and to investigate their stability led to the development of a variety of models of CS. The simplest CS models are the one of Harris (1962) and its 2-D generalization by Kan (1973). These models are usually used to describe thick isotropic CS equilibrium. Another group of models, taking into account the anisotropy of ion
distribu-Correspondence to: A. V. Artemyev ([email protected])
tions and/or quasi-adiabaticity of ion motion in thin current sheets (where ion gyroradii are about CS thickess), was re-cently developed (Zelenyi et al., 2004; Sitnov et al., 2006). Earlier, the theory of stability was applied to study eigen-modes of the Harris CS, therefore the tearing (Coppi et al., 1966; Schindler, 1974; Galeev and Zelenyi, 1976; Pellat et al., 1991; Sitnov et al., 1997), kink (Daughton, 1999) and sausage modes (Lapenta and Brackbill, 1997; Buechner and Kuska, 1999) were investigated in detail. It was shown that the Harris CS is completely stable under tearing perturba-tions in the presence of a finite value of a normal magnetic component (Pellat et al., 1991) because of a strong stabiliz-ing effect of the magnetized electrons. This situation is dif-ferent if one takes into account some additional effects, for example, the presence of transient electrons in the plasma population (Sitnov et al., 1997).
It was shown, in newly obtained spacecraft observations, that the properties of relatively thin CSs are completely dif-ferent from Harris ones (Nakamura et al., 2006; Runov et al., 2006) and a more adequate approximation might be achieved in a frame of recent CS models (Sitnov et al., 2006; Baumjo-hann et al., 2007; Artemyev et al., 2008).
Contrary to well-known isotropic models, the general the-ory of anisotropic thin CS (TCS) instabilities, which might be useful to compare the typical temporal and spatial charac-teristics of observed CSs, has not been developed yet. Very few successful attempts to compare the experimental data of CS dynamics with theoretical results have been made in the last years (Volwerk et al., 2003; Golovchanskaya et al., 2005; Erkaev et al., 2008; Saito et al., 2008). In this article, we present our first results devoted to the further develop-ment of the general theory of oblique instabilities (of tearing, kink, sausage and oblique eigenmodes) in anisotropic TCSs
(Zelenyi et al., 2004). Theoretical predictions are compared with experimental Cluster data. We demonstrate here that, contrary to Harris-like CSs, which are always stable under tearing perturbation in the presence of a finite magnetic com-ponentBz (Pellat et al., 1991), the tearing mode in TCSs
might be unstable (Zelenyi et al., 2008), and its growth de-pends sensitively on the propagation angle (we use here the Geocentric Solar Magnetospheric coordinate system). Other TCS modes (e.g. kink and sausage), which propagate per-pendicularly to the magnetic field, might also develop in anisotropic CSs withBz6=0. The values of their growth rates
are comparable.
2 TCS model and essential parameters
To investigate the CS instabilities, we have used the model of anisotropic TCS equilibrium (Zelenyi et al., 2004, 2006, and references therein). In this model, the ion component is described by a bi-Maxwellian distribution function (at the edges of the CS) that can be rewritten as a function of two integrals of motion: the particle energy and the adiabatic invariant of motionIz=(m2π )Hvzdz (the last one is
ap-proximately conserved during particle motion). The key free parameter of the model isε, the ratio of the ion thermal ve-locity to the bulk plasma veve-locity along the field lines at the edges of the CS. This parameter determines the anisotropy of ion velocity distribution in the CS and controls the thick-ness of the CSLCSitself (Zelenyi et al., 2004). The electron component is defined in a flow approximation by the param-eter τ=TiTe (ratio of ion to electron temperatures). The parameter that controls the magnetic topology of the system isbn=BzB0(Bzis the normal component of the magnetic field;B0 is the magnetic field at the edges of the CS). The important characteristics of TCSs, principally different from isotropic CS models, are the shear of bulk velocity in the central region of the CSjy(z)(en (z))6=const and the
em-bedding of the CS inside a much thicker plasma sheet (at the edges of the CS wherejy=0, the plasma densityn6=0).
Therefore, the excess of a free energy in TCS could be larger in comparison with isotropic CSs and, as a result, the growth rate of CS instabilities might be substantially higher (Zelenyi et al., 2008).
3 Stability of TCSs and the energy principle
In this paper, the stability of perturbations of vec-tor potential in the form of oblique plane waves A1=
1+ 2 5 #
4 5 # 0 0 ) + 2
# 4 ) 5 )
,@ + --&1+ 2 6 4
, 1+ 2
0 0 - , 0
A - 0 0 ) 1+ 2 2)
) 4 5 #
0 ) 4 0 ) 5
, 0 ) - -1+ 2
6 0 2) 4 0 )
0 ) 4 0 4 4 0 ,@ + --E1+
) , + ,
4 4 # 4 3 #
6 # 0 - # 0 +
2 4 0 ( , :=&1+ 0
4 ( 0 4 4 5 ,' # @ :=.A ! + :: A --.1+ I 0
4 5 4 4 0
, :=&1 4 B # +
2 4 0 4 4 0 0
,! + :: A --.A @ + --E1+ I 0
4 4 3 ? *
$ $ $
E , 1
2 4 # 4 0 4
4 ( F # 3 *
-
-, 1
1(z)expikxx+ikyy−iωt in the reversed magnetic
fieldBx with Bz6=0 is investigated. The electrons are
as-sumed to be totally magnetized (Schindler, 1974). In this case, a strong stabilizing effect of the electron compress-ibility should be taken into account (Galeev and Zelenyi, 1976; Pellat et al., 1991; Schindler, 2006). On the tem-poral scale of the growth of instability, the ion motion is
faintly perturbed by their oscillations in theBzmagnetic field (Schindler, 1974) and the main ion contribution is due to Landau resonance with the waves.
To obtain the energy balance of these perturbations, the en-ergy principle is used in its general form (Pellat et al., 1991; Schindler, 2006; Zelenyi et al., 2008). One can present the energy balance of a perturbed quasi-neutral system as:
W =
Z B2
8πd
3r+X
j
Z m
jv2
2 fjd
3rd3v (1)
The first order of the perturbation of velocity distribution function f1j might be found on the base of the linearized
Vlasov equation:
f1j− qj mjc
f0jSjA1= − qj mjc
f0j
t
Z
0 n
A1S¯j+(−c∇ϕ1+ ∇(vA1))Sj
o
dt0=f1resj (2)
where Sj=f0−j1 ∂f0j
∂v
and S¯jeα=v ∂ Sjeα
∂r
+ qjcmj(E0c+[v×B0]) ∂ Sjeα∂v.
One can write the second order of perturbed energyW(2)
as a function ofA1:f˜1j=f1j− ∂f1j∂A0A1−f1resj :
W(2)=
Z B2 1 8πdr−
1 2
X
j
Z f˜2 1j ∂f0j
∂H0j drdp
−X
j
1
mj
Z p−qj
c A0
qj
cA1f1jdrdp
+X
j
1 2mj
qj2 c2
Z
A21f0jdrdp (3)
Now, one should take into account that the zero order of the ion velocity distribution f0i=f0i(H0i, Iz)depends on two
integrals of motion: the exact oneH0i and the approximate
oneIz, which allows us to rewrite the expression for the
adi-abatic invariantIz using the ion generalized momentumPyi
of particle motion (Zelenyi et al., 2004) as:
Iz=
2mj π
z1
Z
z0
v2z+vy2+2qjm−j1
ϕ (z)−ϕ z0 (4)
−
vy− qj mjc
A0y z0−A0y(z)
21/2
dz0
Taking into account the approximate conservation ofIzalong the particle trajectory in the CS, Eq. (3) can be rewritten in a new form:
W(2)=
Z B2 1 8πdr−
1 2
X
j
Z f˜2 1j ∂f0j∂H0j
drdp
−1
2c
Z ∂j 0 ∂A0
A21dr− 1
2c
Z
jresA1dr (5)
Here,jres=eRvf1resi dv is the density of the perturbed cur-rent due to resonance ion–wave interaction. The minimiza-tion of the funcminimiza-tionalW(2)(A1)in Eq. (5) allows us to find and investigate different CS perturbations. To achieve this aim, one should presentf˜1j as a function of the perturbation
of vector potentialA1, taking into account two properties: first, the quasi-neutrality of plasmaP
j
qjRf1jd3v=0;
sec-ond, the electron magnetization in theBzmagnetic field, i.e. n1e≈n0 B1zBz. Using Schwartz inequality (see Zelenyi
et al., 2008), one can rewrite Eq. (5) in the following form: 8π W(2) =
Z n
B21+8πp0 kxA1ey
Bz
2
−4π c−1 ∂j0∂A0
A21−4π c−1jresA1 o
dr (6) wherep0is the total unperturbed kinetic pressure. The value of a free energy∼∂j0
∂A0 in Eq. (6) is substantially dif-ferent from the one in a Harris-like CS, where the derivative
∂j0
∂A0 ∼ j0is due to the constancy of the drift plasma velocity everywhere in the CS. In our case, this derivative has another form, i.e.∂j0
∂A0∼j0F (z), whereF (z)has a very strong maximum in the very centre of the CS. Also, one can see that the functionalW(2)is dependent only on the perturbation of a vector potential. The corresponding dis-persion ratio could easily be obtained if one accomplished a minimization of a functionalW(2)(A1)under the condition δW(2)δA1=0.
4 Numerical results
We used the following parameters to investigate instabil-ities: k=qk2
x+k2y (the magnitude of the wave vector); θ=arctan ky
kx
(the angle of wave propagation). Also, we have taken into account the Coulomb gauge condition for the perturbed vector potential, i.e.divA1=0. Now, one should consider two different polarizations of the perturbed vector potentialA1. First, polarization might be presented in the formA1=A1xex+A1yey (Galeev and Zelenyi, 1976;
Silin et al., 2002). The Coulomb gauge imposes the follow-ing condition related to the components of the perturbed vec-tor potential: A1xcosθ+A1ysinθ=0. This perturbation is
suppressed atθ→π
2. Perturbation with another polariza-tionA1=A1yey+A1zez(Lapenta and Brackbill, 1997) might
grow atθ=π
2. In this paper, we consider the characteris-tics of both kinds of polarization.
According to the paper by Dobrowolny (1968), the width of the region of ion resonance interaction with growing wavesUi(z)(i=1,2,3, ...)could be found from the
condi-tionsUi(z)=1, ifρi(z) <zandUi=0, ifρi(z) >z(where ρi(z)=vT iωibx(z), ωi=eBx(∞)mic, bx(z)=BxB0). We have taken into account only ion resonant currents be-cause, in the presence of the normal component of the mag-netic fieldBz, the electron population becomes magnetized;
consequently, it could not contribute to the resonant interac-tion (Schindler, 1974).
For the polarization of a vector potentialA1in the form A1=A1xex+A1yey, it is more convenient to consider the
simplified equation for its valueA1= q
A21x+A21y instead of the system of two equations for each of these components. This is possible becauseA1x andA1y are linearly coupled
(i.e. A1x=−A1ytanθ )by the Coulomb gauge. Therefore,
one can rewrite the equationδW(2)δA1=0 in the following form:
d2A1 .
dz2− n k21+4πp0Bz−2cos 4θ
−4π c−1 ∂jy
∂A0
cos2θoA1
= −jres(z, θ, A1, t ) (7)
The current of resonant interactionjres(z, θ, A1, t )can be obtained as the integral R
vyf1resi d3v. For another kind of polarizationA1=A1yey+A1zez, one should solve the single
equation for A1y as it was done by Lapenta and Brackbill
(1997) for the sausage mode (θ=π
2). Contrary to previ-ous works, we considered the perturbations propagating at arbitrary angles in the CS plane (θ ∈ [0, π
2]):
d2A1y
.
dz2− n k21+4πp0Bz−2cos2θ
−4π c−1 ∂jy∂A0 o
A1y
= −jres z, θ, A1y, t
(8)
Because the resonant current densityjres∼ t
R
0
K t−t0
A1 t0dt0depends on time, Eqs. (7) and (8) could be considered as the evolutionary ones
(DA¯ 1(z, t )=S (z) t
R
0
K t−t0
A1 z, t0dt0, ¯
D=d2dz2−D0(z) is the differential operator) and could be solved by the method of finite elements (Lapenta and Brackbill, 1997; Daughton, 1999). For this purpose, one could use the basis of Hermite polynomials’ spatial func-tions Hn(z) (n=0,1,2, ...) and then obtain the following form of perturbed vector potential: A1=P
n
Hn(z) ψn(t ). The corresponding system of integral equations is the following: Tnmψn(t )=Snm
t
R
0
K t−t0ψn t0dt0 (here
Tnm=
∞
R
−∞
HmDH¯ ndz, Snm=
∞
R
−∞
HmS (z) Hndz). Finally,
from this system of equations, we obtained the correspond-ing eigenfrequencies and growth rates of wave perturbations as functions of TCS parameters, wavenumbers k and propagation anglesθ(Fig. 1).
The resulting growth rates for both kinds of polarization depending on the anglesθare shown in Fig. 2. As one can see, both symmetric polarization modes have equal positive
Fig. 1. Sketch of eigenmodes in the CS.
Fig. 2. Growth rate as a function of angle θ for two polariza-tions. The parameters have the following values:τ=3,LCS=0.8ρi,
kLCS=0.3,bn=0.1.
values of growth rate in the case of tearing instability (θ=0), but asymmetric modes are suppressed whenθ→0. When the propagation angleθ increases, the perturbation with polar-izationA1=A1xex+A1yeyis suppressed. However, with
an-other polarization,A1=A1yey+A1zezbecomes
correspond-ingly sausage or kink instabilities atθ=π
2. In the range
θ∼π
2, the growth rate of perturbation becomes larger than the one of the tearing mode (θ∼0). Thus, the development of perturbations propagating along the current (“Y” direc-tion) are more probable than the development of a tearing mode (i.e. waves moving along the “X” direction). Also, the asymmetric mode perturbations at θ=π2 have larger growth rates than the symmetric one; this is similar to the behaviour obtained in Harris CSs (Daughton, 1999).
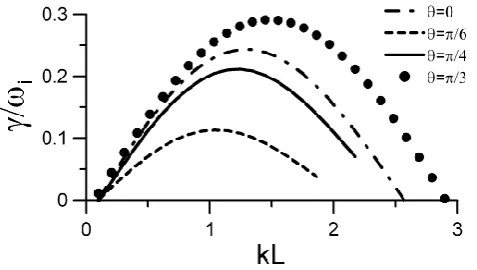
[image:4.595.51.280.61.237.2]Fig. 3. Growth rate as a function of the magnitude of wavenum-berk for polarizationsA=Ayey+Azez. The parameters have the following values:τ=3,LCS=0.6ρi,bn=0.1.
Figure 3 demonstrates the growth rate of the symmetric mode with polarizationA1=A1yey+A1zezas a function of
wavenumber k. As one can see, the range of wavenum-bers with positive values of growth rate is wider than the one in the classical Harris CS (Daughton, 1999). The max-imum value of the growth rate for different values of prop-agation angles belongs to segmentkLCS∈[0.8, 1.8]. The
real part of the frequency in this region of wavenumbers be-longs to the value rangeω∈[0.01, 0.035]ωi (which is
com-mon to both symmetric and asymmetric modes). These val-ues are much smaller than in the “classical” case of thin Harris CSs (Lapenta and Brackbill, 1997; Daughton, 1999) because the real part of the frequency is proportional to the velocity of diamagnetic drifts ω≈kyvDM=kvDMsinθ, wherevDM is the velocity of the diamagnetic drift (Baumjo-hann and Treumann, 1996). In the Harris CS, where most of the current is supported by diamagnetic particle drifts
vDM∼dndz, the plasma density gradients are much larger than in the anisotropic CS with few embedded layers, if the thicknesses of the Harris CS and the anisotropic one are close.
5 Experimental data
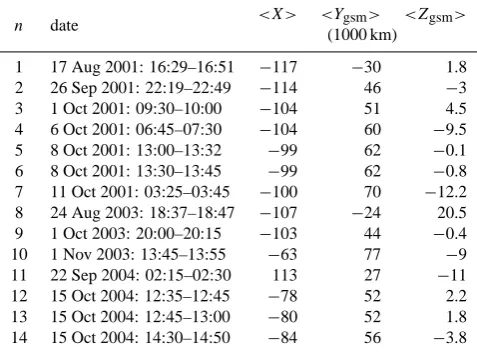
Oscillations of the magnetotail current sheet (flappings) were regularly observed by the multispacecraft Cluster mission (Sergeev et al., 2004; Runov et al., 2006; Petrukovich et al., 2006). To compare with the predictions of our theory a vast variety of such flapping motions, we select a group of fast quasi-periodic oscillations (with periods of not longer than 3 min). The set of fourteen events from the years 2001, 2003 and 2004 contains 160 fast crossings (Table 1). The mag-netic field and the plasma density (measured by CODIF at C4) data were taken from the CAA database.
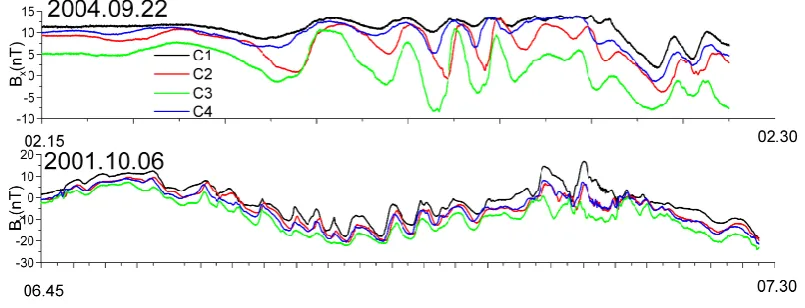
[image:4.595.50.285.277.463.2]Fig. 4. Component of magnetic fieldBxobserved by four spacecraft and comparison of the current density profile with that of our TCS model (in the insert). Individual crossings are marked by numbers.
Fig. 5. Two other examples of wavy events (see the text for details).
plasma sheet has values of Bz and By within 5 nT and most often around 1–2 nT. This subclass is distinctly dif-ferent from, for example, the slower and steeper (up to 80-degree tilts) oscillations typical of situations with a largeBz
(Petrukovich et al., 2006). In this sense, the statistics of Sergeev et al. (2004) and Runov et al. (2006), including all the fast crossings during 2001, are more general and con-tain some of our examples. On the other hand, our selection includes the data from the years 2003 and 2004 and some additional events from 2001 missed by Runov et al. (2006) due to formal reasons (for example, due to the absence of the neutral plane crossings).
As a first example, we choose one event previously anal-ysed thoroughly by Nakamura et al. (2006). Figure 4 demon-strates a magnetic field Bx, typical of our statistics. The twelve individual crossings forming a quasi-periodic se-quence are marked by number. The two main frequencies areν1≈0.06 Hz andν2≈0.0125 Hz (found with the help of Fourier analysis). The current density profile of a sam-ple crossing (#1) is quite consistent with the prediction of our anisotropic TCS model (insert in Fig. 4). The detailed comparison of the profiles was performed by Artemyev et al. (2008).
For a better illustration of the selected events, two addi-tional examples are shown in Fig. 5. The event of 22 Septem-ber 2004 helps us to understand the vertical spatial scale of oscillations, which is of the order of a Cluster tetrahedron size∼1000 km. The spacecraft outside the embedded sheet at the level of Bx∼15 nT practically does not observe any
oscillation, but Cluster 3 located near the neutral plane ob-serves waves with a magnitude of about 10 nT and a period of about one minute. Oscillations occur in a quiet thin sheet after the period of thinning and stretching (Petrukovich et al., 2007) and immediately before the start of the dipolarization. This interesting coincidence between the appearance of such oscillations and sheet disruption will be studied in following publications.
The event from 6 October 2001 exhibits oscillations with rather small amplitudes, observed at a distance by Cluster from the neutral plane. This event therefore was not included in Runov et al.’s statistics (2006), but otherwise the properties of such oscillations are quite typical.
Events similar to our statistics have also been found in the 2005–2007 Cluster data. However, for this period, it was impossible to determine wave directions and spatial scales because of the large spacecraft separation (∼1.5RE).
[image:5.595.96.499.254.408.2]Fig. 6. Statistics of 160 fast crossings. Left: directions of normal vector projections to theXY plane for each CS crossing. Centre: the histogram of valuesvDvφ. Right: the histogram of valuesλLfor two frequencies. The blue color denotes the higher frequency and the red color – the smaller one (see text for details). Dashed boxes denote regions roughly corresponding to the theory.
Table 1. Fourteen events with fast monochromatic flapping mo-tions.
n date <X> <Ygsm> <Zgsm> (1000 km)
1 17 Aug 2001: 16:29–16:51 −117 −30 1.8
2 26 Sep 2001: 22:19–22:49 −114 46 −3
3 1 Oct 2001: 09:30–10:00 −104 51 4.5
4 6 Oct 2001: 06:45–07:30 −104 60 −9.5
5 8 Oct 2001: 13:00–13:32 −99 62 −0.1
6 8 Oct 2001: 13:30–13:45 −99 62 −0.8
7 11 Oct 2001: 03:25–03:45 −100 70 −12.2
8 24 Aug 2003: 18:37–18:47 −107 −24 20.5
9 1 Oct 2003: 20:00–20:15 −103 44 −0.4
10 1 Nov 2003: 13:45–13:55 −63 77 −9
11 22 Sep 2004: 02:15–02:30 113 27 −11
12 15 Oct 2004: 12:35–12:45 −78 52 2.2
13 15 Oct 2004: 12:45–13:00 −80 52 1.8
14 15 Oct 2004: 14:30–14:50 −84 56 −3.8
We obtain the values of sheet velocity along the normal vnand the normal direction for each crossing as well as the
magnitude of drift velocityvD= jenpBx=0averaged over
the time of the given crossing (j is the current density de-fined with the curlometer technique andvn can be obtained
as1r
1twhere1t is the time shift between the space-craft observations and1r is the distance between the space-craft). We assume that the phase velocity of wavevφ is of
the order ofvn. The estimation of the wavelength of these
oscillations is λ=vϕ
ν (where ν – frequency of oscilla-tion). Another spatial scale – sheet thickness – was estimated asL=Bext
|j|Bx=0. Here,Bext2 8π=1.17Tpnp (the factor
1.17 is used to account for the electron contribution to the total pressure).
Finally, the values of sheet velocityvϕ and drift velocity
vD, the estimates of wavelength and sheet thickness and the
directions of propagation normal in theXY plane for all 160 crossings are summarized in Fig. 6. In order to access the spread in our estimates, we work out the wavelengths for the two frequencies corresponding to the two main maxima of the spectral power. The dominant direction of wave propa-gation in theXY plans is almost along the current (Y ). The wave phase velocities are of the order of drift velocity. The wavelengths of the oscillations are of the order of thickness of CS. Theoretical values obtained in our linear analysis of drift instabilities are shown by boxes (Fig. 6) and are quite consistent with the observations.
6 Discussion and conclusions
The linear stability analysis of low frequency wave modes propagating in the thin current sheet shows that unsta-ble modes can have two different polarizations (with the perturbed vector potentials A1=A1yey+A1zez and
A1=A1yey+A1xex). These modes can also be symmetrical
and asymmetrical. Perturbation modes such as the classi-cal sausage and kink modes might exist in the counter-phase regime, i.e. if one of them is suppressed atθ∼π2, the sec-ond one reaches a maximum growth rate at this angle. The growth rate of wave modes is obtained as a function of both the amplitude of the wave vector and its direction. Contrary to the tearing stability of the Harris CS withBz6=0 (Pellat
et al., 1991), in the anisotropic TCS, tearing has a positive growth rate (see the detailed discussion by Zelenyi et al., 2008).
[image:6.595.49.288.316.492.2]events could also exist in magnetotail), their configuration could actually be a mix of differing polarizations and sym-metry.
A special class of fast quasi-periodic flapping motions of CSs, observed by Cluster during 2001 to 2004, has properties quite consistent with these theory predictions: the directions of the observed flapping motions generally correspond to the current direction, while the typical velocity of the motion is comparable to the drift velocity of the CS. The frequencies and scales of the oscillations are also in agreement with the theory.
Since the direction of plasma drift velocity in any CS co-incides with the direction of the current, these low frequency eigenmodes should possess properties of drift waves. This feature is very similar both in the Harris CS model (Lapenta and Brackbill, 1997; Buechner and Kuska, 1999; Daughton, 1999) and in the model of anisotropic TCS, but the latter predicts the value of a wave frequency at least a factor of 4–5 smaller than in Harris-like models. The broad variety of Cluster flapping events was interpreted by a number of mod-els, including ones with a non-drift nature (Golovchanskaya et al., 2005; Erkaev et al., 2008; Saito et al., 2008). However, we show that at least this subclass of wavy flapping can be described by drift eigenmodes.
Acknowledgements. This work was supported in part by the RF
Presidential Program for State Support of Leading Scientific Schools (project no. NSh-472.2008.2) and the Russian Foundation for Basic Research (project nos. 08-02-00407, 06-05-90631 and 07-02-00319).
Editor in Chief W. Kofman thanks C. Cully and another anony-mous referee for their help in evaluating this paper.
References
Artemyev, A. V., Petrukovich, A. A., Zelenyi, L. M., Malova, H. V., Popov, V. Y., Nakamura, R., Runov, A., and Apatenkov, S.: Com-parison of multi-point measurements of current sheet structure and analytical models, Ann. Geophys., 26, 2749–2758, 2008, http://www.ann-geophys.net/26/2749/2008/.
Baumjohann, W. and Treumann, R. A.: Basic space plasma physics, Imperial College Press, London, 1996.
Baumjohann, W., Roux, A., Le Contel, O., Nakamura, R., Birn, J., Hoshino, M., Lui, A. T. Y., Owen, C. J., Sauvaud, J.-A., Vaivads, A., Fontaine, D., and Runov, A.: Dynamics of thin current sheets: Cluster observations, Ann. Geophys., 25, 1365–1389, 2007, http://www.ann-geophys.net/25/1365/2007/.
B¨uchner, J. and Kuska, J.-P.: Sausage mode instability of thin cur-rent sheets as a cause of magnetospheric substorms, Ann. Geo-phys., 17, 604–612, 1999,
http://www.ann-geophys.net/17/604/1999/.
Coppi, B., Laval, G., and Pellat, R.: Dynamics of the geomagnetic tail, Phys. Rev. Letters, 16(26), 1207–1210, 1966.
Daughton, W.: The unstable eigenmodes of a neutral sheet, Phys. Plasmas, 6(4), 1329–1343, 1999.
Dobrowolny, M.: Instability of a neutral sheet, Nuovo Cimento, LV B(2), 427–441, 1968.
Erkaev, N. V., Semenov, V. S., and Biernat, H. K.: Mag-netic double gradient mechanism for flapping oscillations of a current sheet, Geophys. Res. Lett., 35(2), L02111, doi:10.1029/2007GL032277, 2008.
Galeev, A. A. and Zelenyi, L. M.: Tearing instability in plasma con-figurations, Zhurnal Eksperimental’noi i Teoreticheskoi Fiziki, 70(6), 2133–2151, 1976 (in Russian).
Golovchanskaya, I. V. and Maltsev, Y. P.: On the identification of plasma sheet flapping waves observed by Cluster, Geophys. Res. Lett., 32, L02102, doi:10.1029/2004GL021552, 2005.
Harris, E. G.: On a plasma sheet separating regions of oppositely directed magnetic field, Nuovo Cimento, 23, 115, 1962. Kan, J. R.: On the structure of the magnetotail current sheet, J.
Geophys. Res., 78, 3773–3781, 1973.
Lapenta, G. and Brackbill, J. U.: A kinetic theory for the drift-kink instability, J. Geophys. Res., 102(A12), 27099–27108, 1997. Nakamura, R., Baumjohann, W., Runov, A., and Asano, Y.: Thin
current sheets in the magnetotail observed by Cluster, Space Sci. Rev., 122, 29–38, 2006.
Pellat, R., Coroniti, F. V., and Pritchett, P. L.: Does ion tearing exist? Geophys. Res. Lett., 18, 143–146, 1991.
Petrukovich, A. A., Zhang, T. l., Baumjohann, W., Nakamura, R., Runov, A., Balogh, A., and Carr, C.: Oscillatory magnetic flux tube slippage in the plasma sheet, Ann. Geophys., 24, 1695– 1704, 2006,
http://www.ann-geophys.net/24/1695/2006/.
Petrukovich, A. A., Baumjohann, W., Nakamura, R., Runov, A., Balogh, A., and R`eme, H.: Thinning and stretching of the plasma sheet, J. Geophys. Res., 112(A10), A10213, doi:10.1029/2007JA012349, 2007.
Runov, A., Sergeev, V. A., Nakamura, R., Baumjohann, W., Ap-atenkov, S., Asano, Y., Takada, T., Volwerk, M., V¨or¨os, Z., Zhang, T. L., Sauvaud, J.-A., R`eme, H., and Balogh, A.: Local structure of the magnetotail current sheet: 2001 Cluster observa-tions, Ann. Geophys., 24, 247–262, 2006,
http://www.ann-geophys.net/24/247/2006/.
Saito, M. H., Miyashita, Y., Fujimoto, M., Shinohara, I., Saito, Y., Liou, K., and Mukai, T.: Ballooning mode waves prior to substorm-associated dipolarizations: Geotail observations, Geo-phys. Res. Lett., 35(7), L07103, doi:10.1029/2008GL033269, 2008.
Schindler, K.: A theory of the substorm mechanism, J. Geophys. Res., 79(19), 2803–2810, 1974.
Schindler, K.: Physics of space plasma activity, Cambridge Uni-versity Press, ISBN: 9780521858977, doi:10.2277/0521858976, November 2006.
Sergeev, V., Runov, A., Baumjohann, W., Nakamura, R., Zhang, T. L., Balogh, A., Louarnd, P., Sauvaud, J.-A., and Reme, H.: Ori-entation and propagation of current sheet oscillations, Geophys. Res. Lett., 31(5), L05807, doi:10.1029/2003GL019346, 2004. Silin, I., B¨uchner, J., and Zelenyi., L.: Instabilities of
collision-less current sheets: theory and simulations, Phys. Plasmas, 9(4), 1104–1112, 2002.
Sitnov, M. I., Malova, H. V., and Lui, A. T. Y.: Quasi-neutral sheet tearing instability induced by electron preferential acceleration from stochasticity, J. Geophys. Res., 102(A1), 163–174, 1997. Sitnov, M. I., Swisdak, M., Guzdar, P. N., and Runov, A.: Structure
and dynamics of a new class of thin current sheets, J. Geophys. Res., 111(A8), A08204, doi:10.1029/2005JA011517, 2006.
Volwerk, M., Glassmeier, K.-H., Runov, A., Baumjohann, W., Nakamura, R., Zhang, T. L., Klecker, B., Balogh, A., and R`eme, H.: Kink mode oscillation of the current sheet, Geophys. Res. Lett., 30(6), 1320, doi:10.1029/2002GL016467, 2003. Zelenyi, L. M., Malova, H. V., Popov, V. Yu., Delcourt, D., and
Sharma, A. S.: Nonlinear equilibrium structure of thin currents sheets: influence of electron pressure anisotropy, Nonlin. Pro-cesses Geophys., 11, 579–587, 2004,
http://www.nonlin-processes-geophys.net/11/579/2004/.
Zelenyi, L. M., Malova, H. V., Popov, V. Y., Delcourt, D. C., Ganushkina, N. Y., and Sharma, A. S.: “Matreshka” model of multilayered current sheet, Geophys. Res. Lett., 33(5), L05105, doi:10.1029/2005GL025117, 2006.