SRef-ID: 1432-0576/ag/2004-22-747 © European Geosciences Union 2004
Annales
Geophysicae
Location accuracy of long distance VLF lightning location network
C. J. Rodger1, J. B. Brundell2, R. L. Dowden2, and N. R. Thomson1 1Department of Physics, University of Otago, Dunedin, New Zealand 2LFEM Research Ltd., 161 Pine Hill Road, Dunedin, New Zealand
Received: 19 August 2003 – Accepted: 12 November 2003 – Published: 19 March 2004
Abstract. An experimental VLF WorldWide Lightning Location (WWLL) network is being developed to provide realtime locations of cloud to ground lightning discharges occurring throughout the globe. This network has expanded from a limited number of stations in the Western Pacific to its current state of 11 stations, in most longitude sectors, with additional stations planned in the near future. As part of the initial testing phase of the WWLL the network has operated in a simple mode, sending the station trigger times into a central processing point rather than using the sferic Time of Group Arrival (TOGA). During this initial stage, a signifi-cant quantity of lightning location data has been collected, some of which is being applied to research questions. In this paper the operation of the WWLL network is described, and the location accuracy of the pre-TOGA WWLL network is characterised. This is performed by contrasting commercial lightning location data from an Australian network, Kattron, over 2 days in January 2002, with 4 WWLL stations covering the same region. It was found that there were 426 matched lightning events, corresponding to lightning discharges with large lightning return stroke peak currents (mean absolute peak current of∼26 kA compared with∼12 kA for all Kat-tron events). By considering the random errors in the dif-ference locations between the matching lightning events, an appropriate Gaussian timing error for the WWLL network of receiving stations is determined, and hence an estimate for the global location errors for the existing 11-station net-work is found. The “worst-case” global location error for the existing network ranges spatially from 7.5–100 km, with the global median being 15 km, and the global mean 30 km. When the TOGA method is implemented, the station tim-ing errors will decrease, allowtim-ing for an increase in the loca-tion accuracies. Hence, the localoca-tion accuracy estimates de-termined in this paper will be very conservative for the future WWLL network employing the TOGA technique.
Key words. Meteorology and atmospheric dynamics (light-ning, atmospheric electricity, instruments and techniques) Correspondence to: C. J. Rodger
1 Introduction
Lightning discharges are powerful impulsive sources of elec-tromagnetic energy over a wide bandwidth (up to optical), with significant radiated electromagnetic power from a few hertz to several hundred megahertz (Magono, 1980), and the bulk of the energy radiated in the frequency bands<30 kHz (Pierce, 1977). Passive lightning location methods rely upon the energy released by the lightning discharge, acous-tically (thunder), opacous-tically (lightning), and electromagneti-cally (Uman, 1987). Today, commercial lightning location networks are in operation in many regions of the world, us-ing multiple stations to locate the source of lightnus-ing elec-tromagnetic radiation pulses. The economic advantages that many groups obtain from accurate and virtually instanta-neous lightning location data, results in this data being in high demand from many industries, such as electricity gen-erators and distributors, aviation, forestry, sporting groups, insurance companies and weather forecasters (Cummins et al., 1998b). In addition to these groups, there is also strong scientific interest in the application of lightning data to a wide range of research topics, including lightning and re-lated thunderstorm processes (Lyons et al., 1998), high al-titude discharges (Rodger, 1999), global warming (Williams, 1992, Schlegel et al., 2001), regional meteorological pro-cesses (Hamid et al., 2001), production of important trace chemicals (Jourdain and Hauglustaine, 2001), determination of ionospheric parameters (Cummer et al., 1998), and losses from the Van Allen radiation belts (Rodger and Clilverd, 2002).
lightning detection networks require such high location ac-curacies to allow electrical power transmission companies to quickly locate lightning produced line faults or to assist in-surance inspectors in checking claims. Such networks rely upon the first few microseconds of the lightning pulse re-ceived in the MF band (0.3–3 MHz), thus avoiding the sky wave (that which reflects from the ionosphere), and process-ing only the ground wave (which has high attenuation at the high frequencies used). Thus, NLDN requires>100 ground stations to cover the contiguous US (∼107km2), correspond-ing to a ground station density of∼10 Mm−2. This high den-sity of ground stations is not commercially feasible for large areas of low population density or over the oceans.
Two approaches have been put forward to decrease the rel-atively high cost and complexity of multi-station MF light-ning detection networks. Techniques have been developed to allow a single-station lightning location (which might be more appropriate for an aircraft or vessel), often by combin-ing a direction findcombin-ing method with a procedure by which the distance of the lightning discharge can be estimated (see the review in Rafalsky et al. (1995)). One such technique was validated by comparing the single station determined posi-tions with those reported by a commercial lightning detection network (Brundell et al., 2002). Making use of 85 sferics observed at near Darwin, Australia, it was found that the 68% accuracy limits for the “Kharkov” single station light-ning location method (developed by Rafalsky et al., 1995) were∼4◦in bearing and∼73 km in range (Brundell et al., 2002). In this paper we will concentrate upon an another approach which makes use of the considerable sferic power present in the VLF band (3–30 kHz), such that very-long range remote sensing is possible; these VLF signals can be received thousands of kilometres from the source (Crom-bie, 1964)), as the electromagnetic energy propagates with low attenuation inside the waveguide formed by the conduct-ing Earth and the lower boundary of the ionosphere, termed the Earth-Ionosphere Waveguide (EIWG). Propagation over such ranges in the EIWG disperses the initial sharp pulse of the lightning stroke into a wave train lasting a millisecond or more. The amplitude of the received sferic wave train rises slowly (over a few hundred microseconds) from the noise floor, so there is no sharp onset and no sharply defined Time of Arrival (TOA) at the receiving station. The use of differ-ing sferic frequency ranges in multi-station lightndiffer-ing loca-tion networks has been discussed by Cummins and Murphy (2000) and Dowden et al. (2002).
Recognising the low-capital requirements of lightning-location networks operating in the VLF-band, a 7-station sferic observational network has been operated by the UK Met Office from the United Kingdom (5 stations), Gibraltar, and Cyprus, and provides operational lightning observations over much of Europe. This measures the Arrival Time Differ-ences (ATD) between sferics received at two sites by taking the cross-correlations of the full VLF waveforms that have been transmitted back to a central processing station (Lee, 1986a, 1986b, 1989). Through a minimization process an estimate of the discharge location is found from a minimum
of 3 ATD measurements, i.e. from a sferic observed at a mini-mum of 4 stations. Building on the ATD technique developed for the UK Met Office network, experimental VLF ATD net-works have been operated in the United States (Morales et al., 2003), and Europe (Chronis and Anagnostou, 2003). In the earlier version of the UK Met Office network, the ATD system used atomic clocks for its time stamp and phone lines to transmit the waveform data. The more recent experimental networks have relied upon Global Positioning System (GPS) technology for timing and broadband internet connections to transmit the lightning VLF waveforms to the central station. The use of the waveform cross-correlation to determine the ATDs is required to compensate for the dispersion of the lightning generated sferic as it propagates to the receiv-ing stations inside the EIWG. An alternative approach is to determine the Time of Group Arrival (TOGA) of the sferic wave-train received at each station, determined relative to the GPS at each site from the progression of phase versus frequency using the whole waveform (Dowden et al., 2002). The TOGA method avoids the requirement of transmitting the entire VLF waveform back to a central station for pro-cessing; the lightning locations can be determined from dif-ferences in the TOGA times using the same residual min-imization methods employed in the ATD technique (Lee, 1986a). This decreases the internet costs associated with long-range lightning location data-transfers, and means that “normal” UDP (User Datagram Protocol) internet transmis-sion will provide an acceptable real-time lightning location (<10 s) without the requirement of special broadband con-nections.
Low-Frequency Electromagnetic Research Ltd. is cur-rently creating an experimental VLF World Wide Lightning Location (WWLL) network through collaborations with re-search institutions across the globe. As part of the initial testing phase, the stations have operated in a simple mode, sending the trigger time, relative to GPS, back to the cen-tral station (in Dunedin, New Zealand) for processing to pro-duce a lightning location. Triggering occurs when the dif-ference between successive samples exceeds the threshold, Vt h. The trigger time is the time of the second digitised
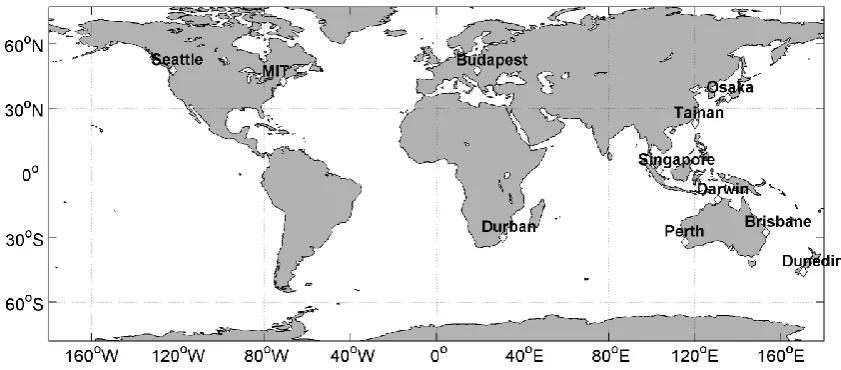
Fig. 1. Locations of the 11 VLF receiving stations (shown as diamonds) currently returning lightning trigger times to the central processing
point in Dunedin, New Zealand.
Table 1. Locations and hosts of the 11 VLF receiving stations currently operating in the VLF WorldWide Lightning Location Network.
Location Latitude (N) Longitude (E) Host
Dunedin −45.8639 170.514 University of Otago
Darwin −12.3718 130.868 Northern Territory University Perth −32.0663 115.836 Murdoch University Brisbane −27.5534 153.052 Griffith University Osaka 34.8232 135.523 Osaka University
Singapore 1.2971 103.779 National University of Singapore Tainan 22.996 120.219 National Cheng Kung University Budapest 47.4748 19.062 Etvs University
Seattle 47.654 −122.309 University of Washington
MIT 42.3604 −71.0894 Massachusetts Institute of Technology Durban −29.8711 30.9764 University of Natal
accuracy of a global network of WWLL receiving stations as currently deployed and recording data. The basic oper-ation of the WWLL receiving stoper-ations, the locoper-ation finding process, network operation, and TOGA calculation are de-scribed in Dowden et al. (2002).
2 WWLL network description
2.1 VLF receiving stations
All of the current VLF WWLL receiving stations are located in built-up areas unsuitable for use of magnetic loop anten-nas at VLF because power line interference will dominate over the magnetic field of the sferic. However, this is not true for the sferic electric field because at VLF even ade-quate conductors, such as ferroconcrete buildings, remain at ground potential and shield man-made electric fields gener-ated within them. Consequently, the WWLL receiving sta-tions require only a short (1.5 m) whip antenna on a tall
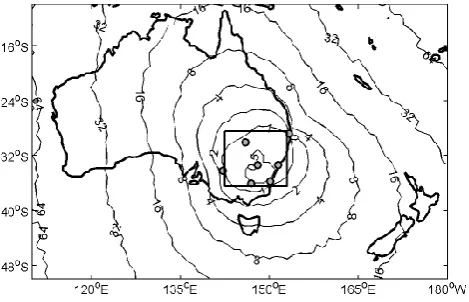
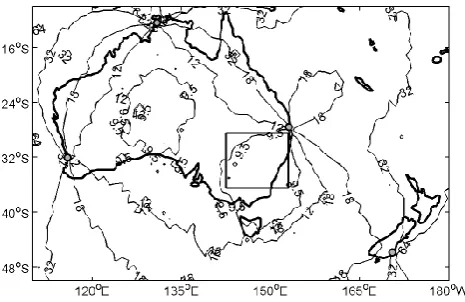
[image:3.595.130.464.320.471.2]Fig. 2. The estimated location accuracy of the Kattron LPATS TOA
lightning location network. The contours have units of kilometres.
P.I. (R. L. Dowden) would be pleased to hear from anyone who could help bridge the larger gaps. Our initial analysis will focus upon the 4 stations in Australia and New Zealand (above the line in Table 1) which allow for the best compar-ison with commercial lightning location data as outlined in Sect. 6 below.
2.2 Selection of a common lightning stroke
The very long range of VLF propagation makes the task dif-ficult of sorting the TOGA values returned from each station (expected to reach∼20) into sets due to a common lightning stroke. This is because the average rate of sferics received at any one station is about 30 s−1, corresponding to an average time between sferics of about 33 ms, which is also the time for propagation over 10 Mm. To make matters worse, the sferic rate varies greatly about this average. We currently ad-just the detection threshold,Vt h, to reduce detection of very
distant, and so generally weaker, sferics. In most cases, the station which first detects a given lightning stroke (i.e. that with the earliest trigger time) will be the station nearest to the discharge point. This earliest trigger time will be fol-lowed by a series of later trigger times returned for process-ing by other stations. A group ofNTime Of Arrivals (1 TOA from each ofN stations) can all be due to a single stroke if all non-redundant TOA differences are less than the travel time from one station to another; the interstation travel times are pre-calculated using a representative VLF group veloc-ity and stored as a 16×16 matrix termed “MAXTOA”. If this test is passed, it indicates that all the TOA times may be due to a common stroke. While this test provides a neces-sary condition for commonality, it is not sufficient to deter-mine that all the observed TOAs are due to a common dis-charge. Nonetheless, this rather simple test appears to ad-equately combine the received station TOAs into lightning locations. On average, around one-third to one-half of the TOAs sent by the network are able to be combined to pro-duce locations, although a significantly lower percentage of these locations (around one-third) have small residual values, suggesting good quality lightning locations. The residual is
an indication of the error remaining after the minimization processes has produced a location (e.g. Lee, 1986a). It may be that loweringVt h(or allowing more triggers, as explained
in Sect. 2.3) to improve detection rates, and the inclusion of additional stations will necessitate the use of a more complex algorithm to select common sferics from a stroke, along the lines proposed previously (Dowden and Rodger, 2002). 2.3 Limitation of maximum station triggering rate
During the testing phase of the Western Pacific network, it was found that under certain conditions one of the receiving stations may trigger at an unrealistically high rate (thousands per second), flooding the central processing station with bad TOA values, such that no sensible lightning location esti-mates are possible. This can happen when an active thun-derstorm moves very close to a WWLL station and may be caused by the high electric fields near the thunderstorm. This issue is not unique to our WWLL stations, and also occurs for the MF receiving stations commonly deployed in com-mercial networks (personal communication, Max Thomas, GPATS, Australia). Such runaway stations can “saturate” the central processing station, while also generating Internet charges with no returns. For these reasons since February 2003, the station triggering algorithm incorporates an auto-matic threshold control which limits the maximum number of triggers a station may return to the central station each second by slowly increasing the trigger threshold over sev-eral minutes. The maximum trigger rate is user-defined but is currently set so that the long-term average triggering rate will be 5 per second. Before the inclusion of the automatic threshold control, high fixedVt hdetection threshold values
were used to avoid network saturation.
3 Modelling location accuracies of multi-station net-works
with a user-specified standard deviation. The software has been checked against previous Monte Carlo estimates of the location accuracy of the UK Met Office ATD network (Fig. 1 of Lee (1986b)) and found to agree very well.
The computer simulation of the location accuracy of light-ning location networks is employed below to contrast a com-mercial lightning network with the VLF WWLL data.
4 Kattron lightning location data
Kattron, an Australian based company, operates a commer-cial TOA (Time of Arrival) lightning location network, us-ing a network of Lightnus-ing Positionus-ing and Trackus-ing System (LPATS) TOA receivers. The LPATS receivers were supplied by Global Atmospherics Inc., and are similar to those used as part of the NLDN (Cummins et al., 1998a). In 2002 the Kat-tron network was made up of 7 LPATS receivers, positioned to achieve sub-kilometre location accuracy and high detec-tion efficiencies over most of the high populadetec-tion density re-gions in Australia (primarily the south-east of the country). The estimated location accuracy for the 7 LPATS TOA sen-sor Kattron network (grey circles) are shown in Fig 2, lated through the process outlined in Sect. 3. In this calcu-lation we have assumed a Gaussian timing error of 2.1µs, assuming the station-to-station TOA errors to be indepen-dent, along with a standard deviation of 1.5µs TOA error for each station, suggested as suitable for an LPATS TOA network (Cummins et al., 1998a). An indication of the de-tection efficiency of the 2002 Kattron network configuration has been presented for an earlier 6-receiver Kattron configu-ration (Fig. 2 of Brundell et al., 2002).
Lightning location data sets from the Kattron network were purchased for two days, 23–24 January 2003. The data included all the lightning strokes located by Kattron and, therefore, included some events far from the network itself (i.e. Papua New Guinea). In order to compare the Kattron and WWLL locations, we have limited the Kattron data to that region inside which the Kattron rms location accuracy is
∼1 km or better, as shown by the black square in Fig. 2. Be-yond this region the Kattron location uncertainties rapidly in-crease, becoming significantly larger than that of the WWLL, as shown below. Inside the selected region the Kattron data is significantly more accurate than the expected accuracy of the WWLL network, and hence can provide an estimate of the WWLL location accuracy. On the basis of the detection efficiencies for the 1996 Kattron configuration, we estimate that>80% of CG strokes occurring inside the selected region will be detected by Kattron (Fig. 2 of Brundell et al., 2002).
5 Results
5.1 Coincident lightning
[image:5.595.310.547.62.240.2]In order to make comparisons between the location esti-mates for lightning discharges by the Kattron network and WWLL network data, WWLL events were selected which
Fig. 3. Time differences between matching events detected by the
Kattron and WWLL networks.
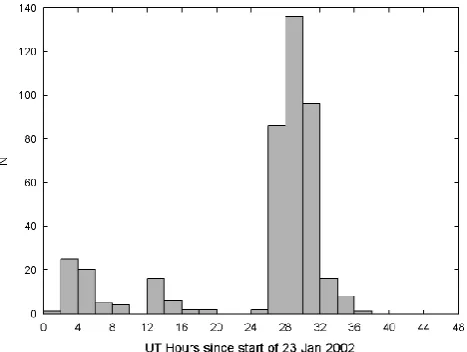
Fig. 4. Diurnal variation of the matching events detected by the
Kattron and WWLL networks on 23–24 January 2002.
[image:5.595.312.546.291.467.2]Fig. 5. Distribution of return stroke peak currents determined by
[image:6.595.308.546.62.242.2]the Kattron lightning network. The dark bars show the distribution for all lightning events detected over 23–24 January 2002, while the lighter events show the current distribution for those events which were also detected by the experimental WWLL network.
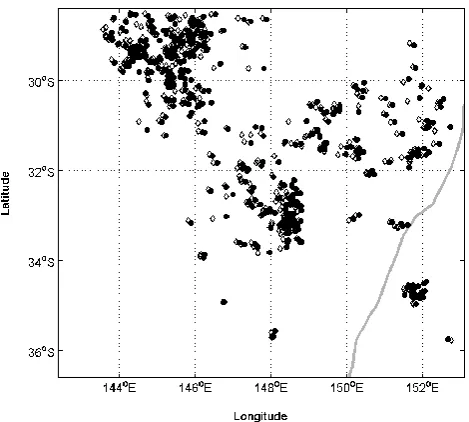
Fig. 6. The positions of the matching lightning events as determined
by the Kattron (open diamonds) and WWLL data sets (closed cir-cles). The gray line is part of the east coast of Australia.
the location accuracy of the WWLL network in the “worst-case” situation (with only the minimum of 4 receiving sta-tions involved in each location operation).
Under these restrictions a total of 426 matching lightning events were found. The time differences between the Kat-tron and WWLL events are shown in Fig. 3. The distribu-tion peaks at∼0.5 ms as the Kattron data is provided with 1-ms resolution, while the WWLL lightning data has 1-µs resolution. Note that there are no matching lightning events with time differences greater than |2 ms|, giving us good confidence that we are correctly identifying coincident
light-Fig. 7. The east-west and north-south distance differences between
the 426 matched lightning event locations (WWLL-Kattron). The dotted lines indicate the median values of these differences.
ning observations. The diurnal variation of the 426 matching events is shown in Fig. 4 over the 2-day period. The major-ity of the events come from an active period around 02:00– 09:00 UT (∼10:00–17:00 LT) on 24 January 2002.
[image:6.595.50.285.326.537.2]locations tend to be located eastwards of the Kattron loca-tions. This is confirmed in Fig. 7, which shows the east-west and north-south contributions of the WGS-84 Ellipsoid de-termined distance differences between the matched locations (WWLL Kattron). The dotted lines indicate the median val-ues of the differences. In the north-south direction the me-dian location difference is∼1 km southwards, significantly less than the total scatter. However, there appears to be a sta-tistically significant offset in the east-west direction differ-ence, with the median WWLL locations shifted∼8 km east-wards of the Kattron locations. Thus, the location uncertainty in the WWLL network appears to have two components: the systematic offset described above, plus a random error. This systematic offset may be related to VLF propagation effects, or processing errors, as discussed in Sect. 6.
5.3 Random errors in the WWLL network
The random error present in the scatter of the differences in Fig. 7 is described by the mean (11 km) and standard devia-tions (9.4 km) in the location differences after removing the systematic offset. As the error in the lightning locations in the Kattron data should not be correlated with the error in the location deduced in the WWLL network data, we can assume that the random errors in the two data sets are independent. Thus, we can say that,
σm2=σKattron2 +σWWLL2 , (1) i.e. the variance of the differences between the two datasets is equal to the sum of the variances of the error in each method. From our matched lightning events we have an estimate of σm=9.4 km, while Fig. 2 indicates that the standard
devia-tions of the errors in the Kattron locadevia-tions will be no more than 1 km. As the Kattron location error is so very low in the spatial region we have selected,σm should indicate the
[image:7.595.310.543.61.212.2]random location error for the WWLL network in this region with this receiver station configuration (limited to the 4 near-est stations). A comparison of the near-estimated WWLL location accuracy in this spatial region with the output of the Monte Carlo simulation described in Sect. 3 allows us to determine the appropriate Gaussian timing error for the WWLL net-work of receiving stations. The modelling suggests that the 4-station WWLL network should have a∼9.5 km location accuracy when the Gaussian timing error is∼35 , producing the accuracy map shown in Fig. 8. A significant portion of this time error will be due to the use of the trigger time rather than the TOGA at the station. For example, random errors of up to±20µs arise because the trigger time is digitised in approximately±20µs steps, the reciprocal of the sam-pling frequency (some sound cards sample at 48 kHz, some at 50 kHz). When the TOGA method is implemented, the station timing errors will decrease, as the TOGA time for a sferic can be determined to within a few hundred nanosec-onds (Dowden et al., 2002), allowing for an increase in the location accuracies. Hence, the location accuracy estimates shown in this paper will be very conservative for the future WWLL network employing the TOGA technique.
Fig. 8. The estimated location accuracy of the WWLL network
when including only the 4 stations nearest to the Kattron high accu-racy region in the same format as Figure 1. A 35µs timing error is assumed for the network.
6 Eastwards offset in WWLL locations
There are two possible explanations for the systematic east-wards offsets in the WWLL locations when compared with those from the Kattron commercial system. The first effect is the anisotropies in VLF propagation in the Earth-ionosphere waveguide. This is considered in the section below. The sec-ond is a recently discovered (July 2003) interference prob-lem that affected the receiving station located at Dunedin, New Zealand. In a manner still poorly understood, the Mat-lab software mapping routines operating on the control sta-tion seem to have led to interference in the recording of the GPS-second pulse at the Dunedin receiver site, such that the Dunedin station could sometimes give somewhat earlier trig-ger times than expected. Such an effect would lead to an av-erage eastwards shift in the locations of events using Dunedin trigger times. This has been corrected, and will not affect the future operation of the network. However, we also need to consider the influence of VLF propagation to determine whether this might play a significant role in location accu-racy for the global network of stations now employed in the WWLL system.
6.1 VLF propagation in long-range lightning networks In the current (experimental) WWLL network operation, sferics are assumed to travel from the discharge point to the receiving station at a fixed group velocityvg=0.9922c,
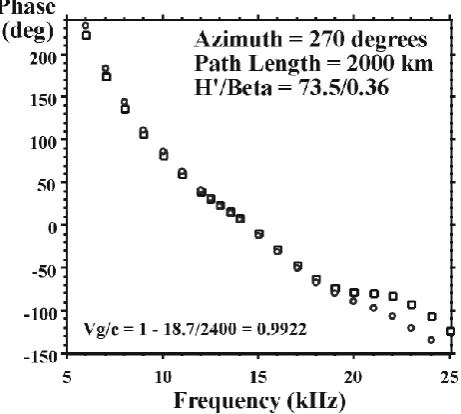
Fig. 9. Variation in the calculated phase at a receiver 2 Mm from
the source with frequency, with propagation in the direction west to east. The squares show results using a ground conductivity for a sea water propagation path, while circles are for low conductivity Earth (10–3 S/m), all shifted by 40◦, to allow for ready comparison of slopes. The fitted line is used to determine the group velocity as a fraction of the speed of light.
Fig. 10. As Fig. 9 but for propagation in the direction east to west.
errors (as described in Sect. 5.3), and may also lead to sys-tematic offsets. The geomagnetic field leads to an east-west anisotropy in VLF propagation, which is the likely cause of a westward shift in lightning positions observed by an ex-perimental US VLF lightning location network (Morales et al., 2003). In addition, there are also differences in signal attenuation between the east to west and west to east propa-gation, which will impact detection efficiencies. For exam-ple, measurements of 10.2 kHz Omega navigation
transmis-sions indicated an attenuation of 2.1±0.3 dB/Mm for west to east, and 2.60.3 dB/Mm for east to west propagation (Nicko-laenko, 1995).
6.2 Group velocity in VLF propagation
We wish to consider whether the propagation velocity of the lightning in the Earth-ionosphere waveguide might vary enough to lead to the observed systematic offset. Att=0, all frequencies at the transmitter are in phase, at least within a range1ω about the transmitter frequency. Downstream at the receiver, att=0, the frequencies at the top of this band, will typically be more phase delayed than the frequencies at the bottom of this band because there will typically be more wavelengths for the high frequencies along the path than for the low frequencies. This rate of change of phase with fre-quency,dφ/dω, at the receiver att=0, can be measured, or calculated using a waveguide propagation program such as ModeFinder. ModeFinder is a numerical propagation code developed by the United States Naval Ocean Systems Cen-ter (NOSC) which assumes a homogeneous ionosphere and ground, including the effects of a spherical Earth (Morfitt and Shellman, 1976). The resulting phase difference at the re-ceiver over the band,1ω, will thus be1ω(dφ/dω) att=0.
Iftg is the group travel time from the transmitter to the
receiver, then after tg seconds, the high frequency phase will have advanced by1ω tg with respect to the low frequency
phase, and as the “pulse” which was at the transmitter att=0 will now have arrived at the receiver, all the frequencies over the band1ωmust now be in phase. Hence,
1ωtg=1ω(dφ/dω) i.e. tg=
dφ
dω. (2) Thus, by measuringdφ/dωfor a lightning flash at the re-ceiver, the time of group arrival can be measured, as is dis-cussed further in Dowden et al. (2002). Alternatively, as is done here, the group travel time, tg, can be found by
cal-culating the phase,φ, at the receiver as a function of trans-mitter frequency,ω, using ModeFinder and sotg=dφ/dωcan
be found for a variety of conditions. Thus, the dependence oftg, and hence the group velocity in the Earth-ionosphere
waveguide, can be found as a function of the direction of propagation direction, ground conductivity, and the state of the D-region ionization levels.
6.3 Results of group velocity calculations
[image:8.595.53.284.381.588.2]difference which is shown in the figures. Hence, thedφ/dω from the graphs gives values for the modifications from the speed of light travel time and velocity. Each figure shows data points for two different ground conditions. A ground conductivity close to that of sea water (4 S/m, which will predominate for the eastward propagation to NZ) is shown as squares, while the ground conductivity similar to the poorest conducting parts of Western Australia (0.001 S/m) is shown as circles.
From the figures it can be seen that even over a wide range of ground conductivities, there is little effect on the group travel times or velocities. In addition, the difference in group velocities between the two propagation directions is only
∼0.1% (vg/cof 0.9913 c.f. 0.9922), which will not create
any significant systematic position errors. Additional calcu-lations undertaken with ionospheric parameters changed to H0=70 km,β=0.45 km-1, appropriate to near overhead Sun, near solar maximum, (Thomson, 1993) had a negligible ef-fect on the group delays from those seen in the figures.
Finally, we considered the effects of a C7.1 solar flare which started at 03:25 UT on 24 January 2002, peaked at 04:39 UT and lasted until 07:06 UT, i.e. during the time of maximum lightning activity over the 2 days for which we have purchased Kattron data. It was found from the match-ing lightnmatch-ing events that the locations durmatch-ing the solar flare period were no clearly more affected by the eastwards shift than those outside of this time.
6.4 Implications
It therefore appears that anisotropies in VLF propagation in the Earth-ionosphere waveguide will not lead to significant systematic eastward offsets in the WWLL locations. We sug-gest that the interference in Dunedin-recorded times is likely to explain the offset. It will be necessary to test this sug-gestion using more modern observations (post July 2003). However, as the WWLL network is now very different from that which existed in January 2002, confirmation that there is no longer a systematic location offset in WWLL data will be left for a consideration of the updated WWLL network, making use of the TOGA technique. It should be noted that WWLL lightning locations, which included Dunedin TOA observations, are somewhat suspect, and are likely to suffer from systematic offsets towards Dunedin (mean of∼8 km). In the specific case considered in this paper, that offset is almost entirely eastwards. For more northern locations the Dunedin anomaly may lead to a similarly significant south-wards component in data collected before July 2003.
7 Estimate of global WWLL location accuracy
[image:9.595.310.548.63.271.2]The analysis above has provided us with an estimate for the “worst-case” WWLL lightning location accuracies in Aus-tralasia, where only the 4 Australasian receiving stations are involved in the location process, as well as an estimate for the timing error for the WWLL network of receiving stations.
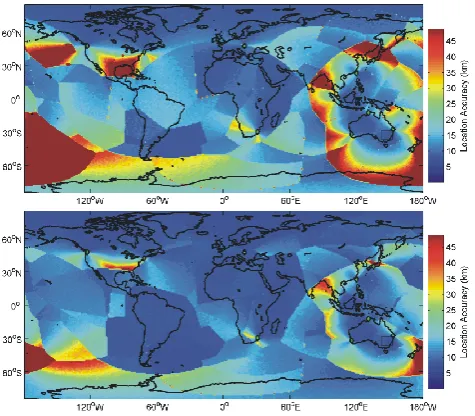
Fig. 11. An estimate of the global location accuracy of the 11
re-ceiving station WWLL network listed in Table 1, assuming a 35µs timing error. The upper panel shows location accuracies assuming that only the minimum 4 receiving stations report a lightning event, while the lower panel shows the same situation for 5 receiving sta-tions.
Fig. 12. The positions of the unmatched locations from the WWLL
data set (black squares), in the same format as Fig. 6.
upon on extrapolation from a small region in Australia. Fu-ture studies need to be undertaken using independent light-ning location data for locations elsewhere in the world, as well as to confirm the improvements in timing errors from the use of TOGAs rather than trigger times in the location process.
8 Discussion
In the 2 days over which the comparison between the exper-imental WWLL network and Kattron data was conducted, the Kattron network reported 30 402 lightning locations in-side the spatial window selected, while the experimental WWLL network reported 698 lightning locations, of which 426 events were found to match. This very low percentage (∼1%) is, however, not indicative of the true detection ef-ficiency of the planned WWLL network, and reflects a pe-riod when the triggering thresholds were set high to avoid network saturation. The aim of the operational WWLL net-work is a 50% flash detection efficiency. While this has not been achieved to date, it is estimated that the flash de-tection efficiency for April–May 2003 was ∼13% in the Asian/Australian region where the station density is the high-est (Rodger and Dowden, 2003).
In addition to the 426 matching events found in the two data sets, there were also 272 WWLL events which did not match Kattron lightning locations. As noted above, the Kat-tron network should have at least an 80% detection efficiency for cloud-to-ground discharges inside the spatial region se-lected in our study. On this basis it seems unlikely that Kat-tron could have missed so many cloud-to-ground discharges which were strong enough for the WWLL to detect. How-ever, the spatial distribution of these “un-matched” events is very similar to those of the matched events (Fig. 12), as would be expected for events produced by discharges
occur-ring inside active thunderstorms. At VLF frequencies the return stroke of cloud-to-ground discharges is the dominant source of received sferics (Pierce, 1977), and thus should strongly dominate the lightning observations, even though there are∼3.5 times more intracloud (IC) lightning flashes (sometimes simply termed “cloud flashes”) than cloud-to-ground (CG) lightning flashes (Mackerras et al., 1998). None the less, at 10 kHz the radiation from IC flashes is∼10% of those of CG flashes (Brook and Ogawa, 1977) and thus IC lightning may be detectable by VLF systems. An exper-imental VLF lightning location network operated in the US detected∼60% of CG discharges and∼10% of IC discharges (Morales et al., 2003), and, therefore, some of the unmatched WWLL events may have been produced by IC discharges rejected by the Kattron lightning location network. In ad-dition, it has been found that some intense CG discharges are rejected by the LPATS-sensors employed by NLDN, as the received waveform does not conform to the standard shape used by the NLDN processing algorithm (Personal communication, Robert Holzworth, 2003). This may also be a source of potential intense lightning discharges which would be recorded by the WWLL but unrecorded by Kat-tron. Wideband recordings undertaken during WWLL ob-servations might allow for the identification of IC and CG events, or at least the confirmation that some form of dis-charges did take place at a given time.
Another possible source of lightning location data by which comparisons could be made with the WWLL network locations is from Earth-orbiting satellites. The Lightning Imaging Sensor (LIS) aboard the Tropical Rainfall Measur-ing Mission satellite detects lightnMeasur-ing optically by observMeasur-ing the neutral oxygen line at 777.4 nm (Orville, 1995). Compar-isons of LIS, NLDN, and VHF radar lightning observations found that the LIS tends to detect cloud to ground (CG) dis-charges towards the end of the discharge process, probably the late stage in-cloud components of the CG discharge, oc-curring in the upper parts of the thundercloud. Differences of∼1 s were possible between the NLDN and LIS detections (Thomas et al., 2000). Such timing differences will make it difficult to make direct comparisons between the WWLL lo-cations and those observed by satellite. None the less, this may allow for some matching lightning events to be found in regions of the Earth where no other lightning detection experiments operate.
9 Conclusions
of the WWLL the network has operated in a simple mode sending the station trigger times into a central processing point, thereby providing the sferic Time of Group Arrival (TOGA). During this initial stage, a significant quantity of lightning location data has been collected, some of which is being applied to research questions. In this paper the loca-tion accuracy of the pre-TOGA WWLL network has been characterised, particularly focusing on the early stages of the network structure where stations were limited to the Western Pacific (pre-March 2003).
Estimates of the location accuracy have been found by comparison with commercial lightning location data pur-chased from an Australian network, Kattron. It was found that there were 426 matched lightning events over two days in January 2002 in a region where the Kattron location error is modelled as being<1 km. These matched events corre-sponded to large Kattron determined lightning return stroke peak currents (mean absolute peak current of∼26 kA com-pared with∼12 kA for all Kattron events). The WWLL loca-tions were found to have both a random and a systematic off-set from the Kattron-determined locations, with WWLL lo-cations systematically displaced by∼8 km eastwards. Mod-elling suggests this is not due to anisotropies in VLF prop-agation in the Earth-ionosphere waveguide, but may be ex-plained by a fault in one of the Australasian receiving stations which has since been rectified.
The random errors in the differences are described by a mean of 11 km and a standard deviation of 9.4 km. A com-parison of this WWLL location accuracy in the spatial re-gion selected with the output of a Monte Carlo simulation allows us to determine the appropriate Gaussian timing er-ror for the WWLL network of receiving stations (∼35µs), and hence simulate the location errors for the existing 11-station network. The “worst-case” global location accuracy for the existing network ranges spatially from 7.5–110 km, with the global median being 15 km, and the global mean 30 km. When the TOGA method is implemented, the station timing errors will decrease, allowing for an increase in the location accuracies. Hence the location accuracy estimates determined in this paper will be very conservative for the fu-ture WWLL network employing the TOGA technique.
Acknowledgements. C. J. Rodger would also like to thank
J. Speight of Dunedin for his support. C. J. Rodger was supported by the New Zealand Marsden Research Fund contract 02-UOO-106, while the Australasian network activities were supported by the Australian Research Council contract LP 0219331. We thank the University of Otago, Dunedin, New Zealand; Northern Ter-ritory University, Darwin, Australia; Murdoch University, Perth, Australia; Griffith University, Brisbane, Australia; Osaka Univer-sity, Japan; National University of Singapore, Singapore; National Cheng Kung University, Tainan, Taiwan; University of Washington, Seattle, USA; Massachusetts Institute of Technology, USA; Etvs University, Budapest, Hungary; and the University of Natal, Dur-ban, RSA for housing our VLF lightning acquisition receivers.
Topical editor O. Boucher thanks A. P. Nickolaenko for his help in evaluating this paper.
References
Brook, M. and Ogawa, T.: The cloud discharge, in lightning, vol. 1, edited by Golde, R. H. Academic Press, New York, 191-230, 1977.
Brundell, J. B., Rodger, C. J., and Dowden, R. L.: Validation of single station lightning location technique, Radio Sci., 37(4), 10.1029/2001RS002477, 2002.
Chronis, T. G., and Anagnostou, E. N.: Error analysis for a long-range lightning monitoring network of ground-based receivers in Europe, J. Geophys. Res., 108(24), 10.1029/2003JD003776, 2003.
Crombie, D. D.: Periodic fading of VLF signals received over long paths during sunrise and sunset. Journal of Research National Bureau of Standards, Radio Science, 68D, 27–34, 1964. Cummer, S. A., Inan, U. S., and Bell, T. F.: Ionospheric D region
remote sensing using VLF radio atmospherics, Radio Sci. 33, 1781–1792, 1998.
Cummins, K. L., and Murphy, M. J.: Overview of lightning detec-tion in the VLF, LF, and VHF frequency ranges, 2000 Interna-tional Lightning Detection Conference, Tucson, Arizona, 1-10, 2000.
Cummins, K. L., Murphy,M. J., Bardo, E. A., Hiscox, W. L., Pyle, R. B., and Pifer, A. E.: A combined TOA/MDF technology up-grade of the U.S, National Lightning Detection Network, J. Geo-phys. Res, 103, 9035–9044, 1998a.
Cummins, K. L., Krider, E. P., and Malone,M. D.: The U.S. national lightning detection network and applications of cloud-to-ground lightning data by electric power utilities, IEEE Trans. Electro-magn. Comp., 40(4), 465–480, 1998b.
Dowden, R. L., and Rodger, C. J.: True global mapping of lightning using widely spaced VLF receivers on the ground, 27th General Assembly of URSI CD-ROM, August 2002.
Dowden, R. L., Brundell, J. B., and Rodger, C. J.: VLF lightning location by time of group arrival (TOGA) at multiple sites, J. Atmos. Sol. Terr. Phys., 64, 817–830, 2002.
Hamid, E. F., Kawasaki, Z.-I., and Mardiana, R.: Impact of the 1997–1998 El ni˜no event on lightning activity over Indonesia, Geophys. Res. Lett., 28, 147–150, 2001.
Jourdain, L., and Hauglustaine, D. A.: The global distribution of lightning NOx simulated on- line in a general circulation model, Phys. Chem. Earth Pt. C-Solar-Terr. Planet. Sci, 26, 585–591, 2001.
Lee, A. C. L.: An experimental study of the remote location of lightning flashes using a VLF arrival time difference technique, Q. J. Royal Met. Soc., 112, 203–229, 1986a.
Lee, A. C. L.: An operational system for the remote location of lightning flashes using a VLF arrival time difference technique, J. Atmos. and Oceanic Tech., 3, 630–642, 1986b.
Lee, A. C. L.: Ground truth confirmation and theoretical limits of an experimental VLF arrival time difference lightning flash locating system, Q. J. Royal Met. Soc., 115, 1147–1166, 1989.
Lyons, W. A., Nelson, T. E., Williams, E. R., Cramer, J. A., and Turner, T. R.: Enhanced positive cloud-to-ground lightning in thunderstorms ingesting smoke from fires, Science, 282, 77–80, 1998.
Mackerras, D., Darveniza, M., Orville, R. E., Williams, E. R., and Goodman, S. J.: Global lightning: Total, cloud and ground flash estimates. J. Geophys. Res., 103, 19 791–19 809, 1998. Magono, C.: Thunderstorms, Elsevier Sci., Amsterdam, 1980. Morales, C. A., Weiman, J. A., Anagnostou, E. N., Goodman,
monitoring by a VLF receiver network: Location error analy-sis and cloud-to-ground and intra-cloud detection efficiency, J. Atmos. Ocean. Tech., 2004. Available in preprint form from: http://sifnos.engr.uconn.edu/ manos/mwa02.pdf.
Morfitt, D. G. and Shellman, C. H.: MODESRCH: An improved computer program for obtaining ELF/VLF/LF propagation data, Tech. Rep. NOSC/TR 141, Nav. Ocean Syst. Cent., San Diego, Calif., 1976. (Available as ADA047508 from Nat. Tech. Inf. Serv., Springfield, Va.)
Nickolaenko, A.P.: ELF/VLF propagation measurements in the At-lantic during 1989, J. Atmos. Sol. Terr. Phys., 57, 821–833, 1995. Orville, R. E.: Lightning detection from ground and space, in hand-book of atmospheric electrodynamics; Vol. 1, second edition, edited by H. Volland, pp. 137–149, CRC Press, Boca Raton, Fl., 1995.
Pierce, E. T.: Atmospherics and radio noise, in Lightning, vol. 1, edited by R. H. Golde, pp. 309–350, Academic Press, New York, 1977.
Rafalsky, V. A., Nickolaenko, A. P. Shvets and Hayakawa, M.: Lo-cation of lightning discharges from a single station, J. Geophys. ResA. V., 100, 20 829–20 838, 1995.
Rodger, C. J.: Red sprites, upward lightning, and VLF perturba-tions, Rev.Geophys., 37, 317–336, 1999.
Rodger, C. J. and Dowden, R. L.: Realtime global mapping of light-ning using widely spaced VLF receivers, XXIII General Assem-bly of the International Union of Geodesy and Geophysics, Ab-stracts Week B, Pg B.193, IUGG, Japan, 2003.
Rodger, C. J. and Clilverd, M. A.: Inner radiation belt electron lifetimes due to whistler-induced electron precipi-tation (WEP) driven losses, Geophys. Res. Lett., 29(19), 10.1029/2002GL015795, 2002.
Schlegel, K., Diendorfer, G., Thern, S., and Schmidt, M.: Thunder-storms, lightning and solar activity – Middle Europe, J. Atmos. Sol.-Terr. Phys., 63, 1705–1713, 2001.
Su, H. T., Hsu, R. R., Chen, A. B., Wang, Y. C., Hsiao, W. S., Lai, W. C., Lee, L. C., Sato, M., and Fukunishi, H.: Gigantic jets between a thundercloud and the ionosphere, Nature, 423, 974-976, 2003.
Thomas, R. J., Krehbiel, P. R., Rison, W., Hamlin, T., Bocci-pio, D. J., Goodman, S. J., and Christian, H. J.: Comparison of ground-based 3-dimensional lightning mapping observations with satellite-based LIS observations in Oklahoma, Geophys. Res. Lett., 27, 1703–1706, 2000.
Thomson, N. R.: Experimental daytime VLF ionospheric parame-ters, J. Atmos. Terr. Phys., 55, 173–184, 1993.
Uman, M. A.: The Lightning Discharge, Int. Geophys. Ser., Vol. 39, Academic Press, San Diego, Calif., 1987.
Watt, A. D.: VLF radio engineering, International monographs in electromagnetic waves, Vol. 14, Pergamon, Oxford, U.K., 1967. Williams, E. R.: The Schumann Resonance: A global tropical
ther-mometer, Science, 256, 1184–1187, 1992.