RESEARCH
Treatment performance comparison
between regular O
3
–BAC and O
3
–BAC with rear
sand filtration: verification in a full-scale study
Kai Yang
1,2, Jianwei Yu
1,2*, Qingyuan Guo
1,3, Chunmiao Wang
1,2, Ping Xia
4, Y. Jeffrey Yang
5and Min Yang
1,2Abstract
Background: To improve the microbial safety of drinking water, an arrangement of O3–BAC with rear sand filtration (O3–BAC–sand) has been proposed. In this study, efforts were devoted to evaluate the benefits and drawbacks of O3– BAC–sand in a full-scale water treatment plant. The performance of the two configurations was compared in terms of particles, turbidity, CODMn and typical odorants and pesticides.
Results: The O3–BAC–sand yielded lower turbidity but higher CODMn (by approximately 7%) in the finished water than regular O3–BAC (sand–O3–BAC). Both systems removed odors in raw water; however, sand–O3–BAC was more effective on septic and musty odorants. The total pesticide removals by sand–O3–BAC and O3–BAC–sand were 78% and 72%, respectively; though the latter had shorter activated carbon durable years.
Conclusion: The re-location of the sand filter would sacrifice the BAC efficiency in removals of organic matter and micropollutants. This tradeoff is a result of the loss of the particulate organic matter removal by sand filters, because locating the sand filter behind BAC causes particle load increase on BAC; some measures of enhanced coagulation should be suggested to improve the turbidity and particle removal. The study will be helpful for improvement of the O3–BAC process in drinking water treatment.
Keywords: Sand–O3–BAC, O3–BAC–sand, Sand filter interception, Drinking water treatment
© The Author(s) 2019. This article is distributed under the terms of the Creative Commons Attribution 4.0 International License
(http://creat iveco mmons .org/licen ses/by/4.0/), which permits unrestricted use, distribution, and reproduction in any medium,
provided you give appropriate credit to the original author(s) and the source, provide a link to the Creative Commons license, and indicate if changes were made.
Background
Ozonation integrated with biological activated carbon (O3–BAC) is adopted more and more often for drinking water purification because of its effectiveness in remov-ing disinfection byproduct precursor sand synthetic organic chemicals [1]. In the treatment train, it is com-mon practice that the O3–BAC unit is placed after sand filtration (regular O3–BAC: sand–O3–BAC) [2], and the presence of some genera might play important roles in the biodegradation taking place in the BAC filter [3]. During the operation, BAC filter would provide a suitable condition for the growth of aquatic micro-animals, which could form a microorganism–protozoa–macroinverte-brate biological chain [4]. Moreover, particles harboring
bacteria, particularly some chlorine-resistant pathogens like Legionella and Chromobacterium [5], could possibly penetrate the BAC bed, and the microorganism could also get through the BAC filter, which would have impact on the drinking water quality. This has been reported in some O3–BAC treatment plant, especially in the south subtropical region in China [6], giving rise to biological safety concerns of the drinking water. One option is O3– BAC with rear sand filtration (O3–BAC–sand), which provides a barrier for reducing the biological risk [7] and has been reported in previous studies [8, 9]. And the O3– BAC–sand process has been applied in some water treat-ments in China such as Shanghai [10], Fuzhou [11], Jinan [12] and Jiaxing [13].
Sand filtration is one key step in drinking water treat-ment to remove particles from raw water [6, 14], and it is also known to be inefficient for removing hydrophilic pollutants, because hydrophilic compounds do not easily
Open Access
*Correspondence: [email protected]
1 Key Laboratory of Drinking Water Science and Technology, Research
adsorb into sand filter beds, whereas hydrophobic com-pounds with logKow > 2.5 tend to adsorb onto particles, resulting in higher removal efficiencies (> 80%) during sand filtration [15, 16]. The filter media intercept and remove particles harboring organic compounds, as well as organic particles like algae escaping from the upstream sedimentation unit [16, 17]. Consequently, post-sedi-mentation particulate organic matters may enter the ozo-nation unit when the sand filter is located downstream of the BAC filter. Furthermore, particulate organic matter can be transformed into dissolved organic carbon (DOC) during the ozonation process [18], and thus increase mass load on the BAC filter. These treatment tradeoffs should be evaluated to determine the benefits and draw-backs of the rear sand filtration for a given drinking water treatment plant.
In this paper, the treatment performance for the rear sand filter arrangement is investigated and compared through experimental studies in a full-scale drinking water treatment plant with two parallel configurations (sand–O3–BAC and O3–BAC–sand). Treatment perfor-mance was compared in the removal of chemical oxygen demand by KMnO4 titration (CODMn), the only param-eter of comprehensive organic material concentration in the Chinese drinking water standard, and particles, tur-bidity, typical odorants as well as some typical pesticides.
Materials and methods Comparative treatment analysis
The water treatment plant of 7 × 10⁵ m3/days capacity in Shanghai, China has two parallel treatment systems: a sand–O3–BAC process and a modified treatment train equipped with a rear sand filter (O3–BAC–sand). The sand–O3–BAC system, of 4 × 10⁵ m3/days production capacity, consists of pre-ozonation, coagulation, sedi-mentation, sand filtration, post-ozonation and BAC in succession. The O3–BAC–sand system, of 3 × 10⁵ m3/ days capacity, varies in the location of sand filtration: pre-ozonation, coagulation, sedimentation, post-pre-ozonation, BAC and sand filtration in succession. The sand–O3– BAC and O3–BAC–sand systems have operated for 47 and 33 months, respectively.
During the four-month study period, typical operation parameters were aluminum sulfate at 40 mg/L (8.0 mg/L as Al2O3 concentration) dose, 105-min sedimentation time, ozone dose of 0.5 mg/L for pre-ozonation (5 min) and 1.0 mg/L for post-ozonation (15 min), sand filtration velocity of 7.9 m/h, the empty bed contact time and filtra-tion velocity of the BAC filter were 16 min and 8.3 m/h, respectively.
The unit processing and treatment efficiency were examined for samples collected at the raw water intake and the effluents from the sedimentation, sand filtration,
post-ozonation and BAC units from May to August in 2015. Analyte included turbidity, particle counts and CODMn, odorant and pesticide compounds. For the determination of turbidity, particle counts and CODMn, a 1-L water sample was taken once or twice every week, and analyzed right after sampling. The samples for odor-ant determination were taken thrice in May and twice every month, stored in a refrigerator after filtration with a glass fiber filter and then taken back to the laboratory for the analyses. The samples for pesticide determination were taken once every month from the systems.
Sample preparation and analysis
The COMMn, particle size, odor compounds, and pesti-cides were analyzed for the collected samples. All rea-gents used in the experiment were of guaranteed reagent grade, and all stock solutions were prepared with Milli-Q water (Millipore). CODMn was measured on a HACH Model DR2800 spectrophotometer (HACH, USA). Solu-ble CODMn (SCODMn) was obtained by measuring the samples after 0.45-μm membrane (GF/F, Whatman, UK) filtration. Insoluble CODMn (inSCODMn) equals Total CODMn (TCODMn) subtracting SCODMn.
Concentrations of 25 pesticides (Table 1) were meas-ured using GC/MS according to Yu [19]. The flavor profile analysis (FPA) method was used to character-ize the odors according to the Standard Methods for the Examination of Water and Wastewater [20]. Typical septic (dimethyl disulfide (DMDS), dimethyl trisulfide, bis(2-chloro-1-methylethyl) ether and musty (2-methyl-isoborneol (2-MIB)) odorants were determined by two-dimensional gas chromatography with time-of-flight mass spectrometry (GC × GC–TOFMS) using the meth-ods in [21].
Finally, particle size distribution was characterized on a Hybrid Particle Counter ZVL (Fuji Electric, Japan), in grab sample mode. The method measures both turbid-ity and particle count in 9 size ranges (1–2 µm, 2–3 µm, 3–5 µm, 5–7 µm, 7–10 µm, 10–15 µm, 15–20 µm, 20–30 µm, > 30 µm).
Results and discussion
Turbidity and particles
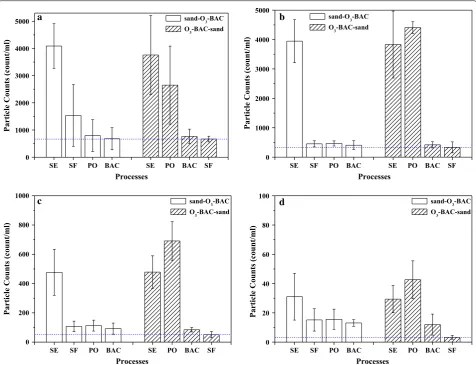
Figure 1 shows the changes of average turbidity along the treatment processes in the two systems. Generally, the finished water in the rear sand filtration system has lower turbidity; in average, 0.12 NTU in sand–O3–BAC vs. 0.04 NTU in O3–BAC–sand (p = 0.020). The day-to-day mon-itoring data of the finished water also exhibited similar results (Fig. 2). For the sand–O3–BAC system, the turbid-ity removal primarily occurred in the sand filtration. Tur-bidity removal in the O3–BAC–sand process occurred in both the BAC and sand filters. A slight increase of tur-bidity after ozonation (Fig. 1) may be the result of fine particle aggregation and subsequent breakup into small sizes, a process reported in [23, 24]. Besides, oxidation of iron and manganese, which can produce some insoluble inorganics like goethite, magnetite and MnO2, has also been reported to be responsible for turbidity increase after ozonation [25]. Changes of particle counts across the treatment train were examined in particle size ranges (Fig. 3). Clearly, in sand–O3–BAC system, sand filtration removed particles over all size ranges, and ozonation Table 1 Information of the twenty-five pesticides compounds
No. Compounds CAS Structure Mol. wt.
1 Hexachlorobenzene (HCB) 118-74-1 C6Cl6 284.78
2 Heptachlor 76-44-8 C10H5Cl7 373.35
3 1-Chloro-2-[2,2,2-trichloro-1-(4-chlorophenyl)ethyl]
benzol 789-02-6 C14H9Cl5 354.49
4 2,2-bis(p-Chlorophenyl)-1,1,1-trichloroethane 50-29-3 C14H9Cl5 354.49 5 2,2-bis(p-Chlorophenyl)-1,1-dichloroethane 72-54-8 C14H10Cl4 320.04 6 2,2-Bis(4-chlorophenyl)-1,1-dichloroethylene 72-55-9 C14H8Cl4 318.03
7 Lindane(r-BHC) 58-89-9 C6H6Cl6 290.83
8 α-Hexachlorocyclohexane (BHC) 319-84-6 290.82
9 β-Hexachlorocyclohexane (BHC) 319-85-7 290.83
10 δ-Hexachlorocyclohexane (BHC) 319-86-8 290.83
11 Dichlorvos 62-73-7 C4H7O4Cl2P 220.98
12 Malathion 121-75-5 C10H19O6PS2 330.35
13 Dimethoate 60-51-5 C5H12NO3PS2 229.25
14 Parathion 56-38-2 C10H14NO5PS 375
15 Parathion-methyl 298-00-0 C8H10NO5PS 263.2
16 Atrazine 1912-24-9 C8H14ClN5 215.68
17 Deltamethrin 52918-63-5 C22H19Br2NO3 505.2
18 Chlorothalonil 1897-45-6 C8Cl4N2 265.91
19 Chlorpyrifos 2921-88-2 C9H11Cl3NO3PS 350.59
20 Acetochlor 34256-82-1 C14H20ClNO2 269.77
21 Fenobucarb 3766-81-2 C12H17NO2 207.27
22 Butyl 2,4-dichlorophenoxyacetate 94-80-4 C12H14Cl2O3 277.15
23 Machette 23184-66-9 C17H26ClNO2 311.85
24 Dicofol 115-32-2 C14H9Cl5O 370.49
25 Monocrotophos 6923-22-4 C7H14NO5P 223.16
RW SE SF/PO PO/BAC BAC/SF
0.00 0.25 0.50 25 30
35 sand-O3-BAC
O3-BAC-sand
Processes
Turbidity (NTU
)
was effective in removing small particles of 1–2 µm. In O3–BAC–sand system, significant decrease in number concentration of small particles (1–2 µm) following ozo-nation was in contrast to an increase for the larger par-ticles (> 2 µm). This observation apparently agrees with previous reports [3, 26] that ozonation destabilized small particles and aggregated to form larger particles. Dissolu-tion of some small organic particles (1–2 µm) as a result by ozonation, on the other hand, may also be possible. Interesting to note, largest particle removal occurred in the BAC unit (Fig. 3) potentially as a result of its physi-cal filtration and biodegradation functions. The average counts for particles of 2–5 µm, 5–15 µm and > 15 µm in the finished water of O3–BAC–sand system were 331.45, 50.06 and 3.14 count/mL, respectively, in comparison with 460.4, 109.8, and 14.0 count/mL, respectively, in sand–O3–BAC system.
CODMn
The changes in CODMn along the treatment processes are shown in Fig. 4 and details are listed in Table 2. The CODMn value of finished water in sand–O3–BAC sys-tem was approximately 7% lower than that in O3 –BAC-sand system. The statistically significant difference shows the better CODMn removal in sand–O3–BAC. Similarly, day-to-day monitoring data of the finished water (Fig. 5) showed consistently lower CODMn in the finished water of sand–O3–BAC by an average of 0.12 mg/L.
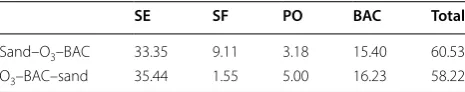
The main CODMn removal in sand–O3–BAC system occurred in coagulation–sedimentation, BAC and sand filtration (Table 3). Post-ozonation treatment only con-tributed a small fraction of the overall CODMn removal.
Here, ozonation functions to transfer organic molecules into smaller ones, such as acetic acid, aldehydes, and ketones, which could be assimilated into biomass in the following BAC filter [27, 28]. By contrast, in O3–BAC– sand, CODMn was largely removed by coagulation–sedi-mentation and BAC, while the CODMn removal by sand filtration was negligible. It is known that sand filtration is primarily used for the removal of particles downstream of the sedimentation process unit, in which organic particles like algae and small flocs harboring organic compounds are trapped resulting in the removal of inSCODMn [29]. Without the interception by sand filters, these particles would be oxidized directly by ozone and some would be trapped by the BAC filters.
We consider that the ozone consumption for inSCODMn removal may have affected other unit per-formance such as the efficiency of bio-refractory NOM transformation by ozonation. Without the interception by sand filters in the O3–BAC–sand system, these parti-cles would be oxidized directly by ozone and some would be trapped by the BAC filters. The consumption of ozone by inSCODMn could affect the removal efficiency of the bio-refractory organic compounds, including NOM, by ozonation. Moreover, BAC has actually taken on the filtration function in O3–BAC–sand system; thus, the particle and inSCODMn loading was higher than in sand– O3–BAC system. The increase in particle and inSCODMn loading to the BAC filter may change the BAC filter sur-faces resulting in lower efficiency for SCODMn biodeg-radation. Filter clogging also necessitates the increase in backwashing frequency, for example from once per 3 or 4 days to once a day in previous research [30], and from 102 to 72 h in this study, which would affect not only the biodegradation performance, but also the service life of BAC due to the increased wearing down of activated car-bon [31].
For these reasons, the adoption of O3–BAC with rear sand filtration in the treatment would encounter two drawbacks in CODMn removal: competition with solu-ble CODMn (SCODMn) for ozone by inSCODMn, and secondly, interference by accumulating particles in BAC to its biodegradation functions. The net result is lower CODMn removal efficiency of the rear sand filtration pro-cess (Fig. 4). To address the negative impact, Han et al. [7] suggested that up-flow BAC filtration may increase the CODMn removal by, a possibility that warrants fur-ther investigations.
Typical odorants
Over the four-month period, the FPA intensity in raw water was 5–8 for the septic odor and 4–6 for the musty odor, indicating the moderate to strong odor character-istics. In general, an FPA level of lower 3 was thought to
May June July Aug
0.00 0.04 0.08 10 20 30 40
Sampling date (month)
Turbidity (NTU
)
RW sand-O3-BAC O3-BAC-sand
SE SF PO BAC SE PO BAC SF 0
1000 2000 3000 4000
5000 sand-O3-BAC
O3-BAC-sand
Particle Counts (count/ml)
Processes
a b
c d
SE SF PO BAC SE PO BAC SF
0 1000 2000 3000 4000 5000
sand-O3-BAC O3-BAC-sand
Particle Counts (count/ml)
Processes
SE SF PO BAC SE PO BAC SF
0 200 400 600 800 1000
sand-O3-BAC O3-BAC-sand
Processes
Particle Counts (count/ml)
SE SF PO BAC SE PO BAC SF
0 20 40 60 80
100 sand-O
3-BAC
O3-BAC-sand
Particle Counts (count/ml)
Processes
Fig. 3 Changes of particle counts along the treatment trains. a 1–2 µm; b 2–5 µm; c 5–15 µm; d > 15 µm. sand–O3–BAC regular O3–BAC; O3–BAC–
sand O3–BAC with rear sand filtration; SE sedimentation; SF sand filtration; PO post-ozonation. The dotted line is the particle counts value of sand filtration effluent in the rear sand filtration process. The error bars represent mean ± S.D
RW SE SF PO BAC
0 1 2 3 4 5
Processes
CO
DMn
(mg/L)
TCOD SCOD inSCOD
a b
0 20 40 60 80 100
Proportion (%)
inSCOD SCOD
RW SE PO BAC SF
0 1 2 3 4 5
Proportion (%)
CO
DMn
(mg/L)
Processes
TCOD SCOD inSCOD
0 20 40 60 80 100
inSCOD SCOD
be acceptable for drinking water [32]. Our previous study [22] has shown the periodic occurrence of musty odor and long-term septic odor in the Huangpu River source water. The removal of the main odors and odorants by O3 and BAC is shown in Fig. 6. While the finished water from the two systems was odorless, the odorant removal performance was different. The raw water contained 26.7–72.4 ng/L septic odorants (total concentration of
dimethyl disulfide, dimethyl trisulfide and bis (2-chloro-1-methylethyl) ether) and 9.2–15.9 ng/L musty odor-ant (MIB). Overall, BAC filters in sand–O3–BAC system removed more septic and musty odorants than those in O3–BAC–sand system. The lower odorant removal effi-ciency in O3–BAC–sand system is likely attributed to the occupation of BAC surfaces by particles and the increased frequency of backwashing. The increase of backwashing frequency could decrease the biomass amount in the BAC filter,which might lead to unstable reactor performance [33]. The biomass and activity on the BAC filter might also have an impact on the odorant removal [34], which needs further investigation.
Pesticides
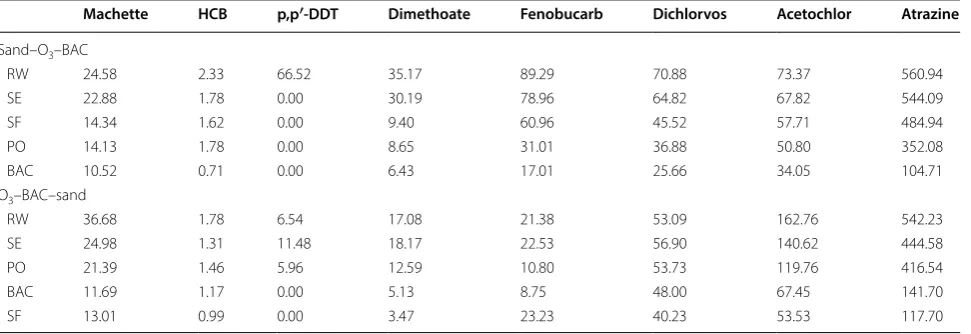
As shown in Table 4, among the 25 investigated, eight pesticides [machette, hexachlorobenzene (HCB), 2,2-bis (p-Chlorophenyl)-1,1,1-trichloroethane (p,p’-DDT), dimethoate, fenobucarb, dichlorvos, acetochlor, and atra-zine] were detected in the raw water. The concentration ranges from 3.94 to 646.81 ng/L, similar to those of our previous study [35]. As indicated in Table 5, the removal of pesticides was mainly contributed by ozonation (19.41%) and BAC (32.09%) in sand–O3–BAC, while the removal was by BAC in O3–BAC–sand system (42.58%). The total removals for sand–O3–BAC and O3–BAC– sand were 78.43% and 70.03%, respectively.
The lower pesticide removal by ozonation in O3–BAC– sand might be attributed to the competition for ozone by the particulate organic matters (inSCODMn). Because of sand filtration upstream of ozonation, sand–O3–BAC benefited from the sand filter in removal of pesticides (14.70%) that are probably adsorbed in the particles. However, for both systems, BAC showed a relatively high removal rate for the pesticides that are mostly biorefrac-tory, mainly because of the carbon adsorption [36, 37]. Relatively, higher pesticide removal was observed in sand–O3–BAC than O3–BAC–sand system, suggesting that the process offers better efficiency in the removal of micropollutants like pesticides. The difference in pes-ticide removal can be also potentially attributable to the performance of BAC unit process. Prior to the compara-tive treatability study, the sand–O3–BAC system had already been operated by 14 months more than O3– BAC–sand system. Such BAC condition may still retain some adsorption capacity as suggested [38] in a separate study. Separately, the specific degrading microbes in the BAC filter may have possibly developed during the filter operation, yielding additional treatment capacity. Some previous studies have shown that biodegradation plays an important role in pesticide removal in the BAC process [39].
Table 2 CODMn of different fractions along the treatment
processes (mg/L)
RW raw water, SE sedimentation, SF sand filtration, PO post-ozonation
RW SE SF PO BAC
Sand–O3–BAC
TCOD 3.96 2.64 2.28 2.15 1.56
SCOD 2.34 2.05 1.93 1.81 1.54
InSCOD 1.61 0.59 0.35 0.34 0.02
O3–BAC–sand
TCOD 3.98 2.57 1.66 2.37 1.72
SCOD 2.34 2.07 1.53 1.89 1.66
InSCOD 1.63 0.49 0.13 0.48 0.06
May June July Aug
0 1 2 3 4 5 6
RW sand-O3-BAC O3-BAC-sand
Sampling date (month)
CO
DMn
(mg/L)
Fig. 5 Month average of day-to-day total CODMn monitoring data of the finished water. RW raw water; sand–O3–BAC: regular O3–BAC; O3–
BAC–sand O3–BAC with rear sand filtration (Based on the day-to-day monitoring data from drinking water treatment plant; sampling date: from May to Aug, 2014). The error bars represent mean ± S.D
Table 3 Contribution of total CODMn removal by each unit
(%)
SE sedimentation, SF sand filtration, PO post-ozonation
SE SF PO BAC Total
Conclusion
A comparison was conducted for the sand–O3–BAC and the O3–BAC–sand process in terms of their per-formance in the removal of particles, organic matter and micropollutants. On average, the results showed turbidity of 0.12 NTU in sand–O3–BAC vs. 0.06 NTU in O3–BAC–sand, and the average counts for particles of 2-5 µm, 5-15 µm and > 15 µm of O3–BAC–sand were 331.45, 50.06 and 3.14 count/mL, respectively, com-pared to 460.39, 109.80, and 14.02 count/mL, respec-tively, in sand–O3–BAC. However, the relocation of the sand filter might sacrifice efficiency in the remov-als of organic matter (by about 7%) and micropollut-ants. Thus, for the O3–BAC–sand application, some
measures of enhanced coagulation should be suggested to improve the turbidity and particle removal, which would be helpful for enhancing the organic matter removal.
Abbreviations
O3–BAC–sand: O3–BAC with rear sand filtration; sand–O3–BAC: regular
O3–BAC; DOC: dissolved organic carbon; CODMn: chemical oxygen demand
by KMnO4 titration; SCODMn: soluble CODMn; inSCODMn: insoluble CODMn;
TCODMn: total CODMn; GC/MS: gas chromatography and mass spectrometry;
FPA: favor profle analysis; DMDS: dimethyl disulfide; 2-MIB: 2-methylisoborneol; GC × GC–TOFMS: comprehensive two-dimensional gas chromatography with time-of-fight mass spectrometry; HCB: hexachlorobenzene; p,p′-DDT: 2,2-bis (p-Chlorophenyl)-1,1,1-trichloroethane.
RW PO BAC RW PO BAC
0 20 40 60 80
100 sand-O O 3-BAC
3-BAC-sand
Processes
Residual ratio (%
)
a b
RW PO BAC RW PO BAC
0 20 40 60 80
100 sand-O O 3-BAC
3-BAC-sand
Processes
Residual ratio (%
)
Fig. 6 Changes of odorant concentrations along the treatment trains. a Sum of dimethyl disulfide, dimethyl trisulfide and bis (2-chloro-1-methylethyl) ether, b MIB. The error bars represent mean ± S.D
Table 4 Concentration of the detected pesticides in each treatment process (ng/L)
RW raw water, SE sedimentation, SF sand filtration, PO post-ozonation
Machette HCB p,p′-DDT Dimethoate Fenobucarb Dichlorvos Acetochlor Atrazine
Sand–O3–BAC
RW 24.58 2.33 66.52 35.17 89.29 70.88 73.37 560.94
SE 22.88 1.78 0.00 30.19 78.96 64.82 67.82 544.09
SF 14.34 1.62 0.00 9.40 60.96 45.52 57.71 484.94
PO 14.13 1.78 0.00 8.65 31.01 36.88 50.80 352.08
BAC 10.52 0.71 0.00 6.43 17.01 25.66 34.05 104.71
O3–BAC–sand
RW 36.68 1.78 6.54 17.08 21.38 53.09 162.76 542.23
SE 24.98 1.31 11.48 18.17 22.53 56.90 140.62 444.58
PO 21.39 1.46 5.96 12.59 10.80 53.73 119.76 416.54
BAC 11.69 1.17 0.00 5.13 8.75 48.00 67.45 141.70
Acknowledgements
The authors wish to thank Xiaoqing He and Xuan Cai from Minhang Water-works of Shanghai Water Production Branch of Shanghai SMI Water(Group) Co., Ltd. for the partial support of this study.
Authors’ contributions
KY designed the experiments, analyzed the data, and wrote the paper. KY, QYG, CMW, and PX mainly performed the particles, turbidity, CODMn, typical
odorants and pesticides detection. YJY, JWY and MY reviewed and edited the manuscript. All authors read and approved the final manuscript.
Funding
This study was supported by Funds for National Natural Science Foundation of China (No. 51778602), Major Science and Technology Program for Water Pollu-tion Control and Treatment (No. 2017ZX07207004, No. 2015ZX07406001).
Availability of data and materials
Not applicable.
Ethics approval and consent to participate
Not applicable.
Consent for publication
Not applicable.
Competing interests
The authors declare that they have no competing interests.
Author details
1 Key Laboratory of Drinking Water Science and Technology, Research Center
for Eco-Environmental Sciences, Beijing 100085, China. 2 University of the
Chi-nese Academy of Sciences, Beijing 100019, China. 3 Yancheng Institute
of Technology, Yancheng 224051, China. 4 Shanghai National Engineering
Research Center of Urban Water Resources Co., Ltd., Shanghai 200082, China.
5 US Environmental Protection Agency, Office of Research and Development,
Cincinnati, OH 45286, USA.
Received: 9 May 2019 Accepted: 1 July 2019
References
1. Peter A, von Gunten U (2007) Oxidation kinetics of selected taste and odor compounds during ozonation of drinking water. Environ Sci Technol 41(2):626–631
2. Asami M, Aizawa T, Morioka T, Nishijima W, Tabata A, Magara Y (1999) Bro-mate removal during transition from new granular activated carbon (GAC) to biological activated carbon (BAC). Water Res 33(12):2797–2804 3. Liao X, Chen C, Zhang J, Dai Y, Zhang X, Xie S (2015) Operational
perfor-mance, biomass and microbial community structure: impacts of backwash-ing on drinkbackwash-ing water biofilter. Environ Sci Pollut Res 22(1):546–554 4. Schreiber H, Schoenen D, Traunspurger W (1997) Invertebrate colonization
of granular activated carbon filters. Water Res 31(4):743–748
5. Kwon S, Moon E, Kim TS, Hong S, Park HD (2011) Pyrosequencing demon-strated complex microbial communities in a membrane filtration system for a drinking water treatment plant. Microbes Environ 26(2):149–155 6. Lu S, Shao Z, Zhong G, Chen J, Yang J, Guo J (2011) BAC
filtration—disinfec-tion—sand filtration combination technology for handling risk of microor-ganism leak in O3-BAC process. In: International conference on multimedia technology
7. Han L, Liu W, Chen M, Zhang M, Liu S, Sun R, Fei X (2013) Comparison of NOM removal and microbial properties in up-flow/down-flow BAC filter. Water Res 47(14):4861–4868
8. Lu S, Chen X, Yang J, Chen J, Zhong G, Li S, Liao W (2011) Analysis of mid-positioning BAC filter technology. In: International conference on multime-dia technology
9. Jie Z, Chen H, Chen C, Dai X (2014) Study on the migration and inactiva-tion of invertebrates in the advanced treatment process in waterworks. Fresenius Environ Bull 23(6):1314–1321
10. Hong S, Tang XC, Wu NX, Chen HB (2018) Leakage of soluble microbial products from biological activated carbon filtration in drinking water treat-ment plants and its influence on health risks. Chemosphere 202:626–636 11. Li C (2014) The Application of advanced treatment by ozonation and
acti-vated carbon combined process of southeast water plant in FuZhou. Fujian Archit Constr 7:55–57
12. Han L (2013) Full-scale Study of Yellow River reservoir water treatment with ozone-activated carbon rear-set sand filtration process. Shandong Jianzhu University
13. Zhu H, Xu B, Shen L, Sun H, Ma Z, Zha R (2009) Process introduction of Guanjing waterworks of Jiaxing city. Water Wastewater Eng 45(03):28–31 14. Wotton RS (2002) Water purification using sand. Hydrobiologia
469(1):193–201
15. Huerta-Fontela M, Galceran MT, Ventura F (2011) Occurrence and removal of pharmaceuticals and hormones through drinking water treatment. Water Res 45(3):1432–1442
16. Nam SW, Jo BI, Yoon Y, Zoh KD (2014) Occurrence and removal of selected micropollutants in a water treatment plant. Chemosphere 95(1):156–165 17. Nakada N, Shinohara H, Murata A, Kiri K, Managaki S, Sato N, Takada H (2007)
Removal of selected pharmaceuticals and personal care products (PPCPs) and endocrine-disrupting chemicals (EDCs) during sand filtration and ozo-nation at a municipal sewage treatment plant. Water Res 41(19):4373–4382 18. Nishijima W, Okada M (1998) Particle separation as a pretreatment of an
advanced drinking water treatment process by ozonation and biological activated carbon. Water Sci Technol 37(10):117–124
19. Yu Z (2011) Characteristics of the occurrence and health risk assessment of pesticides in drinking water and fish of China’s major cities. Graduate University of Chinese Academy of Sciences
20. APHA (2005) Standard methods for examination of water and wastewater. American Public Health Association, Washington DC
21. Guo Q, Li X, Yu J, Zhang H, Zhang Y, Yang M, Lu N, Zhang D (2015) Compre-hensive two-dimensional gas chromatography with time-of-flight mass spectrometry for the screening of potent swampy/septic odor-causing compounds in two drinking water sources in China. Anal Methods 7(6):2458–2468
22. Guo Q, Yang K, Yu J, Wang C, Wen X, Zhang L, Yang M, Xia P, Zhang D (2016) Simultaneous removal of multiple odorants from source water suffering from septic and musty odors: verification in a full-scale water treatment plant with ozonation. Water Res 100:1–6
23. Yan M, Wang D, Shi B, Wang M, Yan Y (2007) Effect of pre-ozonation on optimized coagulation of a typical North-China source water. Chemosphere 69(11):1695–1702
24. Snider EH, Porter JJ (1974) Ozone treatment of dye waste. J Water Pollut Control Fed 46(5):886–894
25. Roccaro P, Barone C, Mancini G, Vagliasindi FGA (2007) Removal of manga-nese from water supplies intended for human consumption: a case study. Desalination 210(1–3):205–214
26. Jekel MR (1983) The benefits of ozone treatment prior to flocculation processes. Ozone Sci Eng 5(1):21–35
27. de Souza SM, Bonilla KA, de Souza AA (2010) Removal of COD and color from hydrolyzed textile azo dye by combined ozonation and biological treatment. J Hazard Mater 179(1–3):35–42
28. Liao XB, Zhang XJ, Wang J, Li XB, Wang CK, Chen C (2013) Application of conventional and O3-BAC processes to treat organic matter and
antibiotic pollutants in a lake in East China. Water Sci Technol Water Supply 13(6):1470–1477
29. Hamoda MF, Al-Ghusain I, Al-Mutairi NZ (2004) Sand filtration of wastewater for tertiary treatment and water reuse. Desalination 164(3):203–211 30. Niquette P, Prévost M, Maclean RG, Thibault D, Coallier J, Desjardins R,
Lafrance P (1998) Backwashing first-stage sand-BAC filters. J Am Water Works Assoc 90(1):86–97
31. Ek M, Baresel C, Magnér J, Bergström R, Harding M (2014) Activated carbon for the removal of pharmaceutical residues from treated wastewater. Water Sci Technol 69(11):2372–2380
32. Suffet IH, Schweitze L, Khiari D (2004) Olfactory and chemical analysis of taste and odor episodes in drinking water supplies. Biotechnology 3(1):3–13 33. Lahav O, Artzi E, Tarre S, Green M (2001) Ammonium removal using a
novel unsaturated flow biological filter with passive aeration. Water Res 35(2):397–404
35. Yang K, Yu J, Guo Q, Wang C, Yang M, Zhang Y, Xia P, Zhang D, Yu Z (2017) Comparison of micropollutants’ removal performance between pre-ozonation and post-pre-ozonation using a pilot study. Water Res 111:147–153 36. Chien CC, Kao CM, Chen CW, Dong CD, Wu CY (2008) Application of
biofiltration system on AOC removal: Column and field studies. Chemos-phere 71(9):1786–1793
37. Lim TT, Yap PS (2016) Treatment of RO concentrate for enhanced water recovery from wastewater treatment plant effluent. Springer, Berlin Heidelberg, pp 1–22
38. Kim WH, Nishijima W, Baes AU, Okada M (1997) Micropollutant removal with saturated biological activated carbon (BAC) in ozonation-BAC process. Water Sci Technol 36(12):283–298
39. van der Hoek JP, Hofman JAMH, Graveland A (1999) The use of biological activated carbon filtration for the removal of natural organic matter and organic micropollutants from water. Water Sci Technol 40(9):257–264
Publisher’s Note